
Translate this page into:
Construct Validation and Reliability Assessment of Tamil Version of Epworth Sleepiness Scale to Evaluate Daytime Sleepiness among Adolescents in Rural Puducherry, South India
Address for correspondence: Dr. Yuvaraj Krishnamoorthy, Department of Preventive and Social Medicine, Jawaharlal Institute of Postgraduate Medical Education and Research, Puducherry, India. E-mail: yuvi.1130@gmail.com
This is an open access journal, and articles are distributed under the terms of the Creative Commons Attribution-NonCommercial-ShareAlike 4.0 License, which allows others to remix, tweak, and build upon the work non-commercially, as long as appropriate credit is given and the new creations are licensed under the identical terms.
This article was originally published by Medknow Publications & Media Pvt Ltd and was migrated to Scientific Scholar after the change of Publisher.
Abstract
Background:
Epworth sleepiness scale (ESS) has been used widely in the assessment of daytime sleepiness for research and clinical purposes. Hence, this study was done to translate the ESS in Tamil and to assess the construct validity and reliability of the Tamil version among adolescents in rural Puducherry, South India.
Materials and Methods:
Translation of the ESS by native language experts and pilot tested with subsample of adolescents. Final Tamil version was administered among 789 Tamil-speaking adolescents in the selected villages of rural Puducherry (union territory in South India). Construct validity was assessed by exploratory factor analysis through principal component method. Confirmatory factor analysis was done to obtain the goodness-of-fit. Reliability of questionnaire was assessed through Cronbach's alpha coefficient.
Results:
Two factor structures were obtained with Eigenvalues of 3.49 and 1.09, respectively. Both factors accounted for about 57.4% of the variance. Two-factor model assessed by confirmatory factor method found Chi-square value of 215.57 (P < 0.001). Goodness-of-fit revealed acceptable comparative fit indices (0.91). The reliability coefficient (Cronbach's alpha) for complete ESS was 0.81. Factor-based analysis showed that the Cronbach's reliability coefficient was 0.83 and 0.75 for the first and second factor, respectively.
Conclusion:
Our study concludes that the ESS questionnaire is internally valid and consistent with good reliability coefficient for application in Tamil-speaking rural adolescents. However, further research can be done to content validate the questionnaire with standard diagnostic tool.
Keywords
Adolescent
disorders of excessive somnolence
sleep
validation studies

INTRODUCTION
Excessive daytime sleepiness (EDS) can be defined as the increased propensity to sleep under circumstances considered inappropriate by the affected person and others. It is common symptom among various sleep disorders including sleep-related breathing disturbances such as obstructive sleep apnea.[123] Hence, to assess the level of general daytime sleepiness and identify sleep-related disorders in the general population, Johns developed a scale called Epworth sleepiness scale (ESS) in 1991.[4] This scale has been widely used in many countries throughout the world for research and clinical purposes.[5678] It is commonly used as it has simple structure and is easy to comprehend and complete rapidly.
ESS consists of questions related to eight distinctive situations in daily life and probability of falling asleep during each of these circumstances on a scale ranging from zero to three. In total, the score range from zero (normal) to 24 (very sleepy).[4] However, ESS was first developed for English population in Western countries. Hence, direct translation of the scale to other languages has certain limitations because of the economic and cultural differences. Several studies were conducted around the world for the translation and validation of the scale in different languages such as German, Turkish, Korean, Arabic, Urdu, Portuguese, Chinese, Greek, and Italian.[589101112131415] However, most of the studies were carried out for validation of questionnaire among adult population. Fewer attempts have been made around the world to validate the questionnaire among adolescents.[13]
Studies around India have shown that there has been a transition in sleep time of adolescents in both urban and rural setting, leading to poor sleep quality, daytime sleepiness, and poor academic performance. Main reason reported was the increasing use of mobile phones or social media and academic stress.[161718] Hence, there is a need to assess the sleep pattern among adolescents as they are becoming vulnerable to poor sleep pattern nowadays. However, there is no tool validated to use in local context. Hence, there is a need to adapt the western style questionnaire and validate the same for the local languages in India. ESS was validated for use in Hindi language.[19] However, we could not find any study on validation of ESS in any of the South Indian languages as Hindi version cannot be applied in South India, especially in rural setting because of lingual and cultural differences. Hence, the current study was carried out for translation of ESS into Tamil and then to validate the construct and assessment of reliability of the Tamil version of ESS among Tamil-speaking adolescents in Puducherry, South India.
MATERIALS AND METHODS
Study population
The study participants consisted of adolescents in the age group of 10–19 years residing in the selected villages of rural Puducherry, a union territory in South India. All the adolescents with Tamil as mother tongue and who were able to respond to the questionnaire in the study area were eligible to take part in the study. In total, 789 of the 823 eligible adolescents responded to the questionnaire. The study was conducted from March to April 2018.
Study tool
Epworth sleepiness scale
ESS questionnaire was first developed by Dr. Murray W. Johns in 1991 to capture the EDS of the participants during the routine events in day-to-day life.[4] The scale is an eight-item questionnaire having responses in four-point Likert scale, with score ranging from zero to three. The score of 11 or more is an indication of EDS. Further, the score ranging from 11 to 14 indicates moderate EDS and more than 15 indicates high level of EDS. These cutoffs are reported to have 93.5% sensitivity and 100% specificity to differentiate the absence, presence, and various grades of EDS.
Translation
Initially, translation of English version of the ESS questionnaire into Tamil was done by two bilingual literary language experts. They had no prior knowledge regarding the purpose, content, or interpretation of the questionnaire. Then, back translation of Tamil version into English was carried out by two different bilingual language experts. After which, comparison of the English back-translated version with the original English form of ESS was done. It was found to concur in accordance with the original version. Language and grammatical errors in the translated Tamil version were corrected. Then, Tamil version was pilot tested among subsample of adolescents (n = 15) for the assessment of difficulty in understanding the questions and final corrections in language and grammatical errors. Based on feedback during pilot testing, finer modifications were made and final Tamil version of ESS was obtained.
Data collection
Interns posted in rural health center catering to the study population were chosen as data collectors. They were sensitized regarding the study objectives, confidentiality of information, participants’ rights, and informed consent and were also trained in administration of the questionnaire to the individuals. Postgraduates posted in the center supervised the data collection procedure by reviewing all the questionnaires toward the end of each day to ensure completion of data collection forms and addressed any issues faced by the data collectors. The purpose and procedures involved in the study were explained to the participants before administration of the questionnaire. They were also assured of confidentiality of the information, and data collection was started after obtaining informed consent through house-to-house survey. The questionnaire had two sections: first section contained sociodemographic details such as age category, gender, and education; the second section comprised Tamil-translated version of ESS.
Statistical analysis
Data entry was done in Epidata v 3.01 software (EpiData Association, Odense, Denmark) and analysis was done using STATA version 14.2 (StataCorp, College Station, TX, USA). Continuous variables such as age were summarized as mean with standard deviation. Categorical variables such as gender and education were summarized as percentages. Evaluation of intercorrelation of ESS items was done using the values of Bartlett test of sphericity and Kaiser Meyer Olkin (KMO) measures of sampling adequacy. After the assumptions related to intercorrelation were satisfied, principal component factor analysis and correlation matrix of the ESS items were done to extract the factors. Factors with eigenvalue >1.0 were kept and interpreted. Factor loadings were calculated after applying varimax rotation, and values >0.4 were accepted for characterization of its factor.[2021] Confirmatory factor analysis (CFA) was then conducted to test the results obtained from exploratory factor analysis (EFA) by determining the goodness-of-fit of Tamil-translated version of ESS. Chi-square statistic was done to test the goodness-of-fit of the model. Several fit indices were utilized for the evaluation and comparison of descriptive goodness-of-fit: comparative fit indices (CFIs); root mean square error of approximation (RMSEA); and standardized root mean square residual (SRMR). Acceptable cutoff for fit indices was indicated by the CFI ≥0.90, SRMR ≤0.10, and the RMSEA ≤0.08.[22] Cronbach's alpha coefficient was measured for the assessment of internal consistency of the Tamil version ESS.
RESULTS
Sociodemographic characteristics
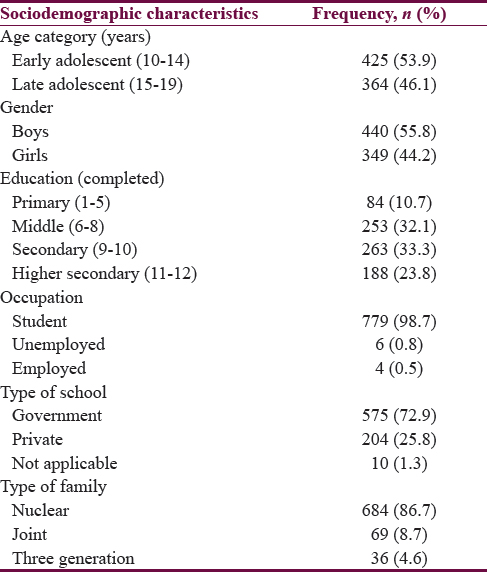
The mean age of the study participants was 14.1 (2.4) years. Table 1 explains the sociodemographic characteristics. Majority 425 (53.9%) participants belonged to early adolescent age group;[23] more than half 440 (55.8%) were boys; one-third 263 (33.3%) had completed secondary education; only one did not have any formal education. In total, 779 (98.7%) were students with almost three-fourth 575 (72.9%) studying in government school.
Exploratory and confirmatory factor analysis
Before conducting EFA, Bartlett test of sphericity and KMO measures of sample adequacy were assessed to check the intercorrelation level of the items in ESS. KMO value 0.80 indicated that there was very good intercorrelation between the items of ESS, and Bartlett test showed high significance (Chi-square 2086.97, P < 0.001) which indicates that the results were acceptable.
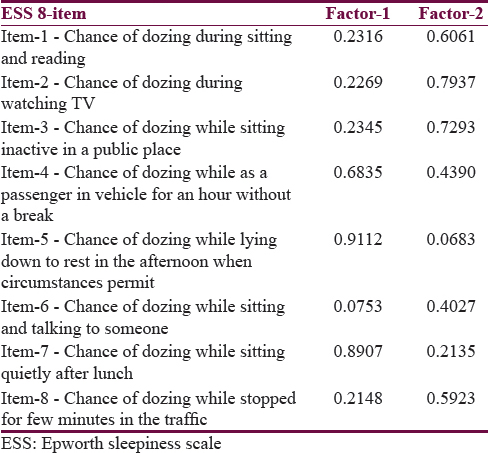
Table 2 details the EFA conducted with principal component method with correlation matrix. Two factors (Factor 1 and 2) which had Eigenvalue of 3.49 and 1.09 were retained and rotated factor loading was generated using varimax rotation. Three items included in Factor 1 (Item 4, Item 5, and Item 7) explained 28.8% of variance. These three items focused mainly on excessive sleepiness during inactive period. Five items included in Factor 2 (Item 1, Item 2, Item 3, Item 6, and Item 8) explained 57.4% of variance. Items in Factor 2 focused mainly on excessive sleepiness during active period. The correlation between Factor 1 and Factor 2 was found to be 0.44.
Two-factor models yielded through EFA were further analyzed through CFA. Initially, two-factor models were generated through structural equation modeling as shown in Figure 1. CFA revealed that two-factor model had Chi-square value of 215.57 with P < 0.001. Goodness-of-fit revealed acceptable CFIs (0.91) and SRMR (0.05) but mediocre RMSEA (0.10).
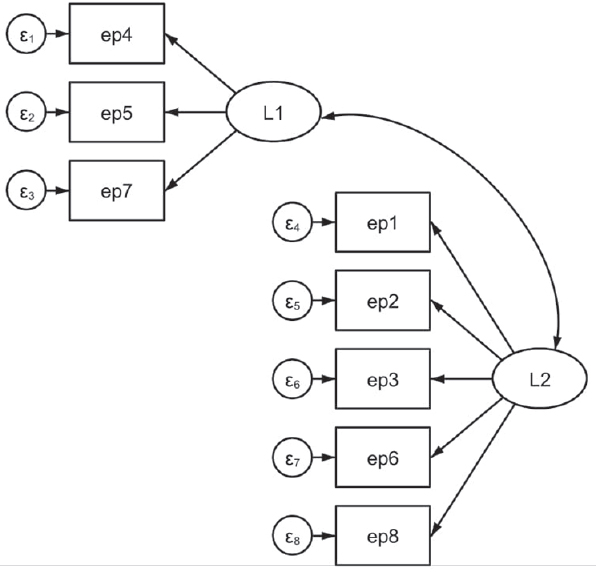
- Evaluated model of Epworth sleepiness scale structure generated through structural equation modeling. L1: Latent variable 1 (Factor 1), L2: Latent variable 2 (Factor 2), ep1–ep8: Epworth sleepiness scale item 1–8
Reliability of Epworth sleepiness scale
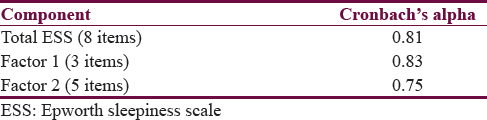
The reliability coefficient (Cronbach's alpha) for the overall questionnaire was found to be 0.81 indicating very good internal consistency which was explained in Table 3. In addition, further factor-based analysis showed that in the first factor (3 items), Cronbach's reliability coefficient was 0.83, and in the second factor (5 items), Cronbach's reliability coefficient was 0.75.
DISCUSSION
Tamil is the official and native language of the state Tamil Nadu and union territory Puducherry in India. There are approximately 70 million native speakers of Tamil in India. Outside India, Tamil is also official language in Singapore and Sri Lanka, and significant number of people in Malaysia is Tamil speakers. Validation of ESS and assessment of its reliability in Tamil can help the health professionals in clinical and research purposes. Hence, the main aim and purpose of the study were to validate the construct of ESS questionnaire and assess its reliability among Tamil-speaking adolescents.
Construct validation was done through exploratory factor and confirmatory factor method. First factor had three items and second factor had five items. All the factor loadings had high and statistically significant values. Further, CFA to compare and evaluate the goodness-of-fit of two-factor structure showed acceptable CFI and SRMR. The reliability assessment showed that the scale had good internal consistency similar to the English form of questionnaire, despite the lingual and cultural difference.[4] This reliability was also similar to the studies conducted in other countries among children and adolescents.[2425] Both the factor models also showed good internal consistency with acceptable Cronbach's alpha coefficient.
However, there were few problem items in the scale as discussed by a panel of experts. Certain questions such as riding a car were not culturally appropriate for adolescents, especially in a rural setting. We have rephrased the question as riding a bus instead of riding a car to make it more applicable to our study setting. Similar modifications were done by the previous study done in India for validation of the scale in Hindi language, in which they have removed such problem items and added more culturally appropriate questions, such as riding a bus or visiting a temple.[19] Hence, further modification can be done by discussing with the experts and community members to make the scale more suitable for the adolescents in Indian setting.
This study is the first one to validate the use of ESS questionnaire among adolescents in Indian population. Large sample size of 789 adolescents adds strength to the study. Homogeneity among the study population in the social, cultural, and economic context helps in generalization of the study results among the adolescents. However, validation done in our study can be applicable only to healthy Tamil-speaking adolescents for screening purpose and not applicable for adolescents with breathing-related sleep disturbances. We could not assess the test and retest reliability as the data collection was done at single time only. Content validity of the questionnaire cannot be tested in our study as the standard measure to diagnose daytime sleepiness by specialists was not done. Hence, further research on external validity of the questionnaire can be done to obtain the cutoff points for adolescents and check for comparability to the cutoff points of adults.
Daytime sleepiness assessment can be used to identify the population at risk of developing sleep disorders, especially the ones with breathing disturbances. Objective measurement of sleep quality through tests such as maintenance of wakefulness test and sleep latency test can be time-consuming and labor-intensive and not practically feasible for people in rural areas. In addition, the above-mentioned tests evaluate the patient in a specific circumstance conducted inside sleep laboratory and do not take the daily life activities into consideration. ESS can be used for identification of target population as it is easy to apply and understand and designed in such a way to reflect the average propensity of sleep during recent period.[10] It can even be applied at the routine adolescent clinics in primary health center or during school health visits by health workers.
Translation of this questionnaire in Tamil language and validation of it have provided a scientific basis for applying this scale among Tamil-speaking adolescents to screen for daytime sleepiness. However, this scale cannot be used as a diagnostic tool for distinguishing sleep disorders but used for screening purpose alone. Further modification can be done to the questionnaire to make it more culturally appropriate.
CONCLUSION
Our study concludes that the ESS for daytime sleepiness is internally valid and consistent with good reliability coefficient for application in Tamil-speaking rural adolescents. Construct validity assessment revealed a two-factor structure and acceptable fit indices for CFIs and SRMR. However, further research is required to prove the construct validity of an instrument as it is a continuous process of evaluation, reevaluation, refinement, and development.
Financial support and sponsorship
Nil.
Conflicts of interest
There are no conflicts of interest.
REFERENCES
- Daytime sleepiness: A risk factor in community life. Acta Neurol Scand. 1992;86:337-41.
- [Google Scholar]
- Excessive daytime sleepiness: A 1-year study in an unselected inpatient population. Sleep. 1982;5:239-47.
- [Google Scholar]
- A new method for measuring daytime sleepiness: The Epworth sleepiness scale. Sleep. 1991;14:540-5.
- [Google Scholar]
- The Epworth sleepiness scale in Portuguese adults: From classical measurement theory to Rasch model analysis. Sleep Breath. 2015;19:693-701.
- [Google Scholar]
- Psychometric properties of the Turkish version of the sleep hygiene index in clinical and non-clinical samples. Compr Psychiatry. 2015;59:135-40.
- [Google Scholar]
- The reliability and validity of the Korean version of the Epworth sleepiness scale. Int J Sci Prac Sleep Med. 2011;15:377-84.
- [Google Scholar]
- Validation of the Arabic version of the Epworth sleepiness scale. J Epidemiol Glob Health. 2014;4:297-302.
- [Google Scholar]
- Validation of the Urdu version of the Epworth sleepiness scale. J Pak Med Assoc. 2012;62:986-8.
- [Google Scholar]
- Validation of a Chinese version of the Epworth sleepiness scale. Qual Life Res. 2002;11:817-21.
- [Google Scholar]
- Italian version of the Epworth sleepiness scale: External validity. Neurol Sci. 2003;23:295-300.
- [Google Scholar]
- Reliability and validity studies of the Turkish version of the Epworth sleepiness scale. Sleep Breath. 2008;12:161-8.
- [Google Scholar]
- Prevalence and predictors of sleep wake disturbances among adolescents. Int J Contemp Med Res. 2016;3:2944-7.
- [Google Scholar]
- Sleep pattern of adolescents in a school in Delhi, India: Impact on their mood and academic performance. Indian J Pediatr 2018:1-8.
- [Google Scholar]
- Validation of a modified Hindi version of the Epworth sleepiness scale among a North Indian population. Ann Indian Acad Neurol. 2016;19:499-504.
- [Google Scholar]
- A Japanese version of the perceived stress scale: Cross-cultural translation and equivalence assessment. BMC Psychiatry. 2008;8:85.
- [Google Scholar]
- Factor structure and reliability of the Malay version of the perceived stress scale among Malaysian medical students. Malays J Med Sci. 2012;19:43-9.
- [Google Scholar]
- Evaluating the fit of structural equation models: Tests of significance and descriptive goodness of fit measures. MPR Online. 2003;8:23-74.
- [Google Scholar]
- UNICEF. The State of the World's Children 2011: Adolescence-an Age of Opportunity. UNICEF; 2011.
- Associations of executive function with sleepiness and sleep duration in adolescents. Pediatrics. 2009;123:e701-7.
- [Google Scholar]
- Relationships among sleepiness, sleep time, and psychological functioning in adolescents. J Pediatr Psychol. 2009;34:1175-83.
- [Google Scholar]


