
Translate this page into:
Evaluation of MR Visual Rating Scales in Major Forms of Dementia
Kavita Vani, DM Department of Radiology, Dr. Ram Manohar Lohia Hospital Delhi 110001 India kavita2vani@gmail.com
This article was originally published by Thieme Medical and Scientific Publishers Pvt. Ltd. and was migrated to Scientific Scholar after the change of Publisher.
Abstract
Abstract
Objective The aim of the study is to visually rate major forms of dementia using global cortical atrophy (GCA), medial temporal lobe atrophy (MTA), and Fazeka’s scales and Koedam’s score using magnetic resonance imaging (MRI). The purpose is to correlate the visual rating scales (VRS) with severity of dementia.
Materials and Methods Thirty patients fulfilling DSM 5 (Diagnostic and Statistical Manual of Mental Disorders) criteria for Alzheimer’s dementia (AD), vascular dementia (VaD), and frontotemporal dementia (FTD) underwent MRI brain. Cortical atrophy, medial temporal, and parietal lobe atrophy were assessed using GCA and MTA scales and Koedam’s score, respectively. White matter hyperintensities were assessed using Fazeka’s scale. Correlation between VRS and mini-mental state exam (MMSE) scores was done using Pearson correlation coefficient.
Results 70% of patients had Grade 2 GCA. More patients with AD had higher MTA scores as compared with others with 57% of AD patients showing abnormal for age MTA scores. Fazeka’s scale was abnormal for age in 58.33% of VaD and 57% AD patients. Majority (75%) showing severe parietal atrophy (Grade 3 Koedam’s score) were AD patients. Disproportionate frontal lobe atrophy was seen in all four (100%) FTD patients. Significant negative correlation was seen between MMSE and GCA scores of all patients (p-value = 0.003) as well as between MTA and MMSE scores in AD patients (p-value = 0.00095).
Conclusion Visual rating of MTA is a reliable method for detecting AD and correlates strongly with memory scores. Atrophy of specific regions is seen more commonly in some conditions, for instance, where MTA and parietal atrophy are specific for AD while asymmetric frontal lobe and temporal pole atrophy favor FTD.
Keywords
dementia
MRI
visual rating scales
GCA scale
MTA scale
Fazeka’s scale
Koedam’s score
MMSE

Introduction
Dementia affects 5% of the population over 65 years. Its prevalence rises rapidly with age.1 Imaging can exclude the treatable causes of dementia. The commonest causes of irreversible dementia include Alzheimer’s disease (AD) and vascular dementia (VaD); less commonly frontotemporal dementia (FTD). This study tries to highlight the role of magnetic resonance imaging (MRI) visual rating scales2 (VRS), global cortical atrophy (GCA), medial temporal lobe atrophy (MTA), Fazeka’s scale, and Koedam’s score3 and to correlate the VRS with severity of dementia as per mini-mental state exam (MMSE) scores. The findings were that VRS are quick, inexpensive, and reliable to get useful information for the diagnosis of subtype of dementia.
Materials and Methods
This analytical cross-sectional study was conducted in the Department of Radiodiagnosis. This prospective study was granted ethical clearance by the Institutional Review Board (IRB). Thirty consecutive patients reporting to Neurology OPD with subjective memory complaints and fulfilling DSM 5 Criteria for the diagnosis of AD, VaD, and FTD were recruited for the study after due consent. They were evaluated as per standard procedure in the Memory clinic. Dementia due to substance abuse, infections, brain tumors, head injury, nutritional deficiencies, and depression were excluded.
MRI was performed using Siemens 1.5 and 3 Tesla Magnetom Symphony MR system (as per available time slot), using appropriate phased array coils according to protocol. MRI sequences4 performed to assess structural changes were: T1-weighted axial, sagittal, coronal, and thin coronal oblique sequences. To detect white matter changes, T2-weighted fluid-attenuated inversion recovery (FLAIR) and a T2-weighted turbo spin echo sequence were done. Susceptibility weighted imaging sequence was used for assessing microhemorrhages. Visual rating was done using GCA scale, MTA scale, Fazeka’s scale, and Koedam’s score as described in annexure 1. Scores were arrived at by consensus amongst both readers. Statistical analysis was performed using the SPSS statistical package (version 21.0). Correlation between VRS and severity of dementia as assessed by MMSE scores was done using Pearson correlation coefficient. p-Value less than 0.05 was taken to indicate a significant difference.
Observations and Results
There were 14 (46.66%) patients of AD, 12 (40%) patients of VaD, and four (13.3%) patients of FTD.
Distribution of patients in each category (AD, VaD, and FTD) according to MMSE score and individual VRS (GCA, MTA, Fazeka’s and Koedam’s scores) is as in Table 1.
|
Type of dementia→ ↓Feature |
Grading |
AD (% of all AD) |
VaD (% of all VaD) |
FTD (% of all FTD) |
Total (% of total) |
|---|---|---|---|---|---|
|
Abbreviations: AD, Alzheimer’s dementia; FTD, frontotemporal dementia; GCA, global cortical atrophy; MMSE, mini-mental state exam; MTA, medial temporal lobe atrophy; VaD, vascular dementia; VRS, visual rating scale. |
|||||
|
MMSE |
0–10 (severe) |
– |
– |
– |
– |
|
11–20 (moderate) |
13 (93%) |
5 (42%) |
2 (50%) |
20 (66.66%) |
|
|
21–25 (mild) |
1 (7%) |
7 (58%) |
2 (50%) |
10 (33.33%) |
|
|
26–30 |
– |
– |
– |
– |
|
|
VRS–GCA score |
GCA 0 |
0 |
0 |
0 |
0 |
|
GCA 1 |
2 (14.3%) |
4 (33.3%) |
0 |
6 (20%) |
|
|
GCA 2 |
9 (64.3%) |
8 (66.6% |
4 (100%) |
21 (70%) |
|
|
GCA 3 |
3 (21.4%) |
0 |
0 |
3 (10%) |
|
|
VRS-MTA scale |
MTA 1 |
1 (7%) |
4 (33.3% |
2 (50%) |
7 (23.33% |
|
MTA 2 |
5 (35.7%) |
6 (50%) |
1 (25%) |
12 (40%) |
|
|
MTA 3 |
4 (28.6%) |
2 (16.7%) |
1 (25%) |
7 (23.33%) |
|
|
MTA 4 |
4 (28.6%) |
0 |
0 |
4 (13.33%) |
|
|
VRS Fazeka’s scale |
Fazeka 0 |
1 (7%) |
0 |
0 |
1 (3%) |
|
Fazeka 1 |
4 (28.6%) |
3 (25%) |
3 (75%) |
10 (33.33%) |
|
|
Fazeka 2 |
2 (14%) |
2 (16.7%) |
1 (25%) |
5 (16.66%) |
|
|
Fazeka 3 |
7 (50%) |
7 (58.3%) |
0 |
14 (46.66% |
|
|
VRS Koedam score |
Koedam 0 |
0 |
1 (8%) |
0 |
1 (3.33%) |
|
Koedam 1 |
6 (43%) |
7 (58%) |
1 (25%) |
14 (46.66%) |
|
|
Koedam 2 |
5 (36%) |
3 (25%) |
3 (75%) |
11 (36.66%) |
|
|
Koedam 3 |
3 (21%) |
1 (8%) |
0 |
4 (13.33%) |
|
Distribution of patients according to abnormal for age MTA scale and Fazeka’s scale is as in Table 2.
|
Type of dementia→ ↓Feature |
Grading |
AD (% of all AD) |
VaD (% of all VD) |
FTD (% of all FTD) |
Total (% of total) |
|---|---|---|---|---|---|
|
Abbreviations: AD, Alzheimer’s dementia; FTD, frontotemporal dementia; MTA, medial temporal lobe atrophy; VaD, vascular dementia; VRS, visual rating scales. |
|||||
|
VRS MTA scale |
Abnormal for age |
8 (57%) |
7 (58%) |
0 |
15 (50%) |
|
Normal for age |
6 (43%) |
5 (42%) |
4 (100%) |
15 (50%) |
|
|
VRS Fazeka’s scale |
Abnormal for age |
8 (57%) |
7 (58.3%) |
0 |
15 (50%) |
|
Normal for age |
6 (43%) |
5 (41.7%) |
4 (100%) |
15 (50%) |
|
MRI findings in VaD are as in Table 3.
|
MRI features |
No. of patients |
Percentage |
|---|---|---|
|
Abbreviation: MRI, magnetic resonance imaging. |
||
|
Lacunar infarcts |
8 |
66.6 |
|
Large infarcts |
4 |
33.3 |
|
Microhemorrhages |
4 |
33.3 |
MRI findings in FTD: Disproportionate frontal lobe atrophy was seen in all four FTD patients of whom three (75%) had symmetrical frontal atrophy. The fourth patient had asymmetrical frontal atrophy (left greater than right). Asymmetrical (left greater than right) temporal lobe atrophy, particularly involving the temporal pole with relative preservation of more posterior structures was seen in one patient.
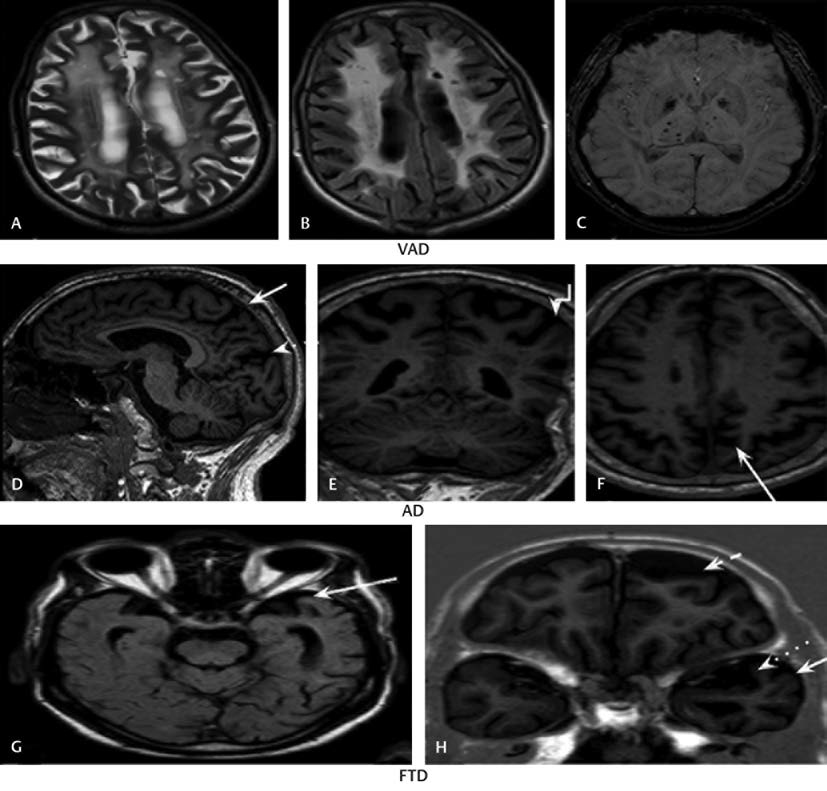
Representative images are as in Figs. 1 2. Grading by GCA scale, MTA scale, and Fazeka’s scale is demonstrated in Fig. 1. MRI of a typical VaD case with chronic lacunar infarcts and microhemorrhages with Fazeka’s Grade 3 white matter hyperintensities (WMH) is shown in Fig. 2 a c. The next row, 2 d e f illustrate a typical case of AD, graded as Koedam’s score 3 with widened posterior occipital sulcus (dotted arrow), posterior cingulate sulcus (solid arrows), and parietal atrophy (elbow arrow). The last row, 2 g h are of a case of FTD, wherein asymmetric anterior temporal pole atrophy (solid arrow) with widened left sylvian fissure (dotted arrow) and left sided frontal atrophy (dashed arrow) are seen.
-
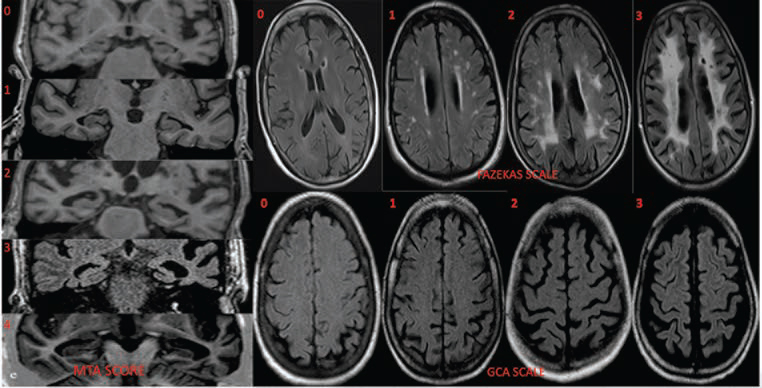
Fig. 1 First column shows T1 coronal oblique images for MTA grading (0–4); axial FLAIR sections top row demonstrates grading of white matter lesions by Fazekas scale and bottom row shows GCA scale. FLAIR, fluid-attenuated inversion recovery; GCA, global cortical atrophy; MTA, medial temporal lobe atrophy.
Fig. 1 First column shows T1 coronal oblique images for MTA grading (0–4); axial FLAIR sections top row demonstrates grading of white matter lesions by Fazekas scale and bottom row shows GCA scale. FLAIR, fluid-attenuated inversion recovery; GCA, global cortical atrophy; MTA, medial temporal lobe atrophy.
-
Fig. 2 (A–C) VaD. Fazekas Grade 3 with chronic infarcts and microhaemorrhages; (D–F) AD. Koedam score 3 with widened posterior occipital sulcus (dotted arrow), posterior cingulate sulcus (solid arrows) and parietal atrophy (elbow arrow); (G, H) FTD. Asymmetric anterior temporal pole atrophy with widened left sylvian fissure and left-sided frontal atrophy (dashed arrow). AD, Alzheimer’s dementia; FTD, frontotemporal dementia; VaD, vascular dementia.
Fig. 2 (A–C) VaD. Fazekas Grade 3 with chronic infarcts and microhaemorrhages; (D–F) AD. Koedam score 3 with widened posterior occipital sulcus (dotted arrow), posterior cingulate sulcus (solid arrows) and parietal atrophy (elbow arrow); (G, H) FTD. Asymmetric anterior temporal pole atrophy with widened left sylvian fissure and left-sided frontal atrophy (dashed arrow). AD, Alzheimer’s dementia; FTD, frontotemporal dementia; VaD, vascular dementia.
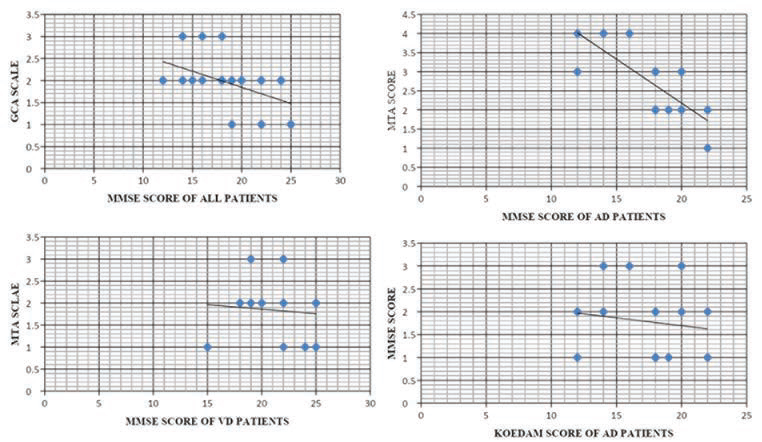
Correlation of VRS with severity of dementia: The correlation, shown in Fig. 3, between MMSE scores and each VRS was calculated separately using Pearson correlation coefficient. However, the severity of FTD could not be correlated with the VRS due to small sample size of FTD patients.
-
Fig. 3 Correlation between MMSE scores and GCA scores of all patients, MTA scores and MMSE scores in AD patients, MMSE scores and MTA scores of VaD patients and between MMSE scores and Koedam scores of AD patients. AD, Alzheimer’s dementia; GCA, global cortical atrophy; MMSE, mini-mental state exam; MTA, medial temporal lobe atrophy; VaD, vascular dementia.
Fig. 3 Correlation between MMSE scores and GCA scores of all patients, MTA scores and MMSE scores in AD patients, MMSE scores and MTA scores of VaD patients and between MMSE scores and Koedam scores of AD patients. AD, Alzheimer’s dementia; GCA, global cortical atrophy; MMSE, mini-mental state exam; MTA, medial temporal lobe atrophy; VaD, vascular dementia.
There was a moderate negative correlation between MMSE scores and GCA scores of all patients implying a tendency for high GCA scores in patients who have low MMSE scores. The value of R was -0.5212. The p-value was 0.003157. The result is significant at p < 0.05. A strong negative correlation was established between MTA scores and MMSE scores in AD patients. Hence high MTA scores are likely to be found in patients who have low MMSE scores (and vice versa). The value of R was -0.7827. The p-value was 0.000951. The result is significant at p < 0.05. There was negative correlation between MMSE scores and MTA scores of VaD. Thus, high MTA scores are likely to be found in patients who have low MMSE scores in VaD. The value of R was -0.0923. The p-value was 0.776129. The result is not significant at p < 0.05.
Weak negative relationship was found between MMSE scores and Fazeka’s scale of AD patients. The value of R was -0.224. The p-value was 0.441388. The result is not significant at p < 0.05.
A weak positive correlation was found between MMSE scores and Fazeka’s scale in VaD patients. The value of R was 0.3734. The p-value was 0.231863. The result is not significant at p < 0.05.
Negative correlation was found between MMSE scores and Koedam’s scores of AD patients. This suggests that high Koedam scores are associated with increasing severity of dementia. The value of R was -0.1425. The p-value was 0.628212. The result is not significant at p < 0.05.
Negative correlation was established between MMSE scores and Koedam’s score in VaD patients. The value of R was 0.4135. The p-value was 0.181501. The result is not significant at p < 0.05. Graphs demonstrating correlation between MMSE and VRS are as in Fig. 3.
Discussion
It is estimated that up to 20% of the population above 80 years of age is affected by dementia. Imaging can exclude the treatable causes of dementia such as subdural hematomas, infections, and tumors easily. The commonest causes of irreversible dementia include AD and VaD and less commonly FTD. Rarer causes of dementia are dementia with Lewy bodies, idiopathic Parkinson’s disease, and Huntington’s disease. If the cause of dementia can be identified, patients can access appropriate treatment and care, and treating physician can prognosticate. In early stages of dementia, when the diagnosis is often uncertain, MRI can be used to identify imaging features relevant to specific diagnosis, which help to determine the subtype of dementia. The aim of this study is to highlight the role of MRI VRS to assess regional atrophy and subcortical cerebrovascular disease in dementia. In this study, we attempt to verify the diagnostic potential of MRI VRS, viz, GCA scale, MTA scale, Fazeka’s scale, and Koedam’s score in patients of AD, VaD, and FTD and their utility in differential diagnosis of dementia.
-
Age and sex distribution: Age of the patients included in the study ranged from 42 to 90 years. Mean age was 67.76 years. Maximum (11 out of 30, that is 36.7%) number of patients were between 70 to 80 years of age. Majority of the patients of AD were in the age group of 70 to 80 with mean age of 75.6 years. In VaD, the age group ranged from 60 to 70 years with mean age of 67 years. The mean age of patients of FTD was 65.25 years. Age is the most important risk factor of dementia. Previous studies have documented marked increase in prevalence with progressing age. In our study there were 27 males and three females, that is, a male: female ratio of 9:1. A similar study was conducted by Wattjes et al5 to assess VRS in 30 patients (44–85 years), 21 of whom were men (44–82 years) and nine were women (51–85 years). Although dementia is more prevalent in females, compared with men, women receive less primary health care. This might explain the male predominance in our study.6
-
Risk factors/comorbid conditions: Out of the 30 patients included in our study 16 (53.33%) were hypertensive, three (10%) were diabetic, four (13.33%) had a history of alcohol abuse, and three (10%) had an associated family history of dementia. Hypertension was the most common associated comorbid condition in AD patients in our study. These associations may be due to the coincidence of common disorders in the geriatric population or due to synergistic (AD+VaD) pathogenesis of dementia.7 Hypertension was present in 11 out of 12 (91.66%) patients of VaD included in our study and diabetes in 25% of patients. The risk for developing dementia increases with the number of vascular risk factors. The presence of diabetes is also contributory.
-
MMSE score: MMSE scores of majority (66.66%) of patients were in the range of 10 to 20 that indicate moderate cognitive impairment. Mild cognitive impairment was seen in rest of the patients. Mean MMSE score of all patients was 19. The mean MMSE score was 16.9, 21.33, and 19.5 for AD, VaD, and FTD patients, respectively. In a similar study, by Duara8 et al, the mean MMSE score of AD patients was 22.9 ± 3.8.
-
VRS
∘ GCA scale: Most (21 out of 30, that is, 70%) patients were found to have Grade 2 GCA, of whom nine, eight, and four were AD, VaD, and FTD patients, respectively. Mild Grade 1 atrophy was noted in two AD and four VaD, that is, a total of six patients (20%). Severe GCA was found in 10% (3/30) patients; all had AD. Mean GCA score of all patients was 2. A study by Topiwala et al9 to evaluate the MRI correlates of cognitive impairment in elders, noted that most participants had Grade 2 GCA while only a few had Grade 1 GCA.
∘ MTA scale: Five out of 14 AD, six of 12 VaD, and one of four FTD, that is 40% of all, patients were assigned Grade 2 MTA score. MTA score 3 was assigned to seven patients (23.33%), of whom four had AD, two had VaD and one had FTD. MTA score 1 was seen in one AD, four VaD, and two FTD, that is, a total of 23.33% of all patients. All four patients found to have MTA score 4 were AD patients. Higher MTA scores were assigned to patients with AD as compared with other patients in the present study suggesting that MTA score can differentiate between various types of dementias like AD and FTD. This was also noted in a previous study10 which concluded that MTA assessment can serve as a biomarker for supporting the diagnosis of AD. The mean MTA score in present study was 2.26. A study by Tuokkola et al11 in which patients had a mean MTA score of 2.2, had similar findings.
∘ Fazeka’s scale: Most (14 out of 30) of the patients were found to have Fazeka’s Grade 3 WMHs, of whom, seven were suffering from AD and seven from VaD. Four AD, three VaD, and three FTD patients were assigned Grade 1 Fazeka’s. Grade 2 WMH were present in two out of 14 AD, two out of 12 VaD, and one out of four FTD patients. Of the total 30, only one patient, who had AD, had no white matter lesions. The high frequency of Grade 3 WMH in VaD and AD patients suggests that vascular white matter injury increases the risk of dementia. The mean Fazeka’s score of all patients in our study was 2.1. The mean Fazeka’s score of all patients having memory complaints was 1.9 in another study.12
∘ Koedam’s score: Six AD, seven VaD patients, and three FTD, that is, a total of 16 patients were found to have Grade1 Koedam’s score. Nine patients were assigned Grade 2 Koedam’s score, of whom, five had AD, three had VaD, and one had FTD. Grade 3 atrophy was present in three AD and one VaD patient. Grade 0 parietal atrophy was seen in only one patient. Majority of the patients showing moderate to severe parietal atrophy were AD patients, indicating that Koedam’s score may be a useful aid to establish diagnosis of AD. Lehmann et al13 noted that in addition to MTA being a feature of AD, prominent posterior atrophy (PA) is also frequently found. Mean Koedam’s score of all patients in our study was 1.53. Similarly, Hsu et al14 performed visual scoring for MTA, PA (parietal atrophy), and WMH and noted that mean PA score of all patients was 1.5.
-
MRI features of different dementias:
∘ AD: Majority (eight out of 14) of the AD patients had moderate to severe MTA with widening of temporal horn of lateral ventricle and volume loss of hippocampus. Hippocampal atrophy and MTA have been shown to be among the most accurate imaging markers of AD.15 Bilateral parietal atrophy predominantly involving the precuneus and posterior cingulate sulcus was seen in AD patients in our study. White matter changes in the form of periventricular and deep white matter FLAIR hyperintensities were also evident in most AD patients.
∘ VaD: Multiple, bilateral lacunar infarcts in deep gray matter were present in eight out of 12 patients of VaD. Chronic large infarcts were present in four, of whom, two patients had single large territorial strokes in the middle cerebral artery and posterior cerebral artery territory of the dominant hemisphere. Microhemorrhages in deep brain regions were seen in four out of 12 (33.33%) VaD patients. Diffuse white matter T2/FLAIR hyperintensities involving the periventricular and deep white matter were visualized in all VaD patients, of whom ten had extensive large confluent areas of WMH. Our findings were consistent with the typical findings described in VaD.16 Seven (58.33%) patients were also found to have MTA which was abnormal for age. Associated moderate GCA was noted in most patients.
∘ FTD: Disproportionate frontal lobe atrophy associated with insular atrophy was seen in all four; three had symmetrical and one patient had asymmetrical frontal atrophy (left greater than right). Asymmetric temporal lobe atrophy was seen in one patient (left greater than right) with prominent temporal pole involvement, widened left sylvian fissure, widened temporal horn of left lateral ventricle with relative preservation of more posterior structures. Similar findings of asymmetric frontal and anterior temporal atrophy being a differentiating feature of FTD have been described earlier.17 Knife-edge gyri, severe frontotemporal atrophy18 with dilated frontal horn, and a graded involvement, of anterior greater than posterior cerebrum, are highly suggestive of FTD.
∘ Correlation of VRS with severity of dementia: Using Pearson correlation coefficient, correlation between the severity of dementia as assessed by MMSE score and all VRS, was calculated. There was a moderate negative correlation between MMSE scores and GCA scores that suggests that high GCA scores are likely to be found in patients with low MMSE scores. The p-value was 0.003157, that is, the result is significant at p < 0.05. Our findings were similar to results of a population-based study in community-dwelling19 elders living in rural Ecuador that evaluated whether MoCA (Montreal Cognitive assessment) scores correlate with GCA. Total MoCA19 scores were significantly worse in persons with moderate to severe GCA. Hence, it was concluded that MoCA scores are related to severity of GCA.
A strong negative correlation was established between MTA scores and MMSE scores in AD patients. This suggests that high MTA scores are likely to be noted in patients with low MMSE scores (and vice versa). The p-value was 0.000951, which indicates that the result is significant at p < 0.05. There was a negative correlation between MMSE scores and MTA scores of VaD. However, the result is not significant at p < 0.05. Our results were similar to the findings of a study wherein they demonstrated that despite pathological20 differences AD and VaD, MTA values were strongly associated with cognitive function in both groups. Similarly, in another study by Torisson et al it was found that abnormal MTA21 was associated with lower scores on MMSE. Weak negative relationship was found between MMSE scores and Fazeka’s scale of AD patients. Weak positive correlation was found between MMSE scores and Fazeka’s scale in VaD patients. The result is not significant at p < 0.05. The relationship between WMH and cognition has been subject of controversy, with some studies failing to show an association between the two. In a study including patients with no WMH, mild to moderate WMH, and large areas of WMH, marked cognitive22 disturbances were detected only in the six subjects with the large WMH areas. Bigler23 et al reported that WMH burden did not correlate with MMSE scores. However, MMSE does not adequately assess the cognitive functions most strongly associated with WMH, i.e., executive functioning and processing speed. Mungas et al24 found that cognitive24 deficit in the context of subcortical cerebrovascular injury correlated better with cortical atrophy and hippocampal volume loss than with WMH volume. Negative correlation was found between MMSE scores and Koedam’s scores of AD and VaD patients. This suggests that high Koedam’s scores are associated with increased severity of dementia. However, the result is not significant at p < 0.05 which can be attributed to the small sample size in our study. Similarly in another study conducted by Hsu et al14 to determine whether the occurrence of PA and MTA was correlated with symptoms in AD patients, significant association was seen between MTA scores and MMSE while PA score was found to be a supportive measure for noncognitive symptoms.
Utility and limitations of structural MRI and VRS: Differentiating between the various subtypes of dementia is of great importance to guide management. However, accurate diagnosis can be difficult, as different etiologies can cause overlapping clinical symptoms. While molecular biomarkers of AD are available, logistical challenges limit their routine use.25 On the contrary, structural imaging is widely available and recommended as part of the clinical evaluation in dementia patients. Excellent tissue contrast and high resolution afforded by MRI allow for global and regional cerebral atrophy to be assessed, offering positive predictive value for underlying etiology. Sophisticated analytical methods to quantify atrophy have not been adopted into routine use due to specific hardware and software requirements and long processing times. Thus, VRS remain the primary means for extracting relevant diagnostic information in such cases. VRS can improve the diagnostic value of radiological image interpretation. One of the methodological advantages is that subjective visual ratings are robust. Differences among MRI scanners, motion artifacts, or artifacts generated by fluctuations in the MRI equipment can be easily ignored. Another merit is that VRS are fast. Finally, visual rating is a cost-effective method and it can be performed with any MRI software. This reduces equipment constraints. VRS suffer from many limitations including low fidelity output, less reproducibility, and less sensitivity compared with volumetric methods. Another major drawback of VRS is the mapping of a continuous variable (such as, severity of atrophy) to an ordinal scale (e.g., mild, moderate, and severe) with discrete scores. Hence the range of severity is limited which in turn limits the correlation with cognitive test scores. Scoring severity that falls between the categories is another matter of concern.26 In summary, our study demonstrates the utility of VRS to provide valuable diagnostic information, which aids in improving the accuracy of clinical diagnosis of dementia.
Conclusion
Presently, postmortem brain examination remains the only conclusive method of establishing diagnosis in dementia; however, structural imaging if considered in the context of the patient’s age and clinical examination can improve diagnostic accuracy during life.
From this study it can be concluded that VRS, designed for assessing focal atrophy and GCA in dementia provide a framework to identify relevant imaging findings for subtyping of dementia. VRS are quick, easy to use, and can be performed on images acquired routinely. VRS are cost-effective diagnostic tools suitable for clinical implementation. Visual rating of MTA is a reliable method of detecting AD and correlates significantly with memory scores. AD and VaD are associated with an increase in white matter changes on MRI and WMH can be used as an imaging biomarker for dementia and visual rating by Fazeka’s scale, a simple tool for providing information about their amount, appearance, size, and distribution. Atrophy patterns in combination of clinical assessment indicate specific pathology. MTA and parietal atrophy are specific for AD. Asymmetric frontal lobe atrophy and temporal pole atrophy and anterior to posterior gradient of atrophy are specific for FTD.
Recommendations
MRI should be performed at least once in the work-up of dementia to exclude reversible causes, to recognize vascular causes, and to identify specific findings to determine subtype of dementia. MRI protocol should include a volumetric T1-weighted scan, axial T2-weighted and FLAIR sequences, axial T2*-gradient echo sequence and DWI. Contrast administration as a routine, is not necessary. A radiological report should include: MTA, general or local widening of sulci, widening of ventricles, WMH (score according to Fazeka’s scale), size and location of infarcts, comparison with previous imaging, and conclusion (correlation of findings with clinical findings and other investigations). Coronal T1-weighted sequence is useful to assess MTA to aid in diagnosing AD. Specific patterns of focal atrophy assessed on T1-weighted images should be carefully evaluated especially in the MTL/parietal regions (as seen in AD), temporal pole/or frontal lobes (as seen in FTD).
Annexure 1
GCA Scale
Global cortical atrophy was assessed viewing supraventricular axial slices and rated from absent (0) to severe (3).27 The score ranges from 0 to 3 according to the following criteria:
0: normal volume.
1: opening of sulci peripherally.
2: widening along the length of gyri.
3: gyral thinning.17
MTA Scale
MTA evaluation was performed as described by Scheltens et al.29 Atrophy was scaled from value 0 to 4, where a value of 0 corresponded to no atrophy and a value of 4 corresponded to severe atrophy. If there was a discrepancy between left and right side, the highest degree of atrophy was used. The score was assigned based on visual rating of the width of the choroid fissure, width of the temporal horn, and height of the hippocampal formation. The MTA-score was rated on coronal T1-weighted images on a slice through the corpus of the hippocampus.28
0: No atrophy.
1: Only widening of choroid fissure.
2: Also widening of temporal horn of lateral ventricle.
3: Moderate loss of hippocampal volume.
4: Severe volume loss of hippocampus.
<70 years: score 2 or more is abnormal.
<80 years: score 3 or more is abnormal.
Fazeka’s scale 30: It was scored on transverse FLAIR images.
White Matter Lesions
0: No lesions.
1: Punctate foci.
2: Beginning confluence of foci.
3: Large confluent areas.
Periventricular Lesions
0: No lesions.
1: Caps or thin lines.
2: Smooth halo.
3: Extension into white matter.
Koedam’s score: To assess posterior atrophy (PA), Koedam score was used. The overall score based on the presence of atrophy in sagittal, axial, and coronal orientation, was assessed for left and right sides separately on sagittal and coronal sections of the T1-weighted sequence and axial sections of the FLAIR sequence. The following anatomical landmarks were rated in three different orientations: (a) sagittal orientation: widening of the posterior cingulate and parieto-occipital sulcus, and atrophy of the precuneus on left and right by considering paramedian sagittal images. (b) axial orientation: widening of the posterior cingulate sulcus and sulcal dilatation in parietal lobes on axial images. (c) coronal orientation: widening of the posterior cingulate sulcus and parietal lobes on coronal images. In case of different scores on different orientations, the highest score was considered.
|
Grade 0 |
No cortical atrophy |
Closed sulci of parietal lobes and cuneus |
|
Grade 1 |
Mild cortical atrophy |
Mild widening of posterior cingulate and parieto-occipital sulcus |
|
Grade 2 |
Substantial cortical atrophy |
Substantial widening of the sulci |
|
Grade 3 |
End-stage “knife blade” atrophy |
Extreme widening of the sulci |
Authors’ Contributions
S. K. and K. V. analyzed and interpreted the patient data regarding the radiological findings. S. K. and S. C. made substantial contributions to the acquisition, analysis, and interpretation of data, confirmed by K. V. and R. K. D. S. K. and K. V. were major contributors in writing the manuscript. All five authors read and approved the final manuscript. K. S. A. and R. K. D. made substantial contributions to the review of the manuscript. S. K. and S. C. drafted the work. K. V. substantively revised it. K. V. has agreed both to be personally accountable for own contributions and to ensure that questions related to the accuracy or integrity of any part of the work are appropriately investigated, resolved, and the resolution documented in the literature.
Ethical Approval
The work is approved by institutional review board.
Conflict of Interest
None declared.
Funding None.
References
- Imaging biomarkers of dementia: recommended visual rating scales with teaching cases. Insights Imaging. 2017;8(1):79-90.
- [Google Scholar]
- Visual assessment of posterior atrophy development of an MRI rating scale. Eur Radiol. 2011;21(12):2618-2625.
- [Google Scholar]
- American College of Radiology. ACR Appropriateness Criteria® Dementia. Available at: https://acsearch.acr.org/docs/3111292/Narrative. Accessed April 28, 2020
- Diagnostic imaging of patients in a memory clinic: comparison of MR imaging and 64-detector row CT. Radiology. 2009;253(1):174-183.
- [Google Scholar]
- Inequalities in receipt of mental and physical healthcare in people with dementia in the UK. Age Ageing. 2017;46(3):393-400.
- [Google Scholar]
- Cache County Investigators. Vascular risk factors for incident Alzheimer disease and vascular dementia: the Cache County study. Alzheimer Dis Assoc Disord. 2006;20(2):93-100.
- [Google Scholar]
- Medial temporal lobe atrophy on MRI scans and the diagnosis of Alzheimer disease. Neurology. 2008;71(24):1986-1992.
- [Google Scholar]
- Resilience and MRI correlates of cognitive impairment in community-dwelling elders. Br J Psychiatry. 2015;207(5):435-439.
- [Google Scholar]
- The utility of age-specific cut-offs for visual rating of medial temporal atrophy in classifying Alzheimer’s disease, MCI and cognitively normal elderly subjects. Front Aging Neurosci. 2013;5:47.
- [Google Scholar]
- Visual rating method and tensor-based morphometry in the diagnosis of mild cognitive impairment and Alzheimer’s disease: a comparative magnetic resonance imaging study. Acta Radiol. 2016;57(3):348-355.
- [Google Scholar]
- LADIS Group. Impact of white matter hyperintensities scoring method on correlations with clinical data: the LADIS study. Stroke. 2006;37(3):836-840.
- [Google Scholar]
- Posterior cerebral atrophy in the absence of medial temporal lobe atrophy in pathologically-confirmed Alzheimer’s disease. Neurobiol Aging. 2012;33(3):627.e1-627.e12.
- [Google Scholar]
- Posterior atrophy and medial temporal atrophy scores are associated with different symptoms in patients with Alzheimer’s disease and mild cognitive impairment. PLoS One. 2015;10(9):e0137121.
- [Google Scholar]
- Neuroimaging tools to rate regional atrophy, subcortical cerebrovascular disease, and regional cerebral blood flow and metabolism: consensus paper of the EADC. J Neurol Neurosurg Psychiatry. 2003;74(10):1371-1381.
- [Google Scholar]
- Frontotemporal dementia and Alzheimer disease: evaluation of cortical atrophy with automated hemispheric surface display generated with MR images. Radiology. 1998;208(2):431-439.
- [Google Scholar]
- EFNS task force: the use of neuroimaging in the diagnosis of dementia. Eur J Neurol. 2012;19(12):e131-e140, 1487–1501.
- [Google Scholar]
- Global cortical atrophy (GCA) associates with worse performance in the Montreal Cognitive Assessment (MoCA). A population-based study in community-dwelling elders living in rural Ecuador. Arch Gerontol Geriatr. 2015;60(1):206-209.
- [Google Scholar]
- MIRAGE Study Group. Magnetic resonance imaging-measured atrophy and its relationship to cognitive functioning in vascular dementia and Alzheimer’s disease patients. Alzheimers Dement. 2011;7(5):493-500.
- [Google Scholar]
- Medial temporal lobe atrophy is underreported and may have important clinical correlates in medical inpatients. BMC Geriatr. 2015;15(1):65.
- [Google Scholar]
- Neuropsychological correlates of white-matter lesions in healthy elderly subjects. A threshold effect. Arch Neurol. 1992;49(5):549-554.
- [Google Scholar]
- White matter lesions, quantitative magnetic resonance imaging, and dementia. Alzheimer Dis Assoc Disord. 2002;16(3):161-170.
- [Google Scholar]
- MRI predictors of cognition in subcortical ischemic vascular disease and Alzheimer’s disease. Neurology. 2001;57(12):2229-2235.
- [Google Scholar]
- MRI visual rating scales in the diagnosis of dementia: evaluation in 184 post-mortem confirmed cases. Brain. 2016;139:1211-1225. (Pt 4)
- [Google Scholar]
- Neuroimaging of white matter in aging and dementia. Clin Neuropsychol. 2007;21(1):73-109.
- [Google Scholar]
- Usefulness of medial temporal lobe atrophy visual rating scale in detecting Alzheimer’s disease: preliminary study. Ann Indian Acad Neurol. 2013;16(3):384-387.
- [Google Scholar]


