
Translate this page into:
Deep learning for image classification between primary central nervous system lymphoma and glioblastoma in corpus callosal tumors
*Corresponding author: Thara Tunthanathip, Department of Surgery, Division of Neurosurgery, Faculty of Medicine, Prince of Songkla University, Songkhla, Thailand. tsus4@hotmail.com
-
Received: ,
Accepted: ,
How to cite this article: Jaruenpunyasak J, Duangsoithong R, Tunthanathip T. Deep learning for image classification between primary central nervous system lymphoma and glioblastoma in corpus callosal tumors. J Neurosci Rural Pract 2023;14:470-6.
Abstract
Objectives:
It can be challenging in some situations to distinguish primary central nervous system lymphoma (PCNSL) from glioblastoma (GBM) based on magnetic resonance imaging (MRI) scans, especially those involving the corpus callosum. The objective of this study was to assess the diagnostic performance of deep learning (DL) models between PCNSLs and GBMs in corpus callosal tumors.
Materials and Methods:
The axial T1-weighted gadolinium-enhanced MRI scans of 274 individuals with pathologically confirmed PCNSL (n = 94) and GBM (n = 180) were examined. After image pooling, pre-operative MRI scans were randomly split with an 80/20 procedure into a training dataset (n = 709) and a testing dataset (n = 177) for DL model development. Therefore, the DL model was deployed as a web application and validated with the unseen images (n = 114) and area under the receiver operating characteristic curve (AUC); other outcomes were calculated to assess the discrimination performance.
Results:
The first baseline DL model had an AUC of 0.77 for PCNSL when evaluated with unseen images. The 2nd model with ridge regression regularization and the 3rd model with drop-out regularization increased an AUC of 0.83 and 0.84. In addition, the last model with data augmentation yielded an AUC of 0.57.
Conclusion:
DL with regularization may provide useful diagnostic information to help doctors distinguish PCNSL from GBM.
Keywords
Image classification
Deep learning
Convolutional neural network
Glioblastoma
Lymphoma

INTRODUCTION
Glioblastoma (GBM) and primary central nervous system lymphoma (PCNSL) are common malignant brain tumors[1,2] and the prognosis for these intracranial tumors is poor.[3,4] Due to the differences in their radiological appearance, pre-operative magnetic resonance imaging (MRI) scans can help identify PCNSL from GBM. In detail, GBM is characterized by a solid homogenous enhancement with central hypointense necrosis, whereas PCNSL is characterized by a solid homogeneous enhancement.[5,6] However, pre-operative dexamethasone injection for vasogenic edema therapy causes PCNSL necrosis, which is mistaken for GBM on MRI images.[7] In addition, corpus callosal tumors are a challenge for classifying these two entities.
Machine learning (ML) has been utilized to distinguish PCNSL from GBM.[8-10] However, ML remains a semi-autonomous method for classification that needs the feature extraction process from images before model development and prediction.[10,11] Hence, the introduction of deep learning (DL) marks the beginning of a paradigm shift in image classification. This approach automatically incorporates the feature extraction and model development stages.[12-15] Therefore, DL has been studied to distinguish these tumors using image classification. McAvoy et al. used the DL model to classify PCNSL and GBM. They reported the area under the receiver operating characteristic curve (AUC) of 0.94–0.95.,[12] while Zhang et al. used DL for differentiating PCNSL, GBM, and tumefactive demyelinating lesions, with diagnostic performances between 0.95 and 1.00.[14]
In clinical practice, the biopsy of corpus callosal tumors for tissue diagnosis is a challenge. The mortality rate from biopsy has been reported to be 1.1%, occurring from postoperative intracranial bleeding.[5,16] Hence, the present study aimed to assess the diagnostic performances of the DL models between PCNSLs and GBMs at the corpus callosum.
MATERIALS AND METHODS
Study design and study population
This is a historical cohort study of 283 patients with PCNSL or GBM who had confirmed diagnoses from tissue specimens by a pathologist between January 2010 and December 2021. Patients were excluded as follows: (1) patients with missing MRI scans; (2) patients with inadequate MRI with movement artifacts. Following these criteria, 274 patients were selected. Descriptive statistics were utilized to investigate clinical and imaging findings using the R version 4.4.0 (R Foundation, Vienna, Austria).
Convolutional neural network (CNN)
The workflow of the present study is demonstrated, as shown in [Figure 1]. A CNN architecture comprises three consecutive convolutional-pooling layers and a fully-connected classification layer. The activation function was a rectifier linear unit, and the batch size was 32. The model was trained for 30 epochs, stochastic gradient descent optimized with the Adam optimizer, and the initial learning rate set to 0.001.
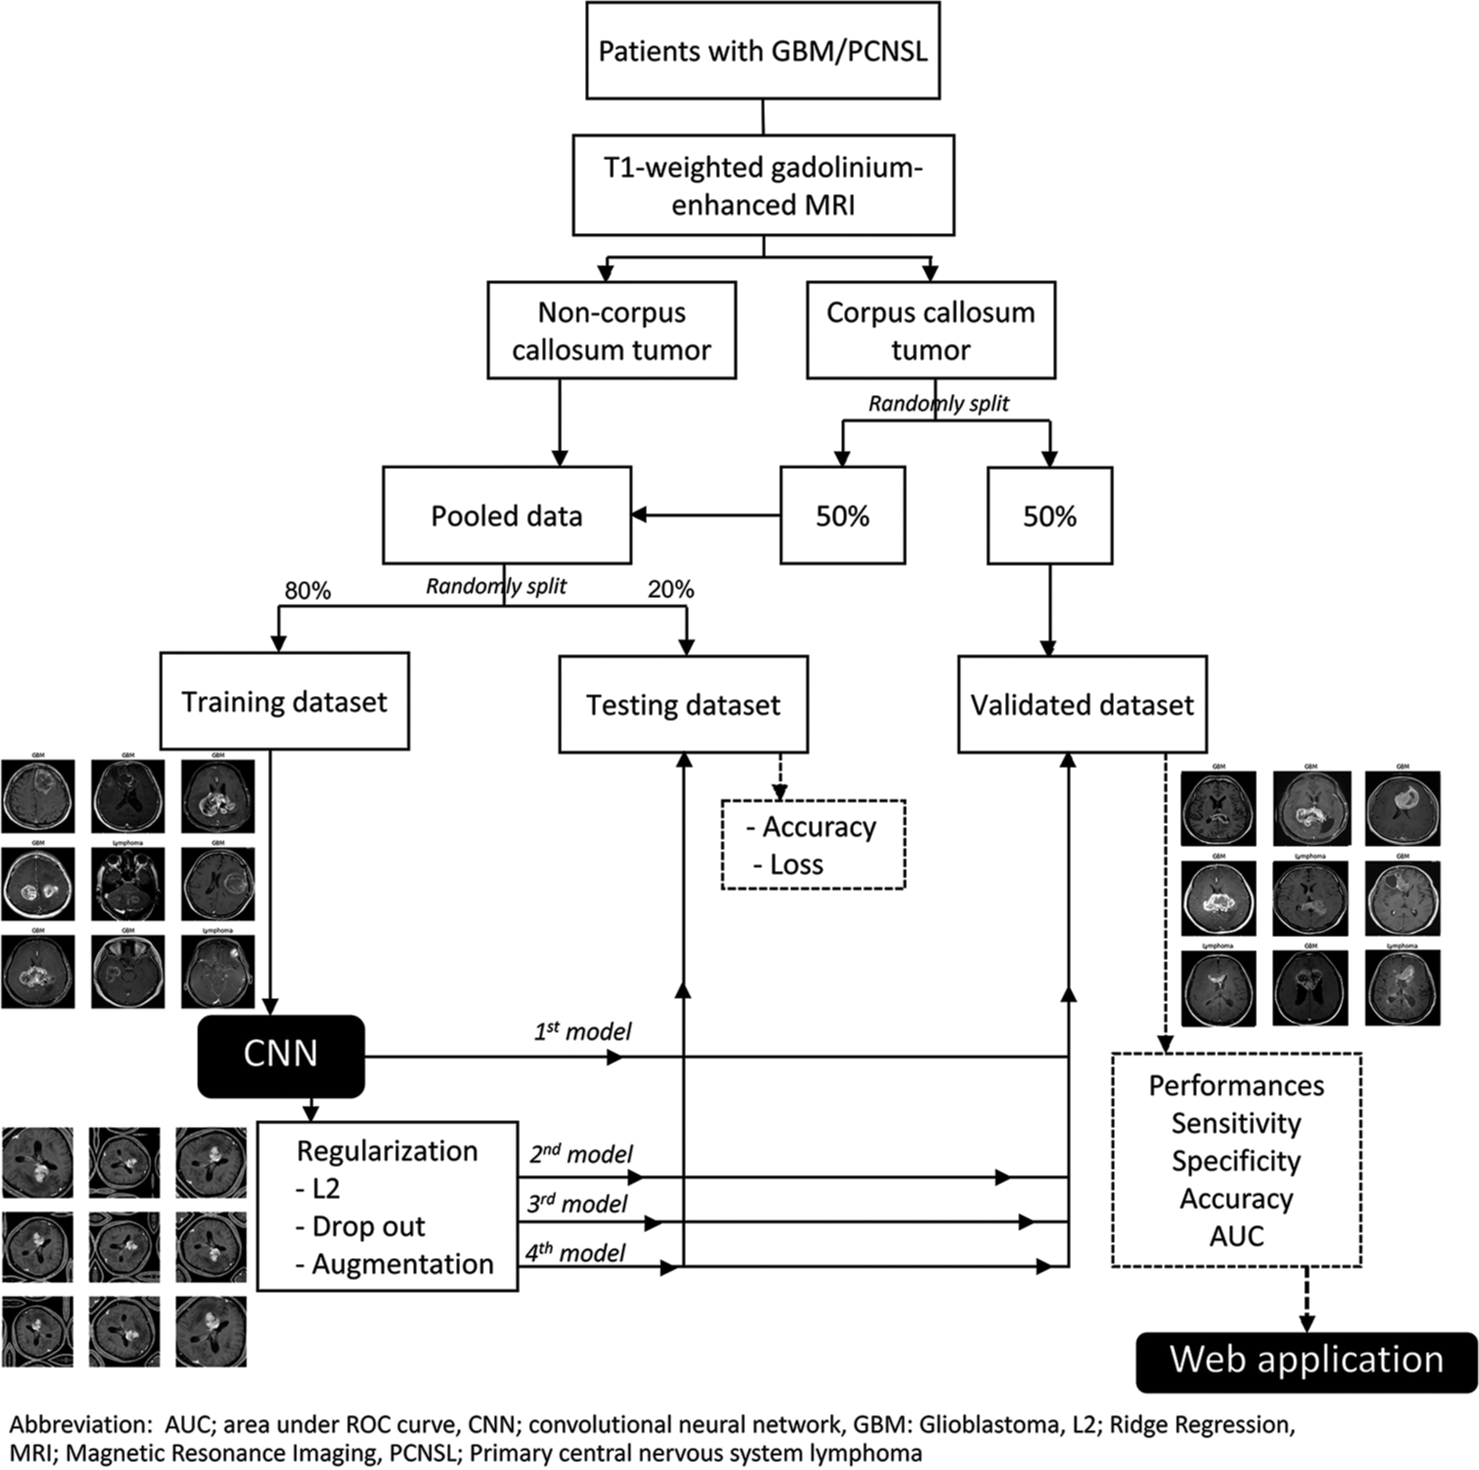
- Workflow of image classification in corpus colossal tumor.
In the first baseline model, regularization and data augmentation were not performed, while regularization was conducted in the second, third, and fourth models. Ridge regression (L2) regularization and a drop-out of 0.25 were done for the second and third models, respectively. In the fourth model, data augmentation was employed using random vertical and horizontal flips, rotation, and zoom.
Model development
The diagnostic performance of DL models was trained on MRI to classify PCNSLs (class 1) and GBMs (class 0) using the training dataset for DL model development. Therefore, the diagnostic accuracy and loss of the training and testing datasets were used to assess the models’ diagnostic performance during model development. Therefore, sensitivity, specificity, positive predictive value (PPV), negative predictive value (NPV), accuracy, F1 score, and AUC were calculated as the performance matric from the validated dataset with unseen images of corpus callosal images. In detail, the predictions of the DL models were compared with the pathological results by a pathologist as the gold standard. In addition, we evaluated the model’s discrimination of four models using the AUC.[17] The DL models were developed and validated using Python software with Keras version 2.4.0 (Python Software Foundation).
Model deployment as a web application
After validation, the DL model which had the best diagnostic performance was deployed as a web application in clinical practice. The web application was performed using Streamlit version 0.74.1 (Streamlit Inc.).
Ethical considerations
A Human Research Ethics Committee approved the present study (REC. 65-186-10-1). Because it was a retrospective analysis, the present study did not require patients’ informed consent. However, the identity numbers of patients were encoded before analysis.
RESULTS
Characteristics of patients
The patients in the present study included 94 (34.3%) PCNSLs and 180 (65.7%) GBMs. In detail, 43.5% of corpus callosal tumors were GBM and 56.5 % were PCNSL, as shown in [Table 1]. Of those, 70.1% got pre-operative steroid injections and 67.9% of the group overall had central necrosis. For corpus callosal tumors, central necrosis was observed in 43.5% found in 85% (17/20) of GBMs and 11.5% (3/26) of PCNSLs.
| Factor | Corpus callosal tumor (n=46, %) | Non-corpus callosal tumor (n=228, %) | Total cohort (n=274, %) |
|---|---|---|---|
| Gender | |||
| Male | 21 (45.7) | 127 (55.7) | 148 (54) |
| Female | 25 (54.3) | 101 (44.3) | 126 (46) |
| Mean age-year (SD) | 53.6 (12.8) | 54.2 (14.3) | 54.1 (14.1) |
| Age group-year | |||
| <15 | 0 (0) | 3 (1.3) | 3 (1.1) |
| >30-60 | 32 (69.6) | 149 (65.4) | 181 (66.1) |
| >60 | 14 (30.4) | 76 (33.3) | 90 (32.8) |
| Number of tumor | |||
| Single | 23 (50.0) | 158 (69.3) | 181 (66.1) |
| Multiple | 23 (50.0) | 70 (30.7) | 93 (33.9) |
| Mean size of tumor-cm (SD) | 4.9 (1.6) | 4.7 (1.7) | 4.7 (1.7) |
| Main tumor location | |||
| Frontal lobe | 0 (0) | 71 (31.1) | 71 (25.9) |
| Temporal lobe | 0 (0) | 72 (31.6) | 72 (26.3) |
| Parietal lobe | 0 (0) | 37 (16.2) | 37 (13.5) |
| Occipital lobe | 0 (0) | 7 (3.1) | 7 (2.6) |
| Thalamus | 0 (0) | 8 (3.5) | 8 (2.9) |
| Basal ganglion | 0 (0) | 2 (0.9) | 2 (0.7) |
| Periventricular region | 0 (0) | 25 (11.0) | 25 (9.1) |
| Pineal region | 0 (0) | 2 (0.9) | 2 (0.7) |
| Cerebellum | 0 (0) | 1 (0.4) | 1 (0.4) |
| Brainstem | 0 (0) | 3 (1.3) | 3 (1.1) |
| Corpus callosum | 46 (100) | 0 (0) | 46 (16.8) |
| Lateralization | |||
| Left | 0 (0) | 103 (45.2) | 103 (37.6) |
| Right | 0 (0) | 93 (40.8) | 93 (33.9) |
| Midline | 46 (100) | 4 (1.8) | 50 (18.2) |
| Bilateral | 0 (0) | 28 (12.3) | 28 (10.2) |
| Central necrosis | 20 (43.5) | 166 (72.8) | 186 (67.9) |
| Midline shift-cm | |||
| <0.5 | 43 (93.5) | 124 (54.4) | 167 (60.9) |
| ≥0.5 | 3 (6.5) | 104 (45.6) | 107 (39.1) |
| Preoperative dexamethasone | 24 (52.2) | 168 (73.7) | 192 (70.1) |
| Operation | |||
| Biopsy | 41 (89.1) | 76 (33.3) | 117 (42.7) |
| Resection | 5 (10.9) | 152 (66.7) | 157 (57.3) |
| Diagnosis | |||
| PCNSL | 26 (56.5) | 68 (29.8) | 94 (34.3) |
| Glioblastoma | 20 (43.5) | 160 (70.2) | 180 (65.7) |
PCNSL: Primary central nervous system lymphoma, SD: Standard deviation
The total number of MRIs was 1000 images. Therefore, 228 MRIs of corpus callosal tumors were 50/50 split into the validated dataset, and the remaining included 772 MRIs of non-corpus callosal tumors as the pooled dataset. The pooled dataset was randomly split as follows: 709 images (80%) were in the training dataset, and 177 images (20%) were selected for the testing dataset.
DL model development and validation
Each model reached the plateau stage after 30 epochs of training. The first baseline model was trained without regularization/data augmentation and had a testing accuracy of 0.69, but the testing loss conversely rose away from the training loss, as shown in [Figure 2a]. The 2nd and 3rd models have trained with the L2 and drop-out regularization, respectively. As a result, the testing accuracy of the 2nd and 3rd models was 0.72 and 0.73, respectively. However, the testing loss of the 2nd model was reduced than the 3rd model when epochs proceeded, as shown in [Figure 2b and c]. Finally, data augmentation was performed for the training of the 4th model and the testing accuracy was 0.61, but the testing loss eventually converged to the training loss, as shown in [Figure 2d].
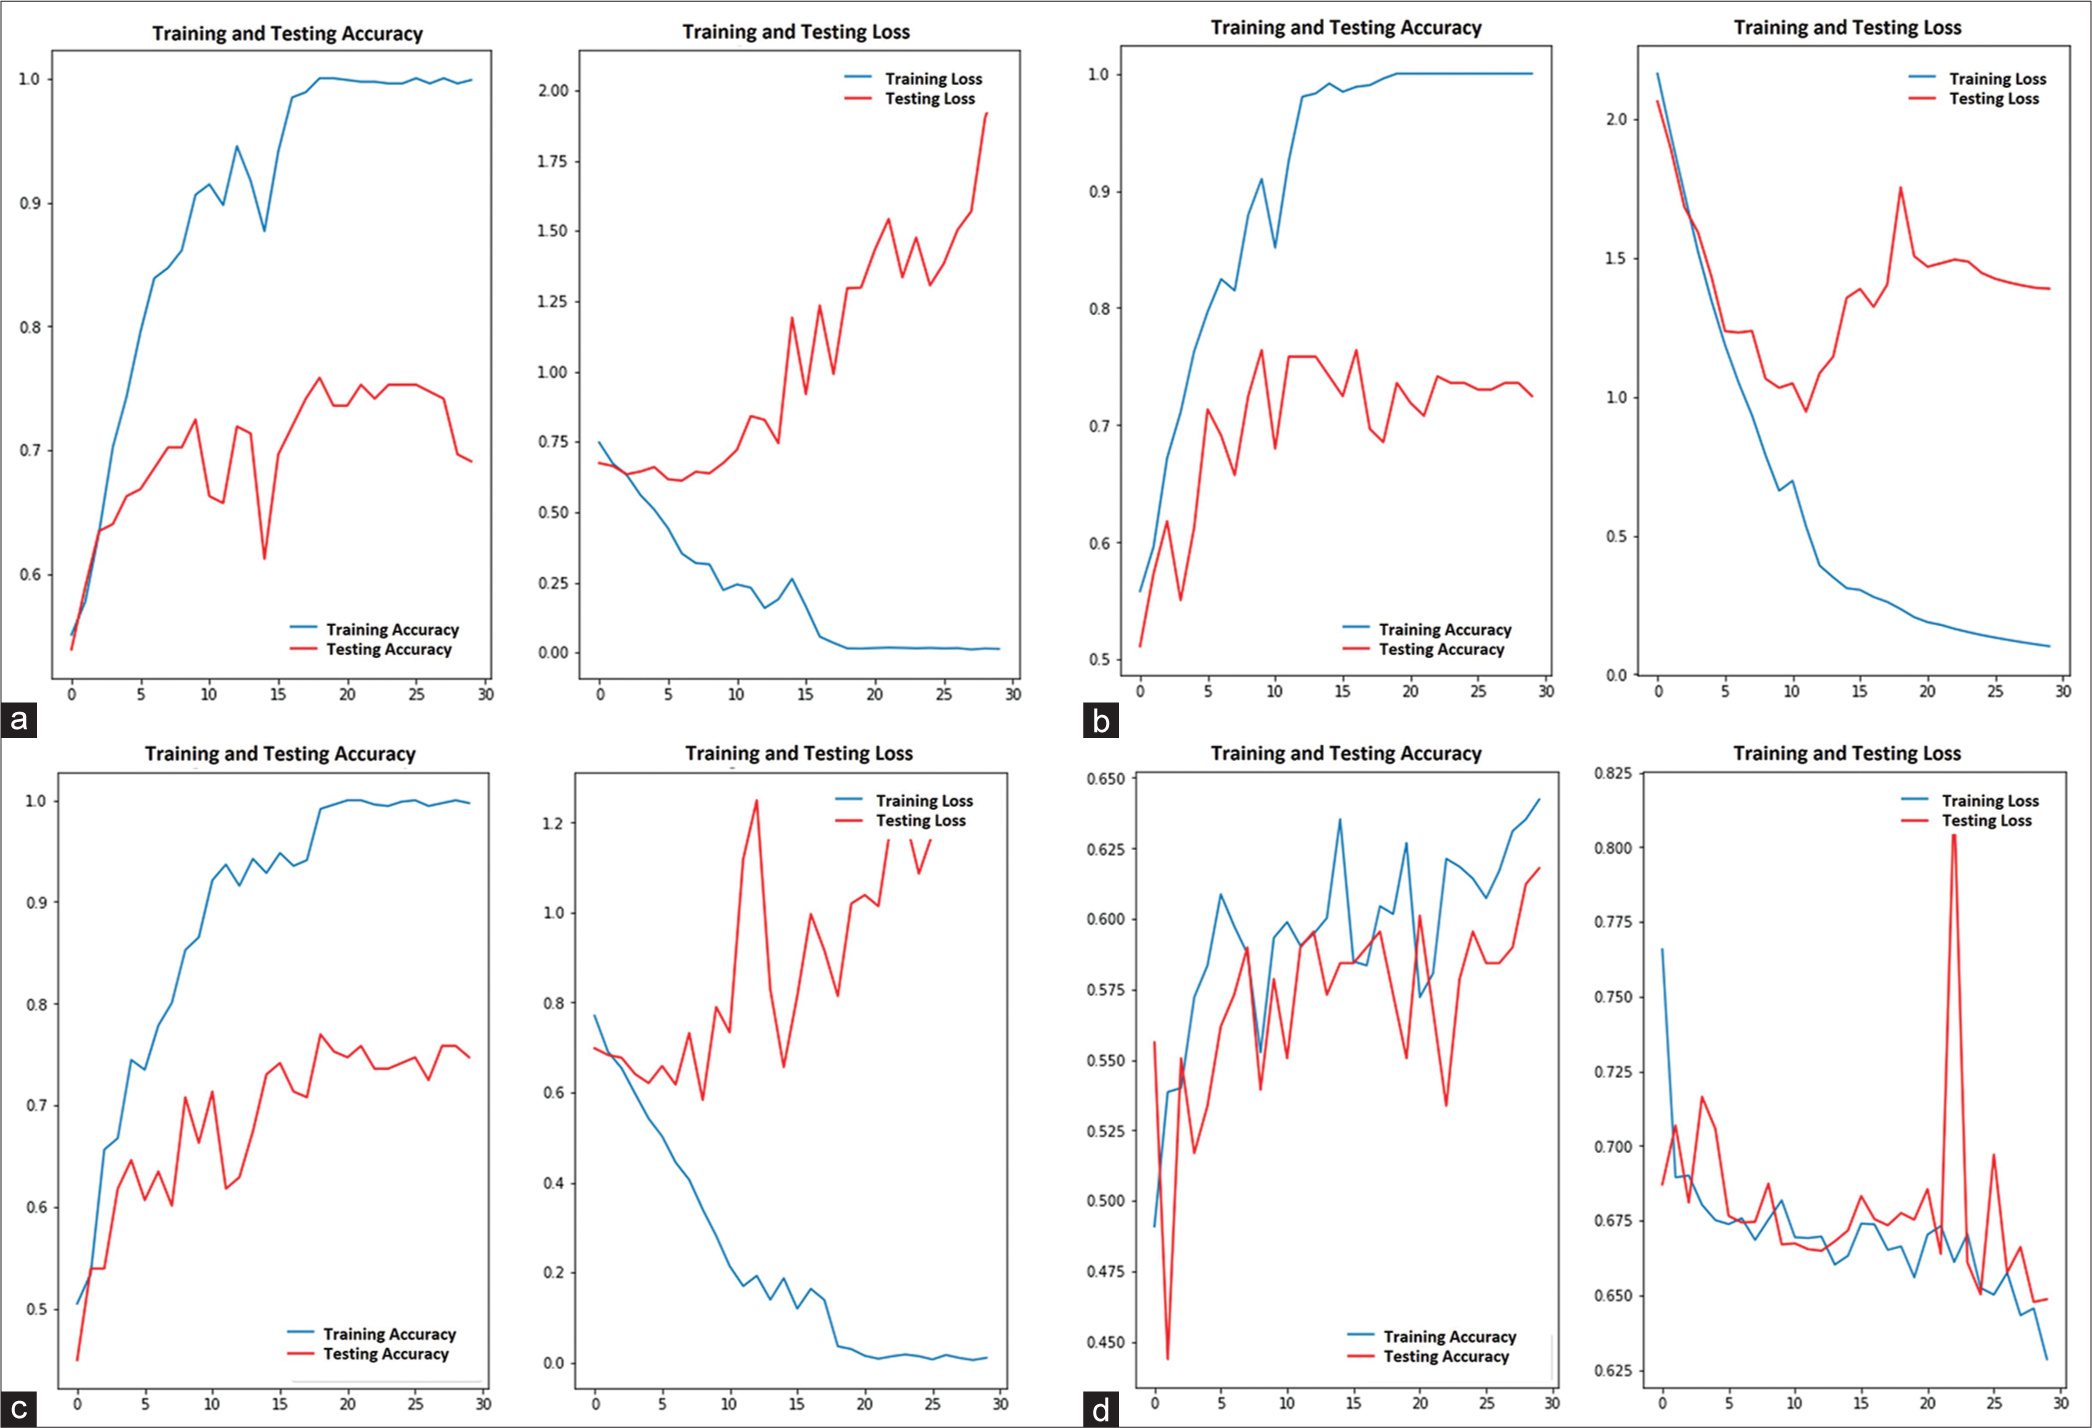
- Training and testing accuracy and loss. (a) 1st model, (b) 2nd model with L2 regularization, (c) 3rd model with drop-out regularization, and (d) 4th model with data augmentation.
As shown in [Table 2], the performance of all DL models for the diagnosis of PCNSL was evaluated using unviewed MRIs from the validation dataset. In terms of results, the 1st model had sensitivity, specificity, PPV, NPV, accuracy, and F1 score of 0.59, 0.94, 0.91, 0.70, 0.77, and 0.72, respectively. When the ridge regression and drop-out regularization were performed, the accuracy of the 2nd and 3rd models rose by 0.83 and 0.84, respectively. At 0.68, the validation accuracy of the 4th model was the lowest among the DL models. As shown in [Figure 3], the AUC of the 2nd and 3rd models had high levels of discrimination at 0.83 and 0.84, respectively, while the 1st model had acceptable discrimination with an AUC of 0.77.
| Model | Sensitivity (95%CI) | Specificity (95%CI) | PPV (95%CI) | NPV (95%CI) | Accuracy (95%CI) | F1 (95%CI) |
|---|---|---|---|---|---|---|
| 1st model | 0.59 (0.46–0.72) | 0.94 (0.88–1.00) | 0.91 (0.83–1.00) | 0.70 (0.59–0.80) | 0.77 (0.69–0.84) | 0.72 (0.59–0.85) |
| 2nd model | 0.82 (0.72–0.92) | 0.84 (0.74–0.93) | 0.83 (0.74–0.93) | 0.82 (0.73–0.92) | 0.83 (0.76–0.90) | 0.83 (0.73–0.93) |
| 3rd model | 0.75 (0.64–0.86) | 0.92 (0.86–0.99) | 0.91 (0.83–0.99) | 0.79 (0.69–0.88) | 0.84 (0.77–0.90) | 0.82 (0.71–0.93) |
| 4th model | 0.75 (0.64–0.86) | 0.61 (0.48–0.74) | 0.66 (0.54–0.77) | 0.71 (0.58–0.84) | 0.68 (0.59–0.76) | 0.70 (0.59–0.81) |
CI: Confidence interval, PPV: Positive predictive value, NPV: Negative predictive value
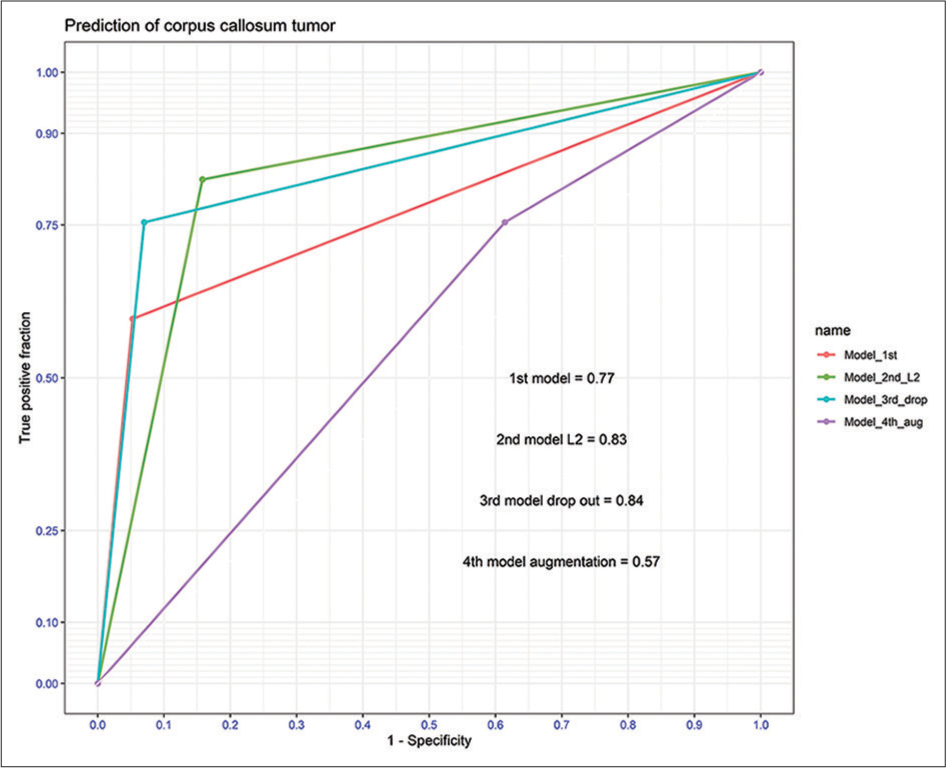
- The area under the receiver operating characteristic curve among models.
DL-based web application for deployment
The 2nd model showed a high level of diagnostic performance. As a result, a web application was constructed and launched. The tool is simple to use by scanning a quick response code or acquiring the uniform resource locator. New MRI images will be imported through computers or cell phones. The output is predicted as a diagnosis through the web application, as shown in [Figure 4].
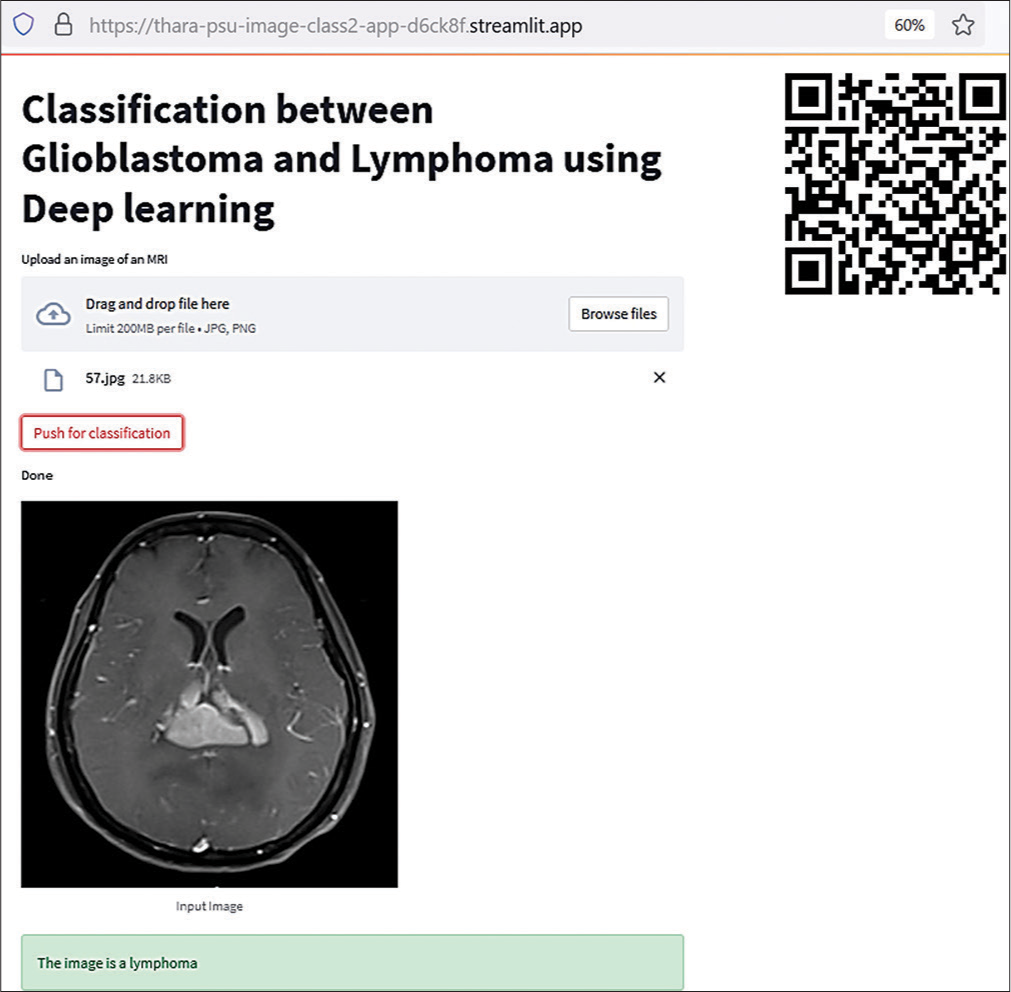
- Web application by the 2nd model.
DISCUSSION
In the present study, we demonstrated the possibility of using a DL model to distinguish PCNSLs from GBMs. Several methods for classifying these two cancers have been investigated, such as advanced MRIs, ML, and DL. Horger et al. compared apparent diffusion coefficient maps between these malignancies for differentiation and reported that sensitivity and specificity were 73–84% and 89–100%, respectively.[18] Furthermore, the classification of PCNSLs and GBMs was predicted using a support vector machine (SVM) and multilayer perceptron of supervised ML, with a maximum accuracy of 69.2%. Nguyen et al. conducted a systematic review and meta-analysis of ML studies for image classification of PCNSL from GBM. They found that the reported AUC of the ML models in diagnosing PCNSL ranged from 0.878 to 0.979, and SVM was the most common algorithm used to perform image classification.[19] However, these methods require the expertise of specialists for classification, which may cause excess workload, whereas the DL method includes image feature extraction and model development in the architecture. This approach is an alternative approach for use as a screening tool to assist clinicians in situations where specialists may be limited.
The baseline DL model without regularization has discrimination at an acceptable level. However, diagnostic performance could be enhanced by regularization with the same training dataset. L2 and drop-out regularizations improved the AUCs of models to high discrimination, while the performance of data augmentation was unacceptable in the validation process. Smirnov et al.[20] demonstrated that dropout regularization could reduce the error rates using both testing and validated datasets for image classification, while Majanga and Viriri used dropout regularization for image segmentation of dental images and reported that the model with the dropout technique improved the accuracy of 91.3%; the model without dropout had an accuracy of 89.0%.[21] From prior studies, data augmentation was performed to improve and help build a more reliable image classification problem using DL.[22] Jacaruso. demonstrated data augmentation techniques in an electrocardiogram which improved performance from the accuracy of the baseline model from 82% to 88–90%.[23]
The DL model with L2 regularization in the present study exhibited high sensitivity, making it a predictive model for use as a screening tool in clinical practice. Pewsner et al. proposed that a high-sensitivity tool is reliable when its prediction is negative because it rarely misdiagnoses people who have the condition.[24] When the screening tool is combined with telemedicine and teleconsultant technologies, this strategy will provide significant benefits for patients in terms of effective treatment and management as well as reduced clinician workload. In a prior study, Wong and Tsai. used DL technologies with a telehealth strategy for screening and monitoring glaucoma patients.[25]
Although the DL models in the present study had acceptable to high performance, there are some limitations that should be acknowledged. T1-Gd MRIs were used for model development in the present study; therefore, various sequences of MRIs would enhance the diagnostic performance in the future study. Moreover, we need additional images to enhance the model’s ability to differentiate PCNSL from GBM. According to experts, a good rule of thumb for image classification using DL is 1,000 images/class, with a large amount of training data.[26] Multi-center studies will address the issue and provide more images of the specific tumor location for training the DL model.
CONCLUSION
DL with regularization has the potential to provide clinicians with reliable diagnostic performance in distinguishing PCNSL from GBM.
Declaration of patient consent
Patient’s consent not required as patients identity is not disclosed or compromised.
Conflicts of interest
There are no conflicts of interest.
Financial support and sponsorship
Nil.
References
- CBTRUS statistical report: Primary brain and other central nervous system tumors diagnosed in the United States in 2013-2017. Neuro Oncol. 2020;22:iv1-iv96.
- [CrossRef] [PubMed] [Google Scholar]
- CBTRUS statistical report: Primary brain and other central nervous system tumors diagnosed in the United States in 2012-2016. Neuro Oncol. 2019;21:v1-100.
- [CrossRef] [PubMed] [Google Scholar]
- The prognostic value of IDH mutations and MGMT promoter status in secondary high-grade gliomas. J Neurooncol. 2012;110:325-33.
- [CrossRef] [PubMed] [Google Scholar]
- Outcome and prognostic factors of primary central nervous system lymphoma in Southern Thailand. Asian J Neurosurg. 2020;15:560-5.
- [CrossRef] [PubMed] [Google Scholar]
- Diagnostic yield and complication of frameless stereotactic brain biopsy. J Neurosci Rural Pract. 2019;10:78-84.
- [CrossRef] [PubMed] [Google Scholar]
- Butterfly tumor of the corpus callosum: Clinical characteristics, diagnosis, and survival analysis. J Neurosci Rural Pract. 2017;8:S57-65.
- [CrossRef] [PubMed] [Google Scholar]
- Glucocorticoid receptor-like antigen in lymphoma cell membranes: Correlation to cell lysis. Science. 1987;236:456-61.
- [CrossRef] [PubMed] [Google Scholar]
- Differentiating glioblastoma multiform from cerebral lymphoma: Application of advanced texture analysis of quantitative apparent diffusion coefficients. Neuroradiol J. 2020;33:428-36.
- [CrossRef] [PubMed] [Google Scholar]
- Can morphological MRI differentiate between primary central nervous system lymphoma and glioblastoma? Cancer Imaging. 2016;16:40.
- [CrossRef] [PubMed] [Google Scholar]
- Machine learning for semi-automated classification of glioblastoma, brain metastasis and central nervous system lymphoma using magnetic resonance advanced imaging. Ann Transl Med. 2019;7:232.
- [CrossRef] [PubMed] [Google Scholar]
- Deep learning-based image recognition for autonomous driving. IATSS Res. 2019;4:244-52.
- [CrossRef] [Google Scholar]
- Classification of glioblastoma versus primary central nervous system lymphoma using convolutional neural networks. Sci Rep. 2021;11:15219.
- [CrossRef] [PubMed] [Google Scholar]
- A deep learning model for preoperative differentiation of glioblastoma, brain metastasis and primary central nervous system lymphoma: A pilot study. Front Oncol. 2022;12:816638.
- [CrossRef] [PubMed] [Google Scholar]
- Deep learning with data enhancement for the differentiation of solitary and multiple cerebral glioblastoma, lymphoma, and tumefactive demyelinating lesion. Front Oncol. 2021;11:665891.
- [CrossRef] [PubMed] [Google Scholar]
- Deep learning for automatic differential diagnosis of primary central nervous system lymphoma and glioblastoma: Multi-parametric magnetic resonance imaging based convolutional neural network model. J Magn Reson Imaging. 2021;54:880-7.
- [CrossRef] [PubMed] [Google Scholar]
- Temozolomide for patients with wild-type isocitrate dehydrogenase (IDH) 1 glioblastoma using propensity score matching. Clin Neurol Neurosurg. 2020;191:105712.
- [CrossRef] [PubMed] [Google Scholar]
- Comparison of intracranial injury predictability between machine learning algorithms and the nomogram in pediatric traumatic brain injury. Neurosurg Focus. 2021;51:E7.
- [CrossRef] [PubMed] [Google Scholar]
- Water diffusivity: Comparison of primary CNS lymphoma and astrocytic tumor infiltrating the corpus callosum. AJR Am J Roentgenol. 2009;193:1384-7.
- [CrossRef] [PubMed] [Google Scholar]
- Machine learning applications for the differentiation of primary central nervous system lymphoma from glioblastoma on imaging: A systematic review and meta-analysis. Neurosurg Focus. 2018;45:E5.
- [CrossRef] [PubMed] [Google Scholar]
- Comparison of regularization methods for ImageNet classification with deep convolutional neural networks. AASRI Proc. 2014;6:89-99.
- [CrossRef] [Google Scholar]
- Dropout regularization for automatic segmented dental images In: Hong TP, Wojtkiewicz K, Chawuthai R, Sitek P, eds. Recent Challenges in Intelligent Information and Database Systems. Singapore: Springer; 2021. p. :254-65.
- [CrossRef] [Google Scholar]
- Improve image classification using data augmentation and neural networks neural networks. SMU Data Sci Rev. 2019;2:1-43.
- [Google Scholar]
- Accuracy improvement for Fully Convolutional Networks via selective augmentation with applications to electrocardiogram data. Inform Med Unlocked. 2021;26:100729.
- [CrossRef] [Google Scholar]
- Ruling a diagnosis in or out with “SpPIn” and “SnNOut”: A note of caution. BMJ. 2004;329:209-13.
- [CrossRef] [PubMed] [Google Scholar]
- Telehealth and screening strategies in the diagnosis and management of glaucoma. J Clin Med. 2021;10:3452.
- [CrossRef] [PubMed] [Google Scholar]
- How Do You Know You Have Enough Training Data? 2019. Available from: https://towardsdatascience.com/howdo-you-know-you-have-enough-training-data-ad9b1fd679ee [Last accessed on 2021 Jul 05]
- [Google Scholar]


