
Translate this page into:
Computed Tomography Evaluation of Brain in Chronic Alcoholics
Gurpreet Singh Sandhu, MD Sector 12, Postgraduate Institute of Medical Education and Research (PGIMER), Chandigarh India gurpreetsandhu1529@gmail.com
This article was originally published by Thieme Medical and Scientific Publishers Private Ltd. and was migrated to Scientific Scholar after the change of Publisher.
Abstract
Abstract
Background Chronic alcoholism causes brain damage. Published data from rural India is scant. Our aim is to determine computed tomography (CT) changes in the brain of rural chronic alcoholics.
Methods This prospective cross-sectional study was done in our tertiary care hospital on chronic alcoholic patients referred from deaddiction center over a period of 2 years. Age- and sex-matched nonalcoholic controls were included and Student’s t-test and chi-square test comparison was done. Correlation coefficient was obtained by Pearson’s correlation coefficient. Patients and the controls were studied in two age groups: 30 to 45 and 46 to 60 years. Noncontrast CT scan of head was done in each case and CT indices of brain damage were measured.
Results The study included 106 alcoholics out of which 55 were in the younger age group (30–45 years) and 51 in the older age group (46–60 years). Seven hundred age-matched, nonalcoholic controls were included. Mean values of ethanol were higher in the older age group than in the younger age group. As compared with controls, various CT scan indices of ventricular changes, cortical changes, and subcortical changes were significantly higher in both age groups. In both age groups, there was a significant decrease in the mean values of hemoglobin and a significant increase in the mean values of indices of brain damage with increase in the grade of alcoholism.
Conclusion The results of this prospective epidemiological study showed marked alterations in all CT indices of brain atrophy and were correlated to the duration and amount of ethanol consumption. This study highlights that chronic alcoholism is a significant risk factor for brain atrophy.
Keywords
alcoholism
epidemiological
cortical atrophy
cerebellar atrophy
ventricular index
dilation
computed tomography scan
brain

Introduction
Chronic alcoholism is a pathologic condition due to excessive and habitual intake of alcohol.1 Alcoholism can affect and damage the brain in several ways and this depends on various factors such as age, sex, history of intake, diet, and vulnerability of specific brain regions.2 Multiple methods have been used to study the etiopathogenesis of alcohol-induced brain injury in different subgroups. Behavioral neuroscience techniques provide insight into specific cognitive and emotional functions. In addition, postmortem brain biopsies have been used to study the extent of pathology and neurotransmitter abnormalities. Neuroimaging techniques help delineate the areas of the brain with structural damage.2
Chronic alcoholism has major alcohol-related effects resulting in various degenerative changes in the brain including cerebral atrophy, dilatations of ventricles, and cerebellar atrophy.3 4
Published data on brain changes in alcoholics from rural India is scant. Therefore, this study was done with the aim to study computed tomography (CT) changes in brain in chronic alcoholics in rural Indian patients and to correlate these changes with the grade of alcoholism and age of patients and to compare these changes with age- and sex-matched nonalcoholics.
Materials and Methods
This hospital-based cross-sectional prospective study was conducted in the department of radiodiagnosis of our tertiary care teaching institute, a referral center for the rural population from January 1, 2012, to January 1, 2014. Most of the patients were referred from the deaddiction clinic. The study was cleared by the institutional ethic committee on human research.
Chronic alcoholics in the age group of 30 to 60 years referred to the radiology department were included in the study. Alcoholism was defined using the International Classification of Diseases, 10th revision criteria for the alcohol dependence syndrome.5 Diagnosed cases of systemic medical illness such as hypertension or diabetes mellitus, history of any other drug abuse, history of head injury, intellectually disabled patients, and patients of cerebrovascular, infective, degenerative disease, and tumors of brain were not included in the study. Cirrhosis of liver was excluded by absence of stigmata of cirrhosis, abdominal examination, and by ultrasonography of abdomen in each patient.
For comparison, 350 age- and sex-matched nonalcoholics were included as controls in each age group. Controls were nonalcoholic patients presenting with headache or dizziness, with no history of systemic illness, drug intake, and trauma and had normal CT scan. Controls were used to compare changes with brain of alcoholics over and above the normal age-related changes. The patients and controls were grouped into two age groups: 30 to 45 and 46 to 60 years.
After taking an informed written consent in each case, history of duration of alcohol, amount, type of alcohol intake, and symptoms were recorded in a pro forma. CT of the patient was performed on a Philips MDCT machine (16 slice).
Nonenhanced head CT scan was done in each case, from base of head to vertex in supine position, arms by side of the body, scanogram length of 256 mm, plane of imaging: 15 degrees cephalic tilt to inferior orbital meatal line and parallel to skull base to reduce the radiation dose to the orbits. The kV used was 140 kV with mA ~120 mA, field of view was 250 mm, and time of scanning was ~3 minutes.
CT scan was used to assess the ventricular size, cerebral and cerebellar changes, and signs of atrophy using different indices including bicaudate index, ventricular index, and Evanʼs index, and maximum transverse diameter of third ventricle.
Bifrontal index: Maximum width of the anterior horns of the lateral ventricles in relation to the inner skull width at the same level.
Bicaudate index: Minimum width of the lateral ventricles in relation to the inner skull at the same level.
Evanʼs index: Maximum width of the anterior horns of the lateral ventricles in relation to maximum width of inner skull diameter.
Ventricular index: Minimum width of lateral ventricle in relation to maximum width of anterior horns of lateral ventricle.
Cortical atrophy: Sum of the width of the four widest sulci at the two highest scanning levels/maximum inner skull diameter.
The patients’ brain CT scan findings and the hemoglobin values correlated with the grade of alcoholics.
Various amount and types of alcohol have been converted into standard ethanol consumption in grams using conversion factor5:
1 mL of ethanol = 0.79 g of pure ethanol. For example, 40 mL of whisky (40%) × 0.79 (conversion factor) = 12.6 g of ethanol.
40 mL of whisky (42.8%) × 0.79 (conversion factor) = 13.5 g of ethanol.
40 mL of country liquor (40%) × 0.79 (conversion factor) = 12.6 g of ethanol.
40 mL of illicit liquor (56%) × 0.79 (conversion factor) = 17.6 g of ethanol.
Statistical Analysis
Results were expressed as mean ± standard deviation for continuous variables and percentages for categorical data. Various indices values were calculated for alcoholics in age group of 30 to 45 and 46 to 60 years separately, and these were compared with age-matched controls using Student’s t-test and chi-square test. Correlation coefficient was obtained by Pearson’s correlation coefficient.
Multiple stepwise analysis were performed to determine correlation between ethanol intake and various factors effecting cerebral and cerebellar atrophies, with measurements adjusted for age. The p-value of < 0.05 was considered as significant.
Results
The study included 55 alcoholics in the age group of 30 to 45 years (younger age group) and 51 alcoholics in the age group of 46 to 60 years (older age group). Seven hundred age-matched nonalcoholic controls, 350 in each age group, were included to compare the results. The mean age of alcoholics and controls were 43 ± 9 and 43 ± 8 years, respectively. The most common type of alcohol was country liquor in the younger group and whisky in the older group. The mean values of ethanol intake were higher in older age group than younger age group. Maximum number (67.3%) of younger patients was from short duration of alcohol intake of 2 to 5 years. Maximum number (39.2%) of older group alcoholics was 11 to 15 years of alcohol intake (Table 1).
|
Variable |
30–45 years N (%) |
46–60 years N (%) |
|---|---|---|
|
Abbreviations: CNS, central nervous system; GIT, gastrointestinal; SD, standard deviation. |
||
|
Group of cases |
||
|
Patients |
55 (51.9) |
51 (48.1) |
|
Controls |
350 (50) |
350 (50) |
|
Symptomatology |
||
|
CNS |
32 (58.2) |
36 (70.6) |
|
GIT |
23 (41.8) |
15 (29.4) |
|
Grade of alcoholics |
||
|
Mild |
32 (58.2) |
10 (19.6) |
|
Moderate |
14 (25.5) |
16 (31.4) |
|
Heavy |
09 (16.4) |
25 (49.0) |
|
Type of alcohol |
||
|
Whisky |
18 (32.7) |
21 (41.2) |
|
Illicit |
14 (25.5) |
13 (25.5) |
|
Country |
23 (41.8) |
17 (33.3) |
|
Amount of alcohol (g) |
||
|
58–75 |
32 (58.2) |
24 (47.1) |
|
7–100 |
10 (18.2) |
08 (15.7) |
|
101–125 |
06 (10.9) |
08 (15.7) |
|
126–150 |
03 (5.5) |
05 (9.8) |
|
>150 |
04 (7.3) |
06 (11.8) |
|
Duration of alcohol (y) |
||
|
2–5 |
37 (67.3) |
11 (21.6) |
|
6–10 |
16 (29.1) |
12 (23.5) |
|
11–15 |
01 (1.8) |
20 (39.2) |
|
16–20 |
01 (1.8) |
07 (13.7) |
|
>20 |
0 (0) |
01 (2.0) |
|
Hemoglobin (g/dL) |
||
|
8–10 |
1 (1.8) |
6 (11.8) |
|
10–12 |
23 (41.8) |
34 (66.7) |
|
12–14 |
31 (56.4) |
11 (21.5) |
|
Cases: mean ± SD |
12.47 ± 0.93 |
11.47± 1.11 |
|
Controls: mean ± SD |
13.36 ± 0.62 |
13.00 ± 0.78 |
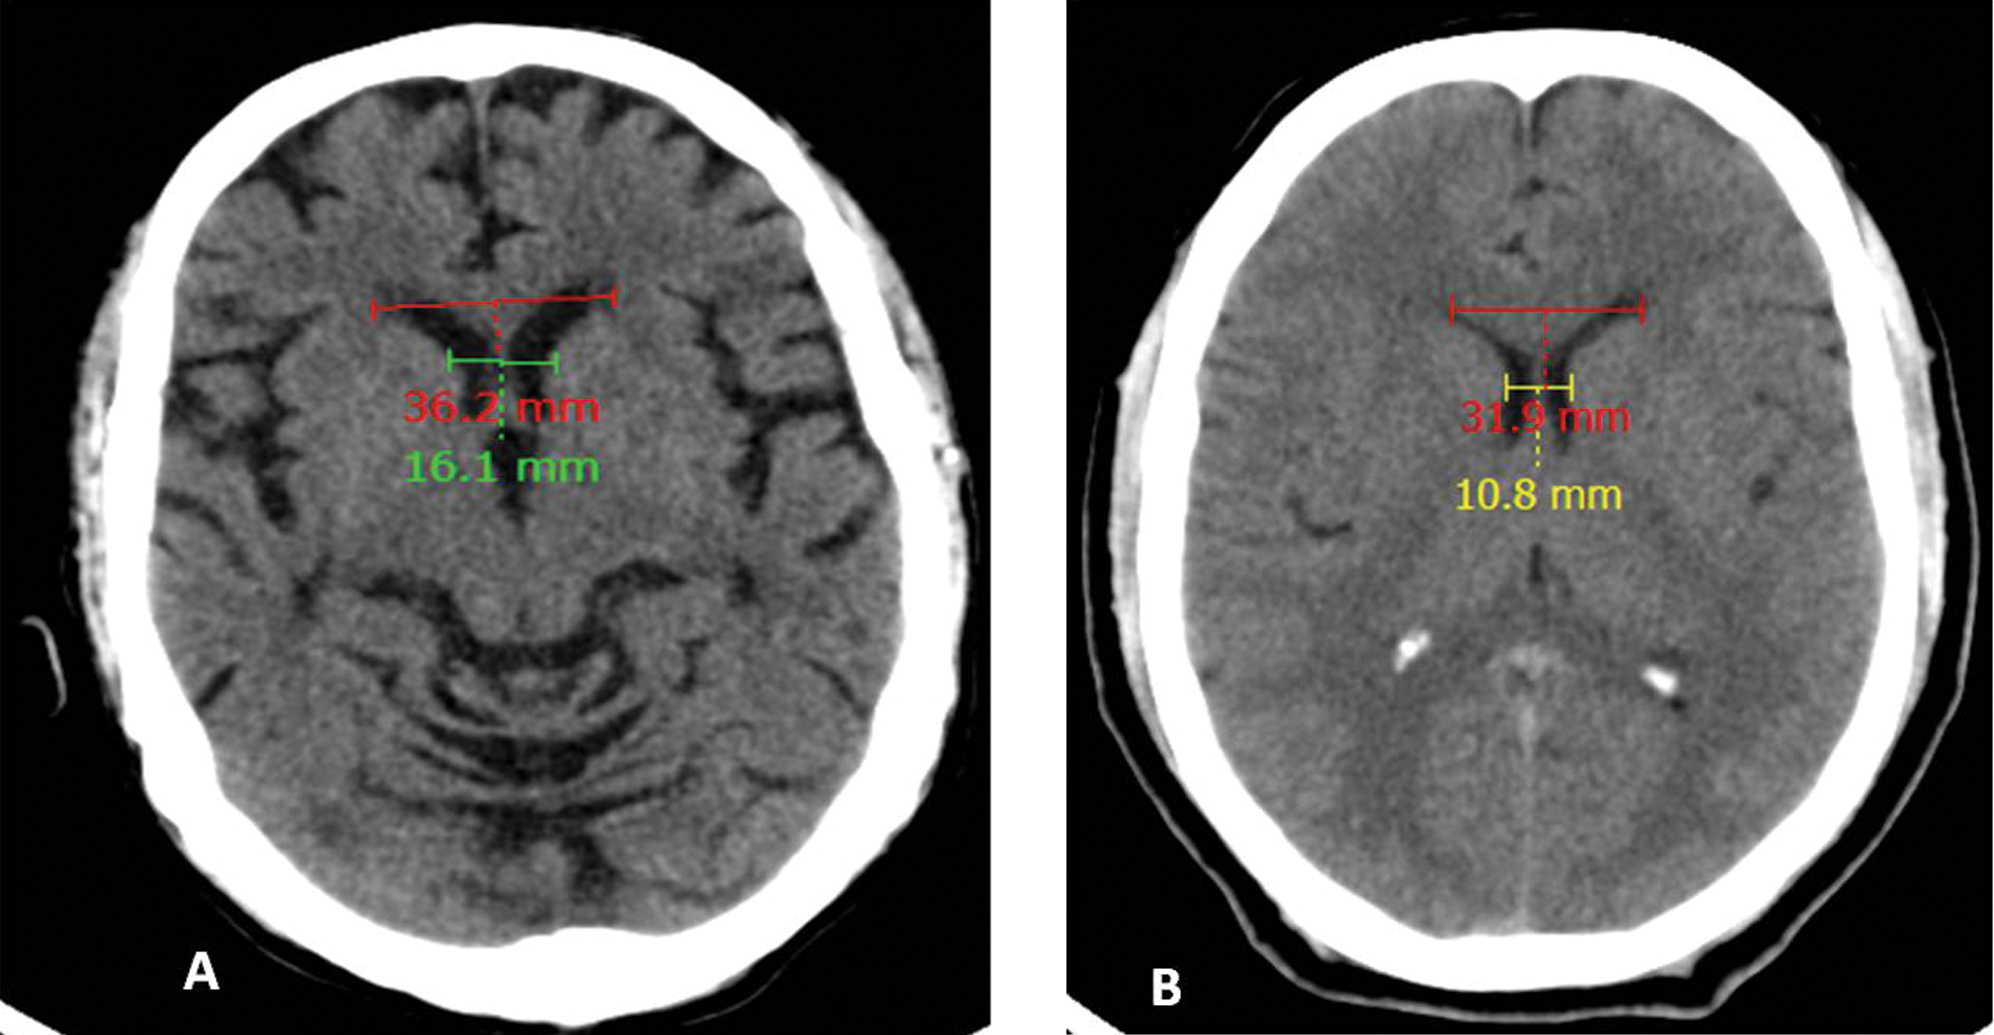
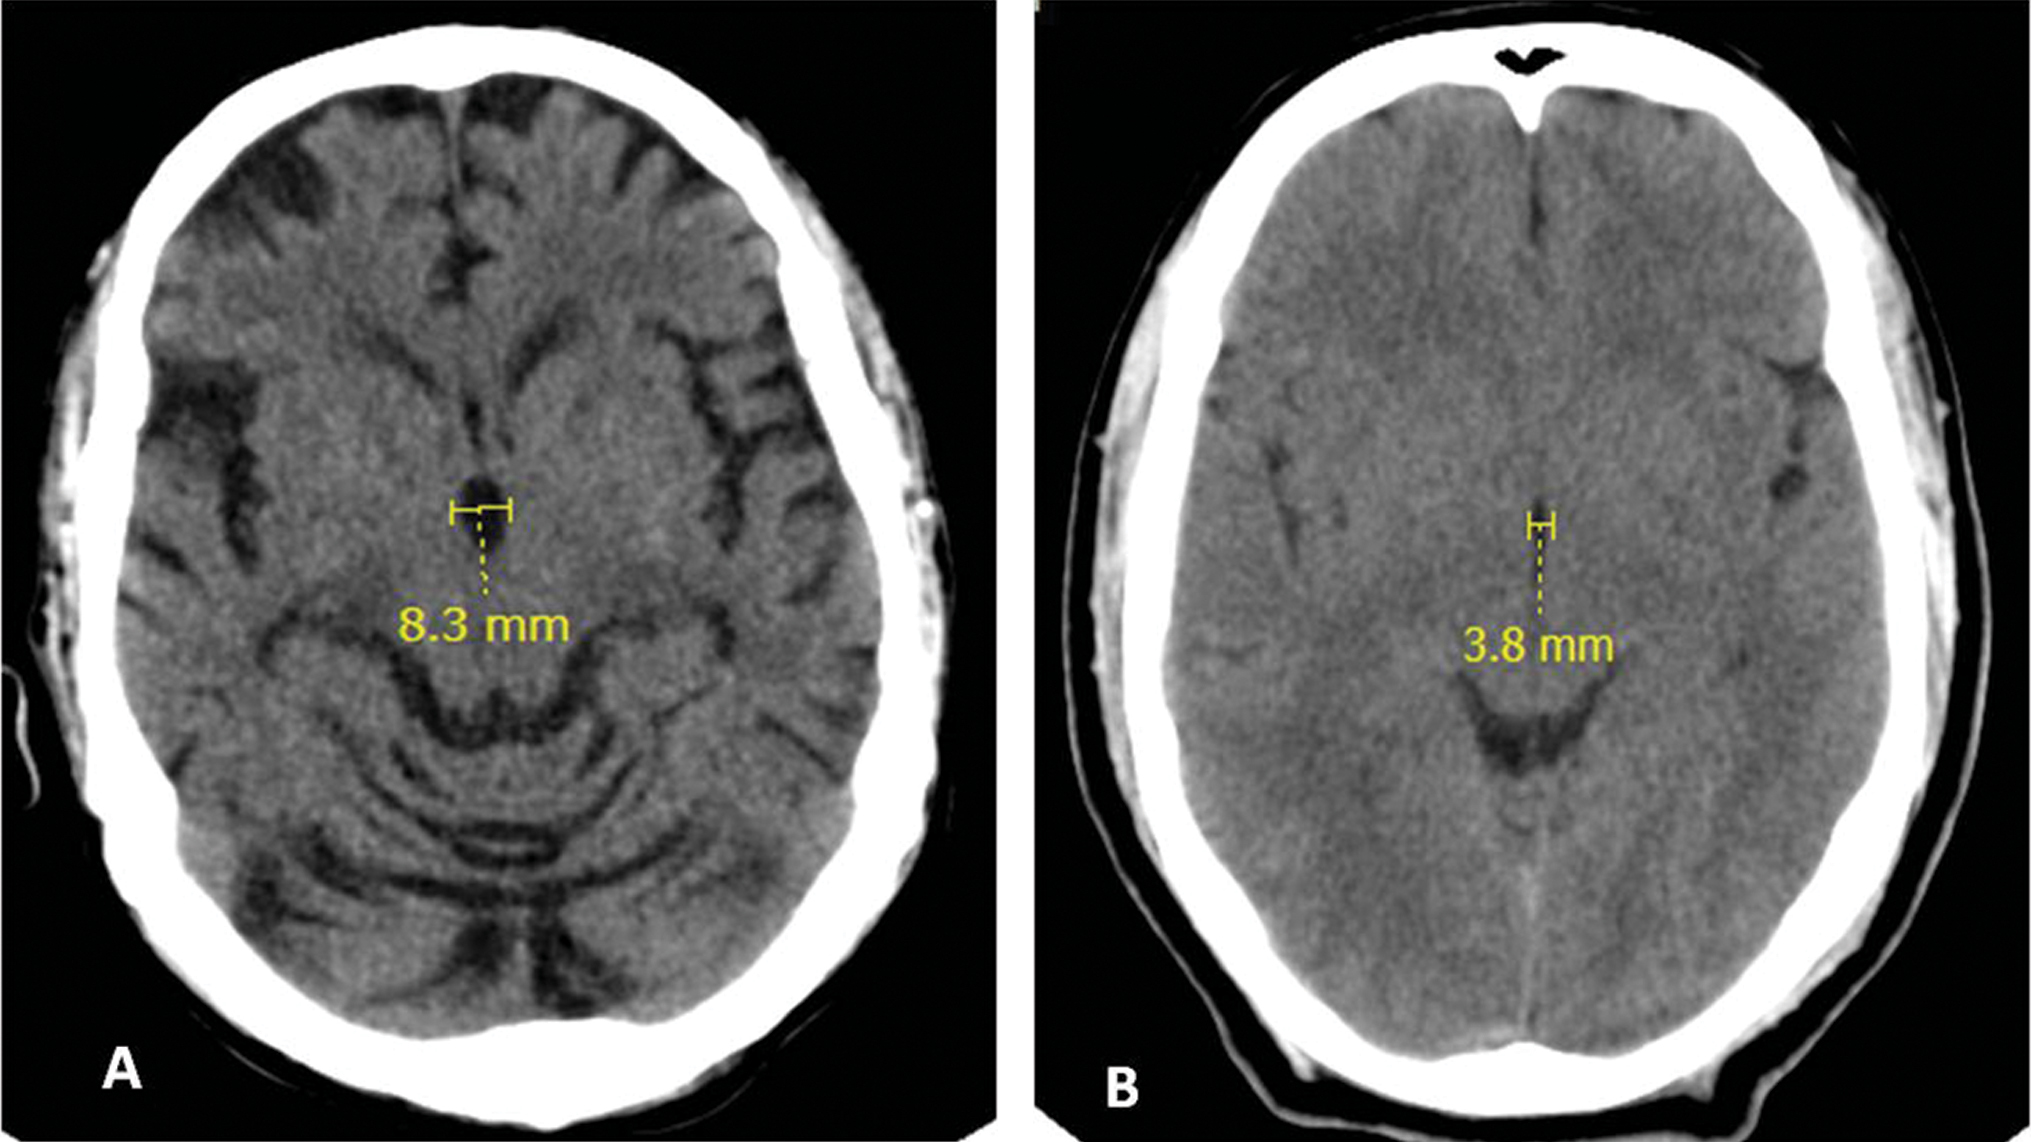
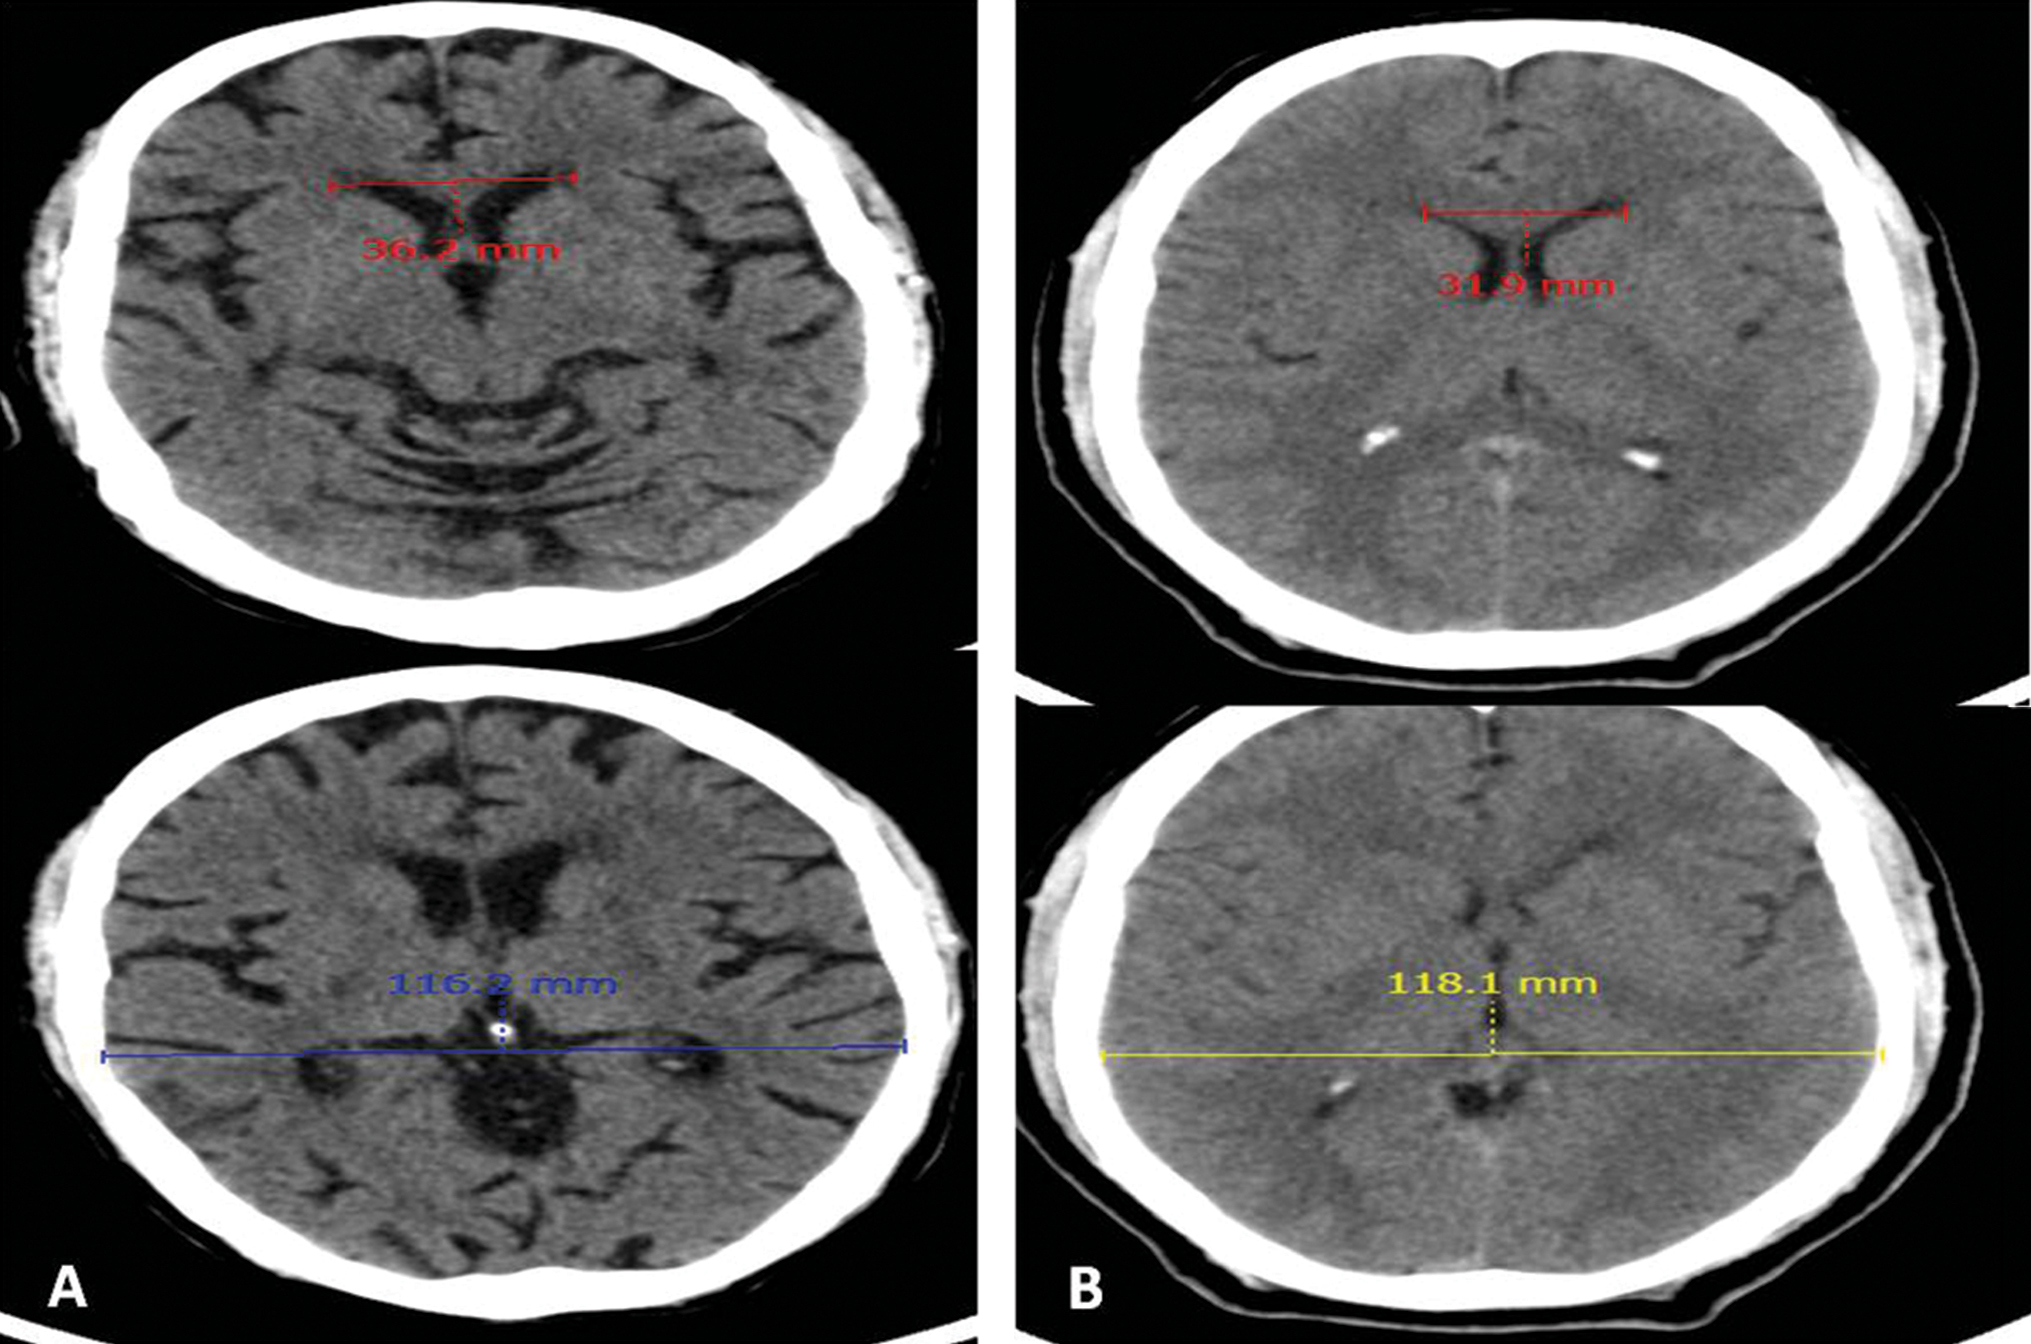
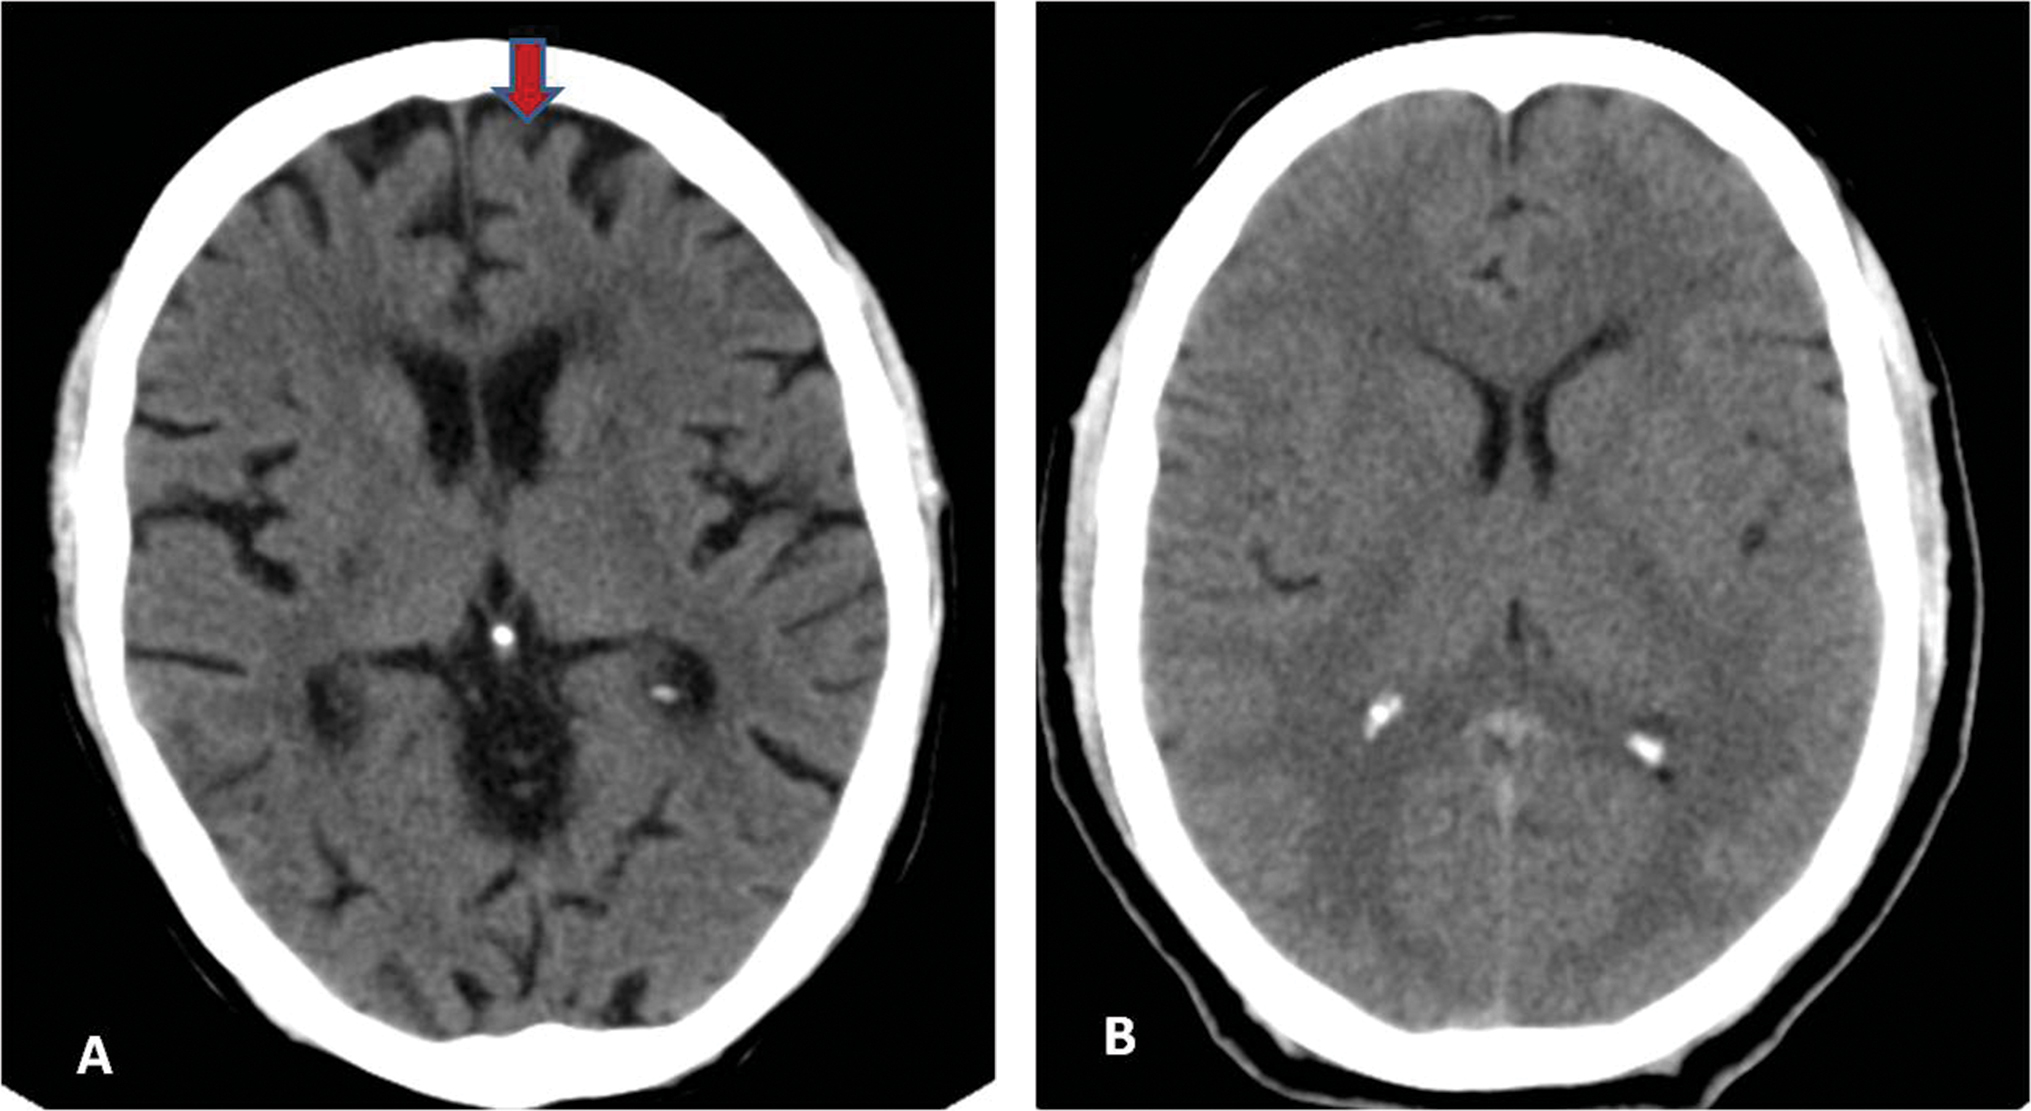
Various CT scan parameters for ventricular changes (bicaudate index Fig. 1A B, ventricular index Fig. 2A B, maximum transverse diameter of third ventricle ≥ 6 mm Fig. 3A B, and Evan’s index Fig. 4A B), cortical changes (frontal lobe atrophy Fig. 5A B and cortical atrophy Fig. 6A B), and subcortical changes (cerebellar vermian atrophy Fig. 7A B) were significantly higher in both age groups of patients as compared with controls (Table 2).

-
Fig. 1 (A) Case and (B) control: Bicaudate index—minimum width of lateral ventricles/inner skull diameter at that level) values 0.16 and 0.10, respectively.
Fig. 1 (A) Case and (B) control: Bicaudate index—minimum width of lateral ventricles/inner skull diameter at that level) values 0.16 and 0.10, respectively.
-
Fig. 2 (A) Case and (B) control: Ventricular index—minimum width of lateral ventricle/maximum width of anterior horns of lateral ventricle) values 0.44 and 0.34, respectively.
Fig. 2 (A) Case and (B) control: Ventricular index—minimum width of lateral ventricle/maximum width of anterior horns of lateral ventricle) values 0.44 and 0.34, respectively.
-
Fig. 3 (A) Case and (B) control: Maximum transverse diameter third ventricle values 8.3 and 3.8 mm, respectively.
Fig. 3 (A) Case and (B) control: Maximum transverse diameter third ventricle values 8.3 and 3.8 mm, respectively.
-
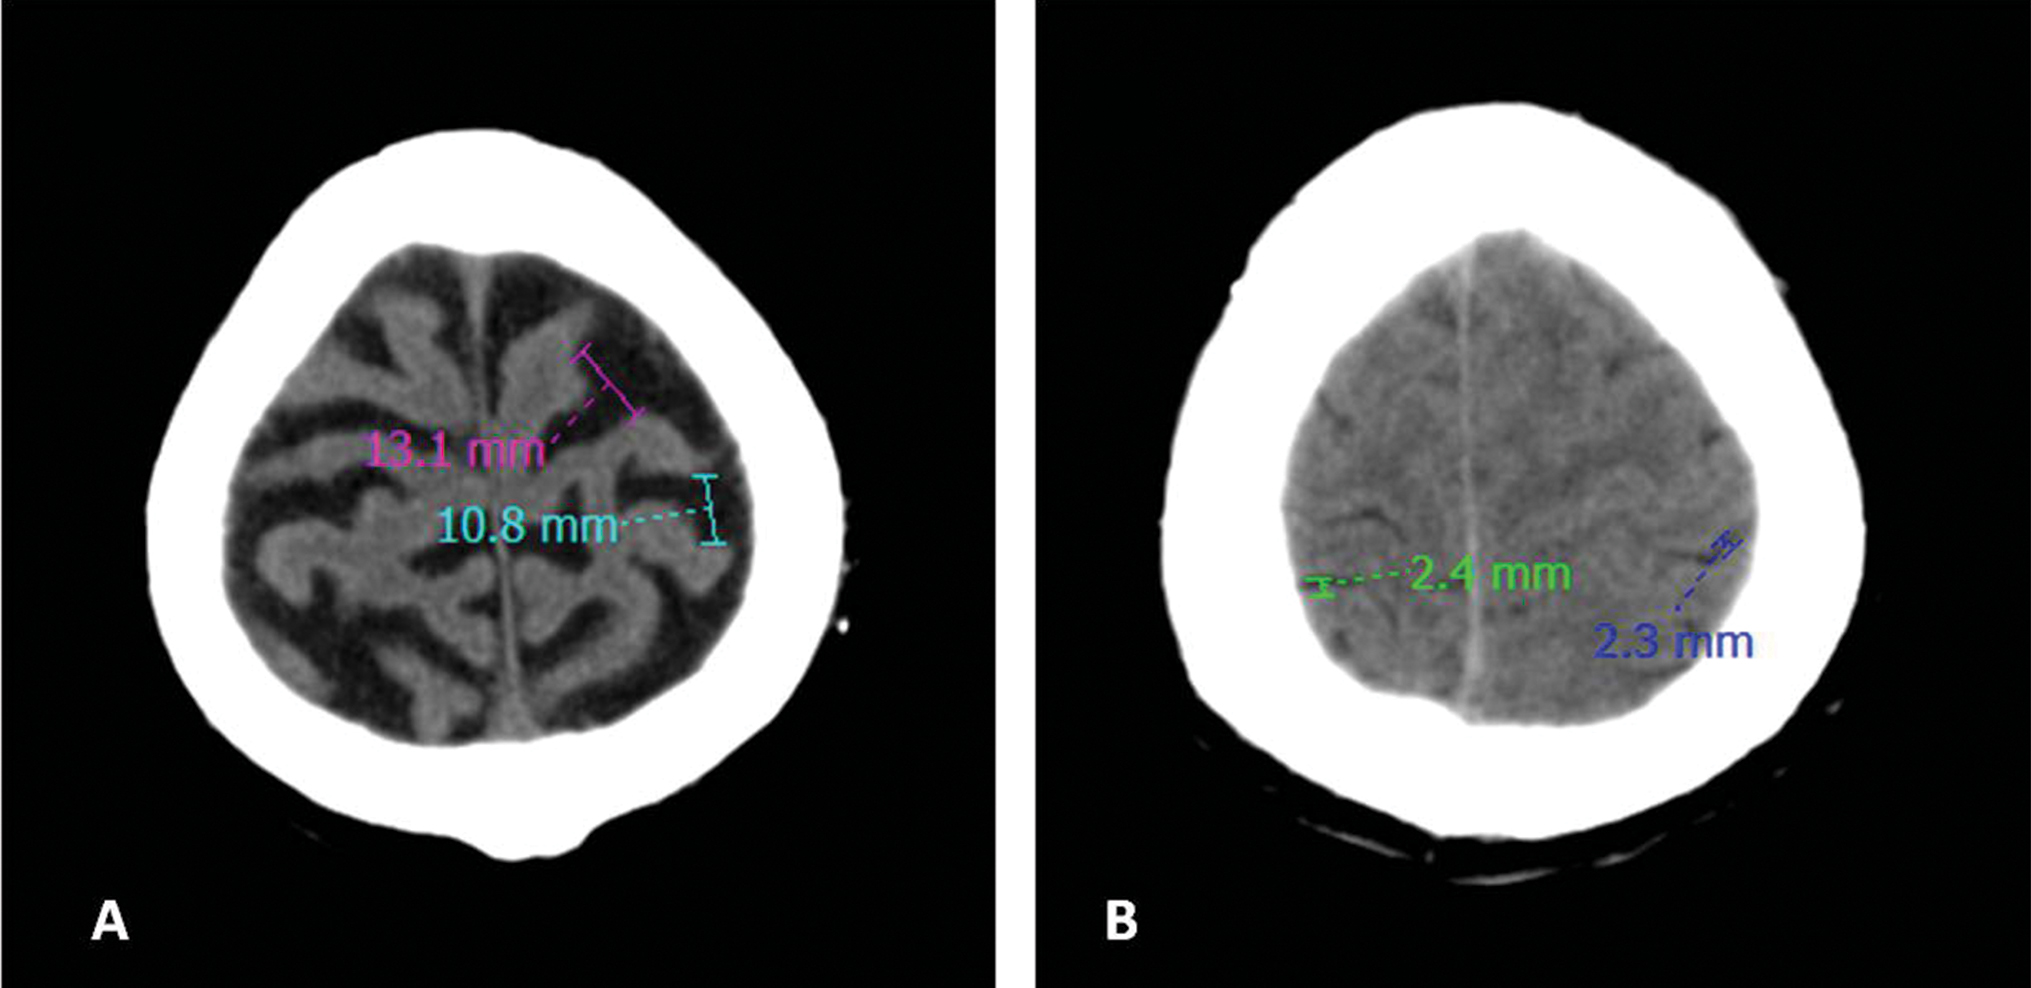
Fig. 4 (A) Case and (B) control: Evan’s index—maximum width of anterior horns of lateral ventricle/maximum inner skull diameter values 0.31 and 0.27, respectively.
Fig. 4 (A) Case and (B) control: Evan’s index—maximum width of anterior horns of lateral ventricle/maximum inner skull diameter values 0.31 and 0.27, respectively.
-
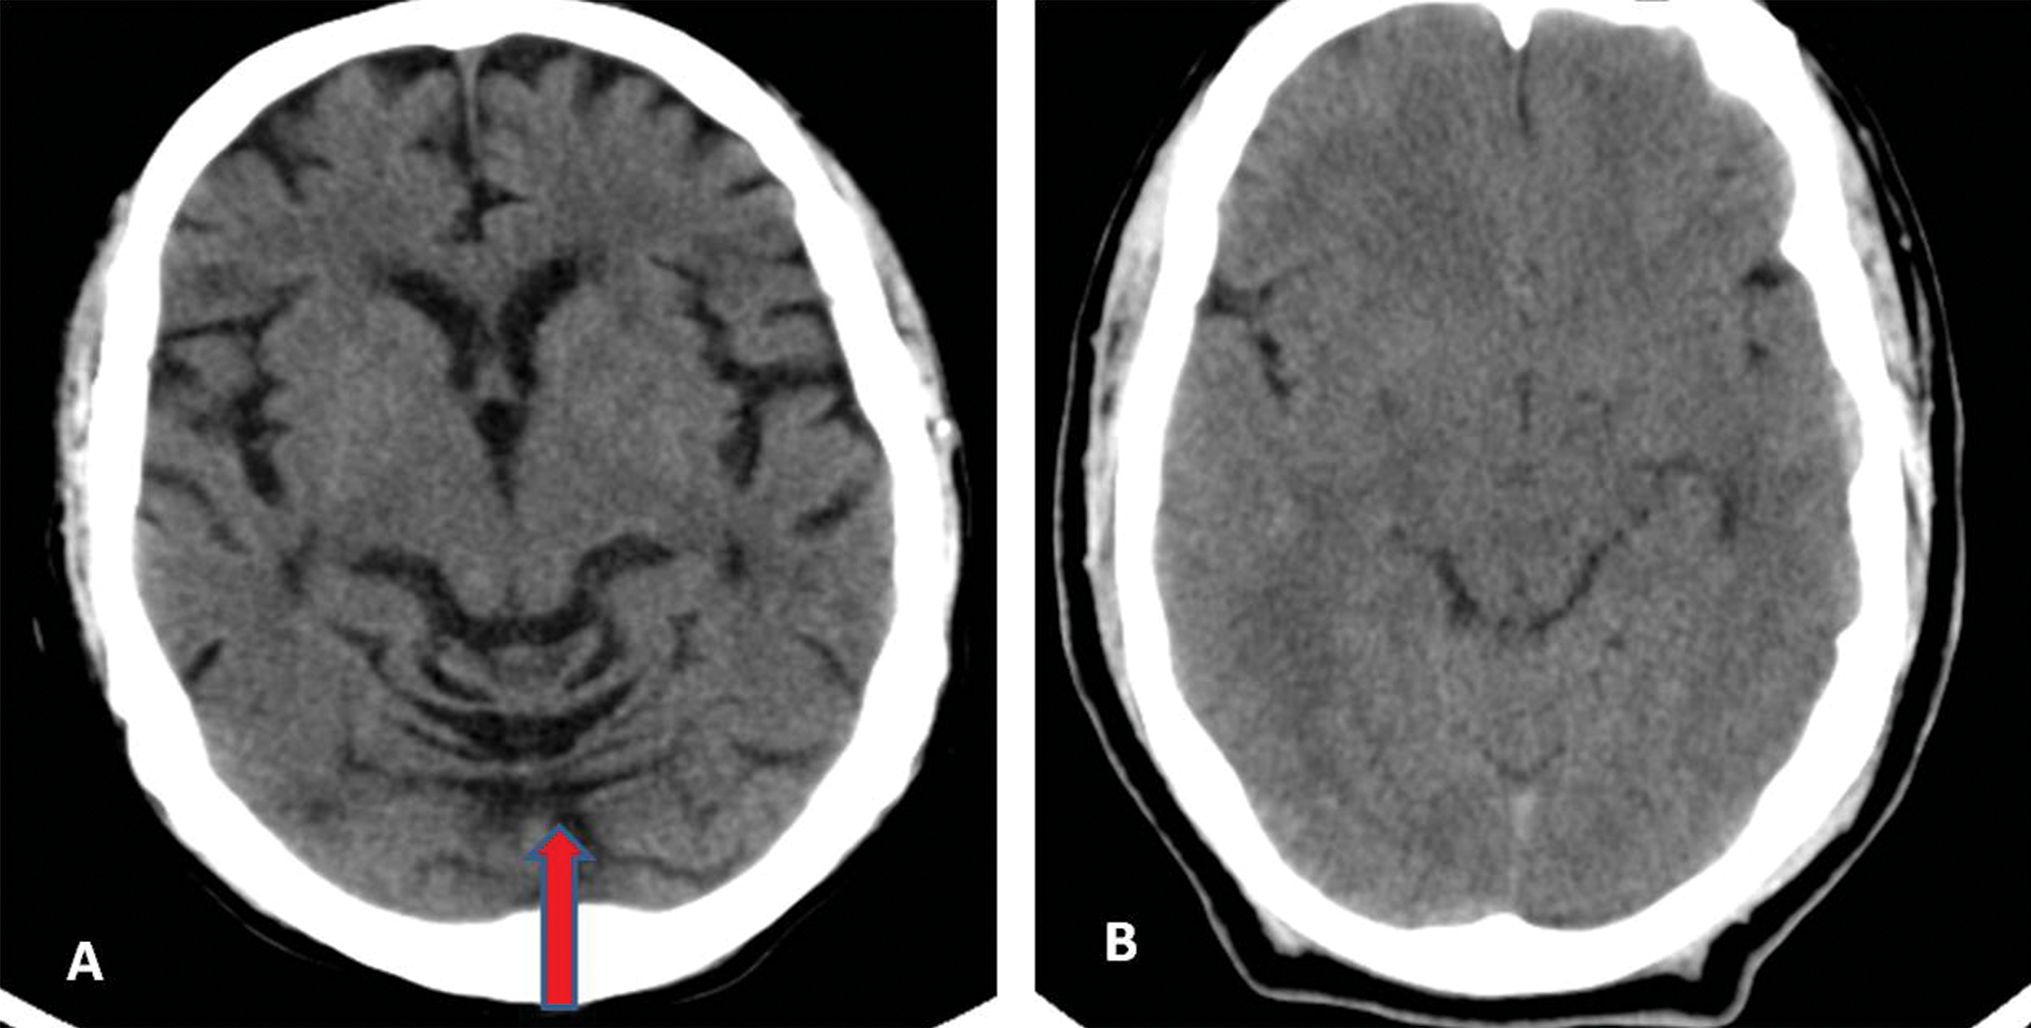
Fig. 5 (A) Case and (B) control: Frontal lobe atrophy present (red arrow) and absent, respectively.
Fig. 5 (A) Case and (B) control: Frontal lobe atrophy present (red arrow) and absent, respectively.
-
Fig. 6 (A) Case and (B) control: Cortical atrophy—sum of width of four widest sulci at two highest scanning levels/maximum inner skull diameter values 0.33 and 0.10, respectively.
Fig. 6 (A) Case and (B) control: Cortical atrophy—sum of width of four widest sulci at two highest scanning levels/maximum inner skull diameter values 0.33 and 0.10, respectively.
-
Fig. 7 (A) Case and (B) control: Cerebellar vermian atrophy present (red arrow) and absent, respectively.
Fig. 7 (A) Case and (B) control: Cerebellar vermian atrophy present (red arrow) and absent, respectively.
|
Variable |
30–45 years N (%) |
46–60 years N (%) |
|---|---|---|
|
Abbreviations: SD, standard deviation. aThe values are statistically significant. |
||
|
Bicaudate index |
||
|
0.07–0.10 |
15 (27.27) |
02 (3.92) |
|
0.11–0.15 |
36 (65.45) |
26 (50.98) |
|
0.16–0.20 |
04 (7.27) |
23 (45.10) |
|
Cases: mean ± SD |
0.12 ± 0.03 |
0.15 ± 0.02 |
|
Controls: mean ± SD |
0.08 ± 0.01 |
0.11 ± 0.01 |
|
p = 0.004a |
p = 0.0009a |
|
|
Ventricular index |
||
|
0.24–0.30 |
16 (20.09) |
00 (0.00) |
|
0.31–0.35 |
14 (25.45) |
06 (11.76) |
|
0.36–0.40 |
18 (32.73) |
22 (43.14) |
|
0.41–0.45 |
05 (9.09) |
20 (39.22) |
|
>0.45 |
02 (3.64) |
02 (3.92) |
|
Cases: mean ± SD |
0.34 ± 0.06 |
0.04 ± 0.04 |
|
Controls: mean ± SD |
0.25 ± 0.01 |
0.32 ± 0.03 |
|
p = 0.003a |
p = 0.002a |
|
|
Evan’s index |
||
|
< 0.31 |
39 (70.91) |
17 (33.33) |
|
≥ 0.31 |
16 (29.09) |
34 (66.67) |
|
Maximum transverse diameter of third ventricle |
||
|
< 6 mm |
34 (61.82) |
10 (19.61) |
|
≥ 6 mm |
21 (38.18) |
41 (80.39) |
|
Cortical atrophy |
||
|
0.01–0.15 |
12 (21.82) |
04 (7.84) |
|
0.16–0.20 |
10 (18.18) |
03 (5.88) |
|
0.21–0.25 |
20 (36.36) |
01 (1.96) |
|
0.26–0.30 |
07 (12.73) |
26 (50.98) |
|
> 0.30 |
06 (10.91) |
17 (33.33) |
|
Cases: mean ± SD |
0.21 ± 0.07 |
0.28 ± 0.06 |
|
Controls: mean ± SD |
0.10 ± 0.01 |
0.14 ± 0.04 |
|
p = 0.003a |
p = 0.0008a |
|
|
Frontal lobe atrophy |
||
|
Absent |
12 (21.82) |
07 (13.73) |
|
Present |
43 (78.18) |
44 (86.27) |
|
Cerebellar vermian atrophy |
||
|
Absent |
24 (43.64) |
10 (19.61) |
|
Present |
31 (56.36) |
41 (80.39) |
|
Brain atrophic changes |
||
|
Absent |
11 (20.00) |
06 (11.76) |
|
Present |
44 (80.00) |
45 (88.24) |
There was significant reduction in hemoglobin levels and significant increase in ventricular, cortical, and subcortical parameters with the grade of alcoholism in both age groups (Table 3).
|
Grade of alcoholism vs. indices of brain damage |
Age group |
p-Value |
||
|---|---|---|---|---|
|
30–45 years |
46–60 years |
30–45 years |
46–60 years |
|
|
Abbreviation: SD, standard deviation. aThe values are statistically significant. |
||||
|
Hemoglobin (mean ± SD) |
||||
|
Mild |
12.9 ± 0.8 |
12.6 ± 0.8 |
Mild vs. moderate |
|
|
0.048a |
0.038a |
|||
|
Moderate |
12.4 ± 0.6 |
11.6 ± 1.0 |
Mild vs. heavy |
|
|
0.005a |
0.005a |
|||
|
Heavy |
11.3 ± 0.7 |
11.0 ± 0.9 |
Moderate vs. heavy |
|
|
0.006a |
0.049a |
|||
|
Bicaudate index (mean ± SD) |
||||
|
Mild |
0.10 ± 0.02 |
0.12 ± 0.01 |
Mild vs. moderate |
|
|
0.005a |
0.005a |
|||
|
Moderate |
0.13 ± 0.03 |
0.14 ± 0.01 |
Mild vs. heavy |
|
|
0.045a |
0.0002a |
|||
|
Heavy |
0.15 ± 0.02 |
0.16 ± 0.01 |
Moderate vs. heavy |
|
|
0.008a |
0.004a |
|||
|
Ventricular index (mean ± SD) |
||||
|
Mild |
0.31 ± 0.04 |
0.35 ± 0.03 |
Mild vs. moderate |
|
|
0.005a |
0.039a |
|||
|
Moderate |
0.37 ± 0.03 |
038 ± 0.03 |
Mild vs. heavy |
|
|
0.002a |
0.004a |
|||
|
Heavy |
0.43 ± 0.02 |
0.43 ± 0.03 |
Moderate vs. heavy |
|
|
0.005a |
0.004a |
|||
|
Evanʼs index ≥ 0.31 N (%) |
||||
|
Mild |
0 (0.00) |
0 (00) |
||
|
Moderate |
07 (50.00) |
10 (62.50) |
||
|
Heavy |
09 (100.00) |
24 (96.00) |
||
|
Maximum transverse diameter of third ventricle (≥ 6 mm) N (%) |
||||
|
Mild |
02 (6.25) |
01 (10.00) |
||
|
Moderate |
10 (71.43) |
15 (93.75) |
||
|
Heavy |
09 (100.00) |
25 (100.00) |
||
|
Cortical atrophy (mean ± SD) |
||||
|
Mild |
0.17 ± 0.05 |
018 ± 0.06 |
Mild vs. moderate |
|
|
0.005a |
0.004a |
|||
|
Moderate |
0.24 ± 0.03 |
0.28 ± 0.02 |
Mild vs. heavy |
|
|
0.003a |
0.002a |
|||
|
Heavy |
0.30 ± 0.02 |
0.31 ± 0.03 |
Moderate vs. heavy |
|
|
0.002a |
0.007a |
|||
Discussion
CT scan is a widely available, reliable, and economical imaging technique that can detect gross neuropathological changes in the brain such as cortical atrophy, ventricular enlargement, and other intracranial changes.6 7 8 Noncontrast CT head scan in alcoholics in our study showed marked changes in all the CT indices of cortical, ventricular, and subcortical changes.
These indices were significantly altered when compared with age-matched controls and were related to the years of alcohol consumption and the daily amount of alcohol consumed.
As also reported by other authors,3 8 9 we observed diffuse and fairly symmetrical cerebral cortical atrophy, dilated lateral and third ventricles, and shrinkage of the cerebellar hemisphere and vermis (56 and 80% of alcoholics in 30–45 and 46–60 years age groups, respectively).
Frontal lobes showed the most marked shrinkage (78 and 86% in younger and older age groups, respectively) with widening of the interhemispheric fissures and frontal horns of the lateral ventricles. Similar observations have been made by others.8 9
The pathophysiology of alcohol effects on the brain has been studied and numerous hypotheses proposed. Alcohol and its metabolite directly cause neurotoxic effect resulting in demyelination and degeneration of the nervous tissue10 and indirectly by decreasing the blood flow to certain areas of cerebrum and cerebellum due to reduced flow rates in vessels, stasis, and aggregation of blood cells. The above effects are proportional to the amount of ethanol in blood.11 12
Pathological and neuroimaging studies show that chronic alcoholism leads to diffuse white matter volume loss with relative sparing of the gray matter.13 Few neuroimaging studies have suggested a causative role of smoking tobacco in brain atrophy in alcoholics. This hypothesis was however refuted by a recent pathological study that measured regional brain volumes and found no significant effects of smoking on either global or selected regional gray matter volumes in smokers or smoking alcoholics.14 We did not study the effects of smoking.
As reported by Whitehead et al,15 we also observed a significant reduction in hemoglobin levels with increase in grades of alcoholics in both age groups.
We did not include patients older than 60 years because age-related atrophic changes of the brain start manifesting at this stage. Female’s brains are more vulnerable to alcohol-related changes than males.2 We included only males in patient and control groups, since alcohol intake by females is considered a social stigma in India, especially in the rural population.16
Conclusion
We conclude from our epidemiological study that chronic alcoholism is a risk factor for brain atrophy. There is more or less symmetrical shrinkage of the cortex of the cerebral hemispheres with dilation of the lateral and third ventricles. Alcoholics had a greater degree of central and frontal brain atrophy as compared with controls.
Conflict of Interest
None declared.
Funding None.
References
- Cerebral atrophy in chronic alcoholism [in Spanish] Med Interna. 1989;6(11):571-574.
- [Google Scholar]
- Clinical, psychometric and radiological signs of brain damage in chronic alcoholism. Acta Neurol Scand. 1979;60(2):85-92.
- [Google Scholar]
- Audit - The Alcohol Use Disorders Identification Test: Guidelines for Use in Primary Care. Geneva: WHO, Department of Mental Health and Substance Dependence; 1993.
- [Google Scholar]
- Brain atrophy in alcoholics: relationship with alcohol intake; liver disease; nutritional status, and inflammation. Alcohol Alcohol. 2007;42(6):533-538.
- [Google Scholar]
- Structural changes in the insular cortex in alcohol dependence: a cross sectional study. Iran J Psychiatry. 2011;6(4):133-137.
- [Google Scholar]
- Computerized tomography in chronic alcoholics. Alcohol Clin Exp Res. 1981;5(2):283-294.
- [Google Scholar]
- High alcohol consumption, liver toxic drugs and brain damage–a population study. Ups J Med Sci. 1989;94(3):305-315.
- [Google Scholar]
- Alcohol, sludge, and hypoxic areas of nervous system, liver and heart. Microvasc Res. 1968;1:174-185.
- [Google Scholar]
- High ethanol intake and malnutrition in alcoholic cerebellar shrinkage. QJM. 2000;93(7):449-456.
- [Google Scholar]
- Alcoholʼs effects on brain: neuroimaging results in human and animal models. Alcohol Res. 2017;38(2):183-206.
- [Google Scholar]
- Re-investigating the effects of chronic smoking on the pathology of alcohol-related human brain damage. Alcohol. 2019;76:11-14.
- [Google Scholar]
- The effects of cigarette smoking and alcohol consumption on blood haemoglobin, erythrocytes and leucocytes: a dose related study on male subjects. Clin Lab Haematol. 1995;17(2):131-138.
- [Google Scholar]
- Alcohol related harm: Implications for public health and policy in India. Bangalore, India: Publication no. 73, NIMHANS; 2011.
- [Google Scholar]


