
Translate this page into:
CD4 Count, Magnetic Resonance-white Matter Signals, and Magnetic Resonance Spectroscopy in Human Immunodeficiency Virus Patients
Address for correspondence: Dr. M. A. Hashmi, Mri-Section, EKO Diagnostics Medical College and Hospitals Campus, 88 College St., Kolkata - 700 073, West Bengal, India. E-mail: ahashmidrrad@yahoo.co.in
This is an open access journal, and articles are distributed under the terms of the Creative Commons Attribution-NonCommercial-ShareAlike 4.0 License, which allows others to remix, tweak, and build upon the work non-commercially, as long as appropriate credit is given and the new creations are licensed under the identical terms.
This article was originally published by Medknow Publications & Media Pvt Ltd and was migrated to Scientific Scholar after the change of Publisher.
Sir,
Human deficiency virus (HIV) causes acquired immune deficiency syndrome (AIDS). The immune system of the body is vulnerable to attack by this virus and leads to multiple focal and diffuse lesions. Reduction in CD4 cells is seen. CD4 cells are type of immune cells, and they are also called “T-cells” or “helper cells.” Centers for Disease Control and Prevention define a person having AIDS if they have a CD4 count below 200, with or without any opportunistic infections or cancers.[1] Patients were mainly from School of tropical Medicine the largest tertiary center in eastern India, and from Medical College and Hospitals. Altogether 32 patients who were seropositive for HIV were examined in our center. Detailed history covering all relevant points including CD4 count and CD4% was recorded. Magnetic resonance (MR) spectroscopy study was done in all patients putting the voxel in white matter area. The study was done at 1.5 Tesla GE Signa, and the results were compiled and data analyzed.
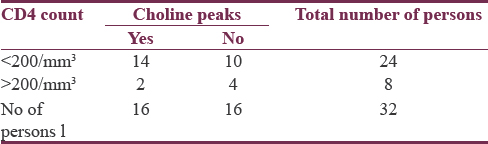
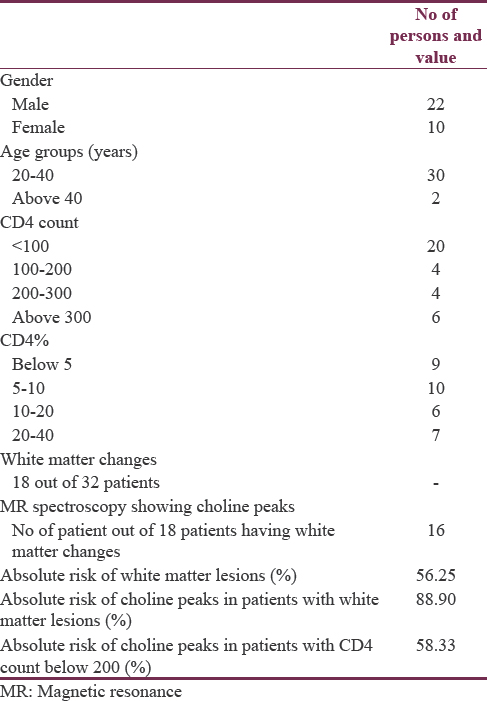
The data were accumulated in a tabular form as shown in Table 1 and Table 2. The majority of the patients were males about, and they were about 67.75% of the total population. Most of the patients were in the age group of 20–40 years and they comprised 93.75% of our study group. Twenty-four patients had CD4 count <200 cells/mm3. Eight patients had CD4 count above 200 cells/mm3. CD4% below 5% was seen in 9 patients comprising about 28.0%. CD4% between 5% and 10% was seen in 10 patients comprising about 31.25%. Six patients had CD4% between 20% and 40%. White matter changes were seen in 18 patients comprising about 56% of the study population as shown in Figure 1. MR Spectroscopy showing choline peaks which was seen in 16 patients [voxel placed as seen in Figures 2 and 3 is showing choline peaks] who were having white matter changes and comprised about 89% of them. The finding was that absolute risk of having white matter lesions in AIDs patient was 56.25%. Absolute Risk of choline peaks in patients with white matter lesions was 89.20%. Absolute risk of choline peaks in patients with CD4 Count below 200 was 58.33%.
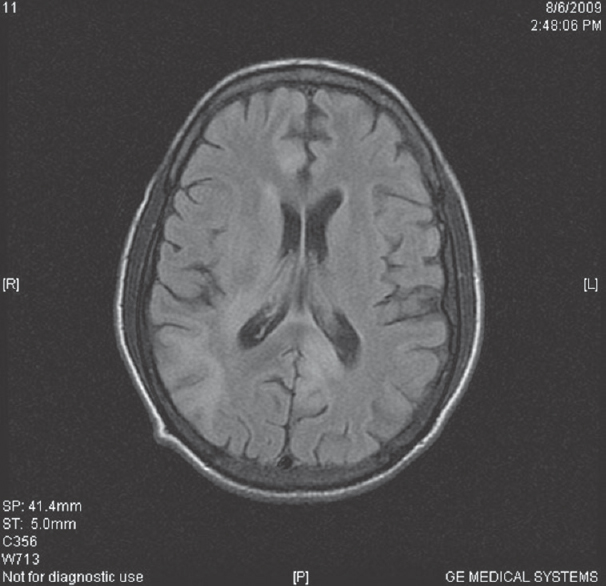
- T2 fluid-attenuated inversion recovery images are showing small white matter hyperintensities in the right subcortical parietal region and in periventricular region
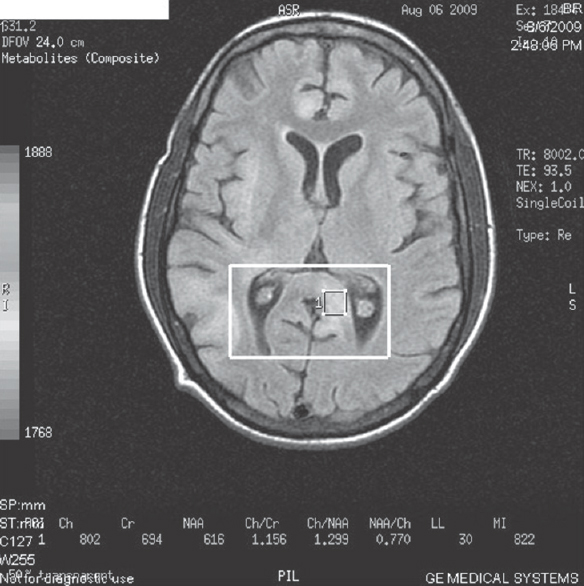
- Magnetic resonance spectroscopy done in posterior periventricular lesion
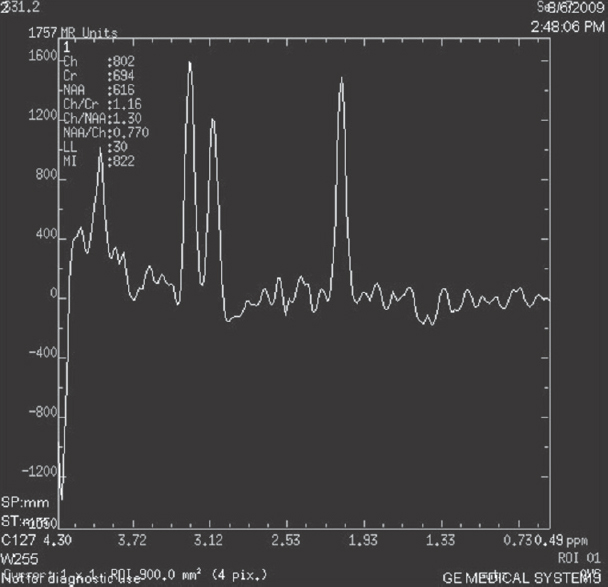
- Magnetic resonance spectroscopy showed increase in choline peaks at that level
HIV infection leads to multiple and diffuse lesions in the brain. Noninfective and nonmitotic focal lesions can also be small or diffuse white matter changes. CD4 cells are type of white cells that fight infection. CD4 cells move throughout the body destroying germ cells such as bacteria and viruses. A normal CD4 count is from 500 to 1500 cells cubic millimeter. Some patients can have CD4 countless but not so severe infections while the reverse can also be seen. CD4% or the rate of its change is a better predictor of clinical progression. Although the CD4+ absolute number that identifies a specific level of immune suppression changes with age,[2] the CD4+ percentage that defines each immunologic category does not. Thus, a change in CD4+ percentage, not number, may be a better marker to identify disease progression.[3] HIV infects and destroys CD + T Lymphocytes.[4]
HIV encephalopathy leads to myelin pallor leading to hyperintense signal changes as seen in T2 weighted imaging.[5] These lesions do not enhance. They do not have any mass effect. Increase in these lesions is seen as the patient condition deteriorates or CD4 or CD4% decreases. MR Spectroscopy is showing increase in choline peaks[6] and choline/creatine ratio.[78] Choline which resonates at 3.2 ppm is basically phosphatidylcholine and is a membrane constituent.[4] and is a marker of white matter lesions.[910] The study shows a correlation between CD4 count, white matter changes and choline peaks in MR Spectroscopy. Choline peaks are seen in about 89% of patients with white matter changes, which is a significant value. White matter changes are there CD4 count and CD% decreases. Significant increases in the choline/creatine ratios were seen in patients with low CD4 count.[9] The advantage of this study is that it will help in monitoring the treatment and cliniconeurological and radiological findings in HIV patient. By having CD4 count possibility of white matter changes and its associated importance can be known.
Financial support and sponsorship
Nil.
Conflicts of interest
There are no conflicts of interest.
Acknowledgment
We would like to thank all the staff that has greatly supported me in this project.
REFERENCES
- Evidence for lower CD4+T cell and higher viral load in asymptomatic HIV-1 infected individuals of India: Implications for therapy initiation. Indian J Med Microbiol. 2008;26:217-21.
- [Google Scholar]
- Co-infection with human immunodeficiency virus and tuberculosis. Indian J Dermatol Venerol Leprol. 2008;74:194-9.
- [Google Scholar]
- Identification of HIV-associated progressive multifocal leukoencephalopathy: Magnetic resonance imaging and spectroscopy. J Neuropsychiatry Clin Neurosci. 2003;15:1-6.
- [Google Scholar]
- Proton MR spectroscopy of HIV-infected patients: Characterization of abnormalities with imaging and clinical correlation. Radiology. 1993;186:739-44.
- [Google Scholar]
- Localised 1H-MR spectroscopy for metabolic characterisation of diffuse and focal brain lesions in patients infected with HIV. J Neurol Neurosurg Psychiatry. 1998;64:516-23.
- [Google Scholar]
- The imaging appearances of intracranial CNS infections in adult HIV and AIDS patients. Clin Radiol. 2006;61:393-401.
- [Google Scholar]
- Proton spectroscopy of the brain in HIV infection: Correlation with clinical, immunologic, and MR imaging findings. Radiology. 1993;188:119-24.
- [Google Scholar]
- Proton MRS and neuropsychological correlates in AIDS dementia complex: Evidence of subcortical specificity. J Neuropsychiatry Clin Neurosci. 2007;19:283-92.
- [Google Scholar]


