
Translate this page into:
Importance of 1H-MR spectroscopy of the brain to identify the minimal hepatic encephalopathy in different patients with liver cirrhosis: A prospective study
*Corresponding author: Deb Kumar Boruah, Department of Diagnostic and Interventional Radiology, All India Institute of Medical Sciences, Guwahati, Assam, India. drdeb_rad@yahoo.co.in
-
Received: ,
Accepted: ,
How to cite this article: Boruah DK, Marak R, Bhuyan D, Mazumdar H, Patgiri SJ. Importance of 1H-MR spectroscopy of the brain to identify the minimal hepatic encephalopathy in different patients with liver cirrhosis: A prospective study. J Neurosci Rural Pract. 2024;15:245-54. doi: 10.25259/JNRP_460_2023
Abstract
Objectives:
Liver cirrhosis patients commonly progress to minimal hepatic encephalopathy (MHE) with cognitive impairment and raised blood ammonia and proinflammatory cytokines levels. This study aims to identify the subjects of MHE in patients with liver cirrhosis by hydrogen 1 magnetic resonance (1H-MR) spectroscopy of the brain, serum proinflammatory cytokines, and neuropsychiatric tests.
Materials and Methods:
This prospective was carried out on 100 patients of liver cirrhosis without overt hepatic encephalopathy (HE) and compared with 100 healthy controls in a tertiary care hospital in Northeast India between September 2017 and October 2019. The psychometric hepatic encephalopathy score (PHES) neuropsychological tests, cranial MRIwith 1H-MR spectroscopy, and estimation of serum interleukin 6 (IL-6) and tumor necrosis factor-alpha (TNF-α) were done. The PHES scores and serum proinflammatory markers levels were correlated with the conventional and 1H-MR spectroscopy findings of the brain.
Results:
The mean PHES score in the case group was −7.58±3.43 (standard deviation [SD]) and the control group was −3.41 ± 3.87 (SD). Patients with Child-Pugh class A (n = 8) had a PHES score of −8.7 ± 2.5 (SD), class B (n = 42) −7.62 ± 3.7 (SD), and class C (n = 50) had a score of −7.36 ± 3.3 (SD). The mean value of IL-6 and TNF-α in the case group was 219 ± 180 (SD) pg/mL and 99 ± 118 (SD) pg/mL and the control group was 67.4 ± 77 (SD) pg/mL and 57.5 ± 76 (SD) pg/mL. Globus pallidus T1-weighted hyperintensities on the visibility scale with a visibility score of 0 were observed in 39 cases, a score of 1 in 38 cases, and a score of 2 in 23 cases. Increased glutamate/glutamine/creatine (Glx/Cr) ratio was identified in the case group on MR spectroscopy as compared to the control (0.95 ± 0.24 vs. 0.31 ± 0.19, P < 0.0005), a decrease of myoinositol/creatine (mI/Cr) ratio (0.11 ± 0.13 vs. 0.30 ± 0.12, P < 0.0005), and increase choline/creatine (Cho/Cr) ratio (0.69 ± 0.26 vs. 0.61 ± 0.20, P < 0.0005). There was a statistically significant difference in Glx/Cr, mI/Cr and Cho/Cr ratio between the case and control groups with P < 0.0005.
Conclusion:
Predicting the development of MHE in established cases of liver cirrhosis using non-invasive modalities like PHES, IL-6, TNF-α levels, and 1H-MR spectroscopy plays an important role in further progression to overt HE and coma.
Keywords
Magnetic resonance spectroscopy
Cirrhosis
Cerebral edema
Portal hypertension

INTRODUCTION
Hepatic encephalopathy (HE) has a various neurological and psychiatric abnormalities occurring in patients with liver dysfunction with a varied clinical spectrum ranging from minimal hepatic encephalopathy (MHE) to overt HE and even coma.[1] Subjects of MHE in liver cirrhosis or portosystemic shunts have impairment in their cognition, psychomotor activities, and low-grade cerebral edema (CE) without clinical signs and symptoms of overt encephalopathy.[2-4] Liver cirrhotic patients having normal mental status with a deficit in cognitive function reflect the presence of MHE.[2,3] Problems in attention, motor abilities, co-ordination, and speed of information were found in MHE patients.[2,3,5,6] Subtle cognitive and motor deficits were also observed in MHE patients.[7] The MHE patients with liver cirrhosis usually have normal neurological and mental status on standard clinical examination but have neuropsychological abnormalities.[8] Hence, degree or severity of MHE predicts the development of overt HE, which has a poor outcome as overt HE can occur in about 30–45% of liver cirrhotic patients and 10–50% in liver cirrhotic patients after transjugular intrahepatic portosystemic shunt (TIPPS).[7,9-11]
In liver cirrhotic patients, the prevalence of MHE ranges from 20% to 84%.[7,8] This larger variation of the MHE prevalence in cirrhotic patients is related to previous episodes of overt HE, the severity of liver cirrhosis, the presence of portal hypertension, patient age, and the presence of esophageal varices and portosystemic shunts (TIPSS).[12]
The CE is a frequent complication of overt HE or acute hepatic failure and is a cause of death from raised intracranial tension or intracranial herniations.[13] Predominant cytotoxic CE occurs in overt HE or acute liver failure (ALF).[14] The pathogenesis of MHE in cirrhosis patients due to increased ammonia or its detoxified derivative glutamate-glutamine complex, systemic inflammatory response from raised proinflammatory cytokines, and low-grade CE[15-19] and sudden development of CE in ALF patients.[20,21] Raised glutamine-glutamate complex identified/detected on hydrogen 1 magnetic resonance (1H-MR) spectroscopy reflect the brain hyperammonemia, which is associated with CE and HE.[22] The neuropsychological test incorporates tests of speed, attention, memory, executive function, and comprehension and is very useful in assessing patients with MHE.
The 1H-MR spectroscopy and diffusion tensor imaging (DTI) indices values are helpful in the detection of early neuronal changes in MHE or HE.[23] It also enables specific monitoring of the patients to therapy along with therapeutic efficacy.[23] Hence, it is important to early recognize MHE, and early institution of therapy can improve encephalopathy and prevent further development of overt HE. The 1H-MR spectroscopy showed an increase in glutamine glutamate (Glx) complex with an increase in glutamate/glutamine/ creatine (Glx/Cr) and choline/creatine (Cho/Cr) ratios and decreased myoinositol/creatine (mI/Cr) ratio.[24] The DTI showed increased mean diffusivity in liver cirrhotic patients with MHE and a decrease in mean diffusivity values after treatment with lactulose.[25]
This study aims to identify the subjects of MHE in patients with liver cirrhosis by 1H-MR spectroscopy of the brain, serum proinflammatory cytokines, and neuropsychiatric tests.
MATERIALS AND METHODS
A hospital-based prospective study was conducted in a tertiary care hospital in Northeast India between September 2017 and October 2019. Ethical clearance was obtained from the Institutional Ethics Review Committee. This study comprised 100 cases with clinically, sonographically, and biochemically proven cirrhosis of the liver, portosystemic shunt surgery, or other causes suspected to have MHE. All patients with liver cirrhosis irrespective of the etiology were enrolled in the study. Before undergoing an MRI scan, informed consent was obtained from all patients/guardians. The flow chart of this study is shown in Figure 1.
- The flowchart of the study. MHE: Minimcal hepatic encephalopathy, NCT: Number connection test, TNF: Tumor necrosis factor, IL: Interleukin.
All diagnosed patients of liver cirrhosis more than 18 years of age without overt HE were included in this study. Liver cirrhotic patients with clinically overt HE, total parenteral nutrition, and other significant systemic diseases were excluded from the study. Liver cirrhotic patients contraindicated to MRI scans, such as MRI incompatible pacemakers, claustrophobia, and poor MRI image quality due to motion artifacts were also excluded from the study.
The control group consisted of 100 age- and sex-matched healthy volunteers without clinical and sonographic evidence of liver cirrhosis. All controls and cases underwent clinical examination, laboratory investigations, serum proinflammatory cytokines, neuropsychiatric psychometric hepatic encephalopathy score (PHES) battery test, and MRI of the brain including 1H-MR spectroscopy. According to the Child-Pugh scale, the case group was categorized into class A, class B, and class C.
Neuropsychiatric analysis
Neurocognitive assessments were done in the cases and controls using the PHES. The PHES is a standardized test consisting of six tests including the number connection test -A, figure connection test, serial-dotting test, digital symbol test, and line-tracing test for time (t) and for error (e). These tests were applied in cases and healthy controls. The Z score of a test indicates the difference between the observed and expected scores for a given age and education based on controls. A negative Z score indicated poor performance.
Those with Z score ± 1 scored 0 points, those with −1 and −2 scored −1 points, those between −2 and −3 scored −2 points, and those with <−3 scored −3 points. The result was better than the +1Z score was scored by +1 point. The individual six test scores were summarized to a sum score of the PHES ranging from +6 to −18 points.
MRI of the brain with 1H- MR spectroscopy
All cases and controls underwent a cranial MRI using a 1.5T MR scanner, Siemens MAGNETOM Avanto (Siemens Medical Systems, Erlangen, Germany). Initially, routine MRI sequences were obtained followed by low TE 1H-MR spectroscopy. The MRI parameters of various sequences are shown in Table 1.
| MRI sequence | TE (ms) | TR (ms) | Matrix | FOV | Slice thickness (mm) | Flip angle | Others |
|---|---|---|---|---|---|---|---|
| T2W axial | 90–110 | 3800–6000 | 512 | 220–250 | 5 | 150° | |
| T1W axial | 8–10 | 500–600 | 512 | 220–250 | 5 | 150° | |
| FLAIR axial | 90–100 | 9000 | 512 | 220–250 | 5 | 150° | TI=2500 ms |
| DWI axial | 90–110 | 3000–4000 | 128 | 220–250 | 5 | 90° | b-value=0 and 1000 s/mm2 |
| SWI axial | 40 | 50–60 | 256 | 220–250 | 2 | 15° | |
| T1W-sagittal | 8–10 | 500–600 | 256 | 220–250 | 4 | 90° | |
| T2W-coronal | 80–95 | 4000–6000 | 512 | 220–250 | 4 | 150° | |
| 1H-MR spectroscopy | 30 | - | Single voxel, placed in the globus pallidus using a PRESS sequence. |
MRI: Magnetic resonance imaging, FOV: Field of view, FLAIR: Fluid-attenuated inversion recovery, DWI: Diffusion-weighted imaging, SWI: Susceptibility weighted imaging, TI: Time of inversion, TE: Time of echo, TR: Repetition time, PRESS: Point-resolved spectroscopy, T1W: T1 weighted, T2W: T2 weighted, 1H-MR: Hydrogen 1 magnetic resonance
Visibility score of T1-weighted (T1W) hyperintensities
The visibility of the T1W hyperintensities in globus pallidi was categorized on a 3-point scale from 0 to 2. Score 0 = mild T1W hyperintensity [Figure 2], 1 = moderate distinctly present T1W hyperintensity [Figure 3], and 2 = markedly bright T1W hyperintensity on T1W images [Figure 4].
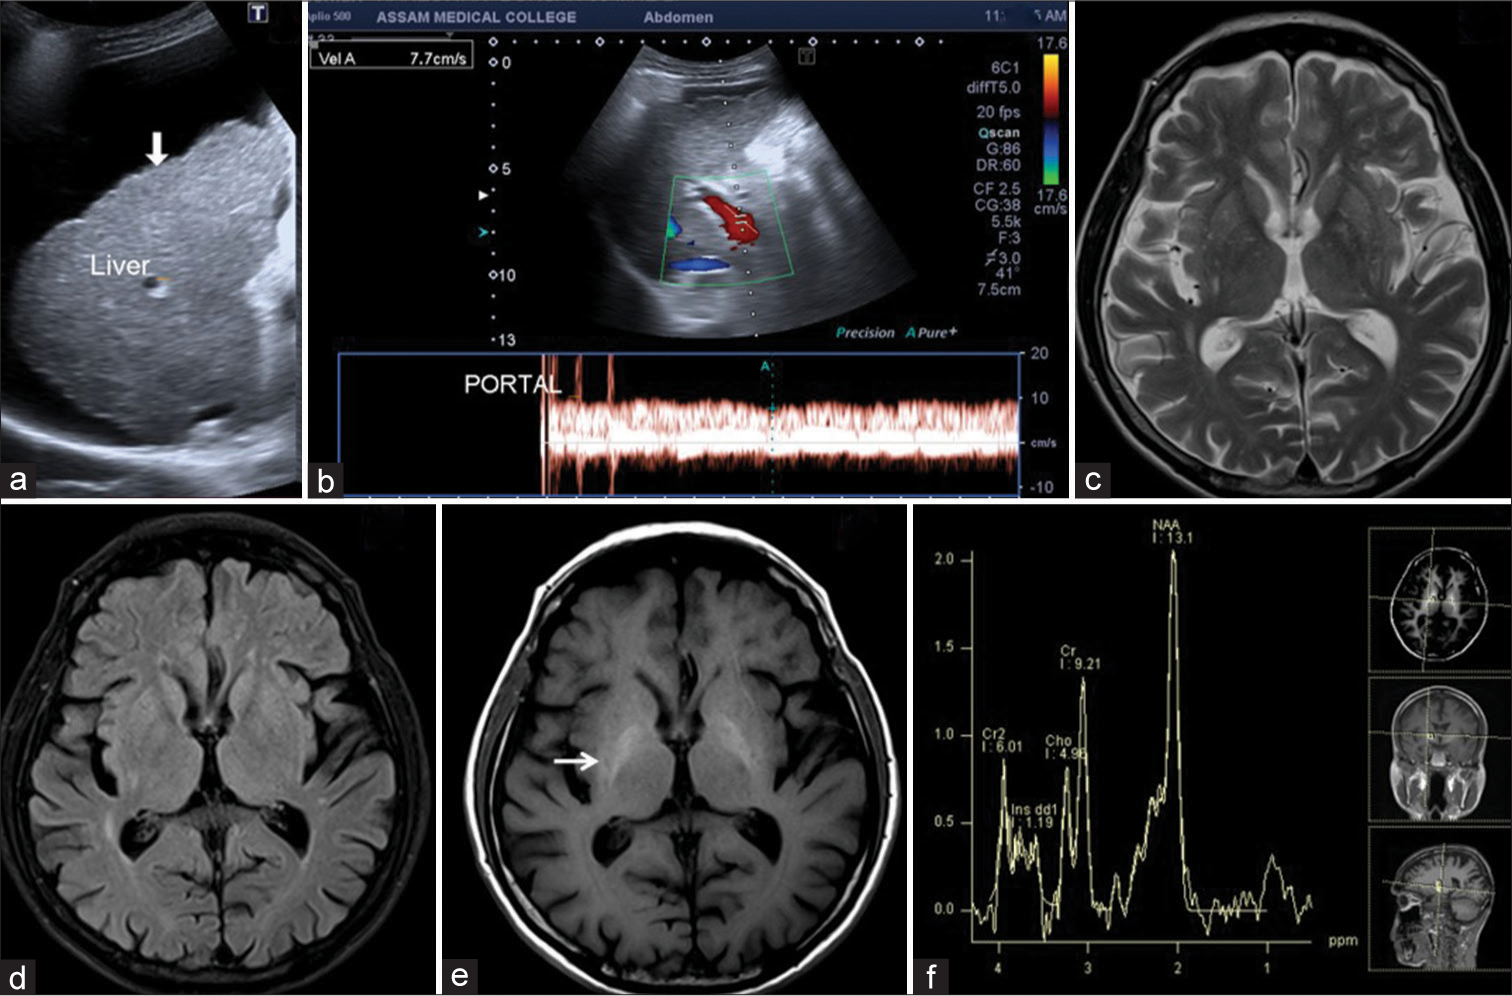
- 65-year-male patient with liver cirrhosis had mildly positive minimal hepatic encephalopathy. (a) USG image showed ascites with liver surface irregularities and nodularities (arrow). (b) Color Doppler image of portal vein flow velocity showed portal hypertension with a flow velocity of 7.7 cm/s. (c and d) Axial T2-weighted and fluid-attenuated inversion recovery images showed diffuse cerebral atrophy. (e) Axial T1-weighted image showed mildly T1 hyperintensities in the bilateral globus pallidi (arrow). (f) Low time of echo magnetic resonance spectroscopy showed a minimally raised Glx peak.
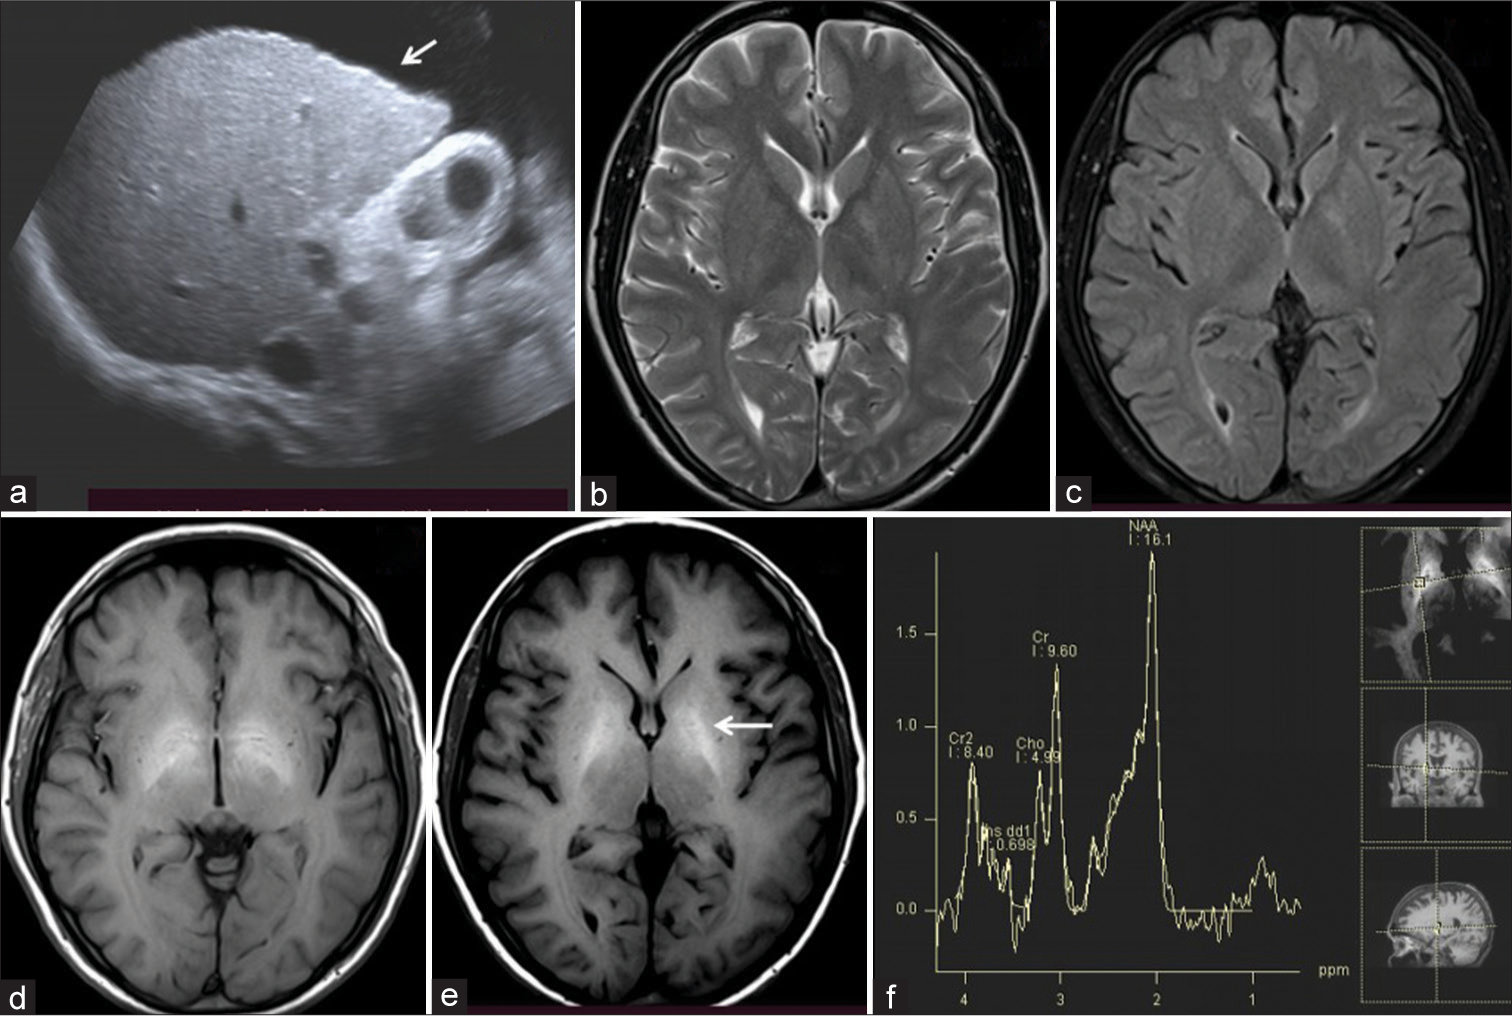
- 40-year-male patient with liver cirrhosis had moderately positive minimal hepatic encephalopathy. (a) USG image showed ascites with liver surface irregularities (arrow). (b and c) Axial T2-weighted and fluid-attenuated inversion recovery images showed mild cerebral atrophy. (d and e) Axial T1-weighted images showed moderate T1 hyperintensities in the bilateral globus pallidi (arrow). (f) Low time of echo magnetic resonance spectroscopy showed raised Glx peak.
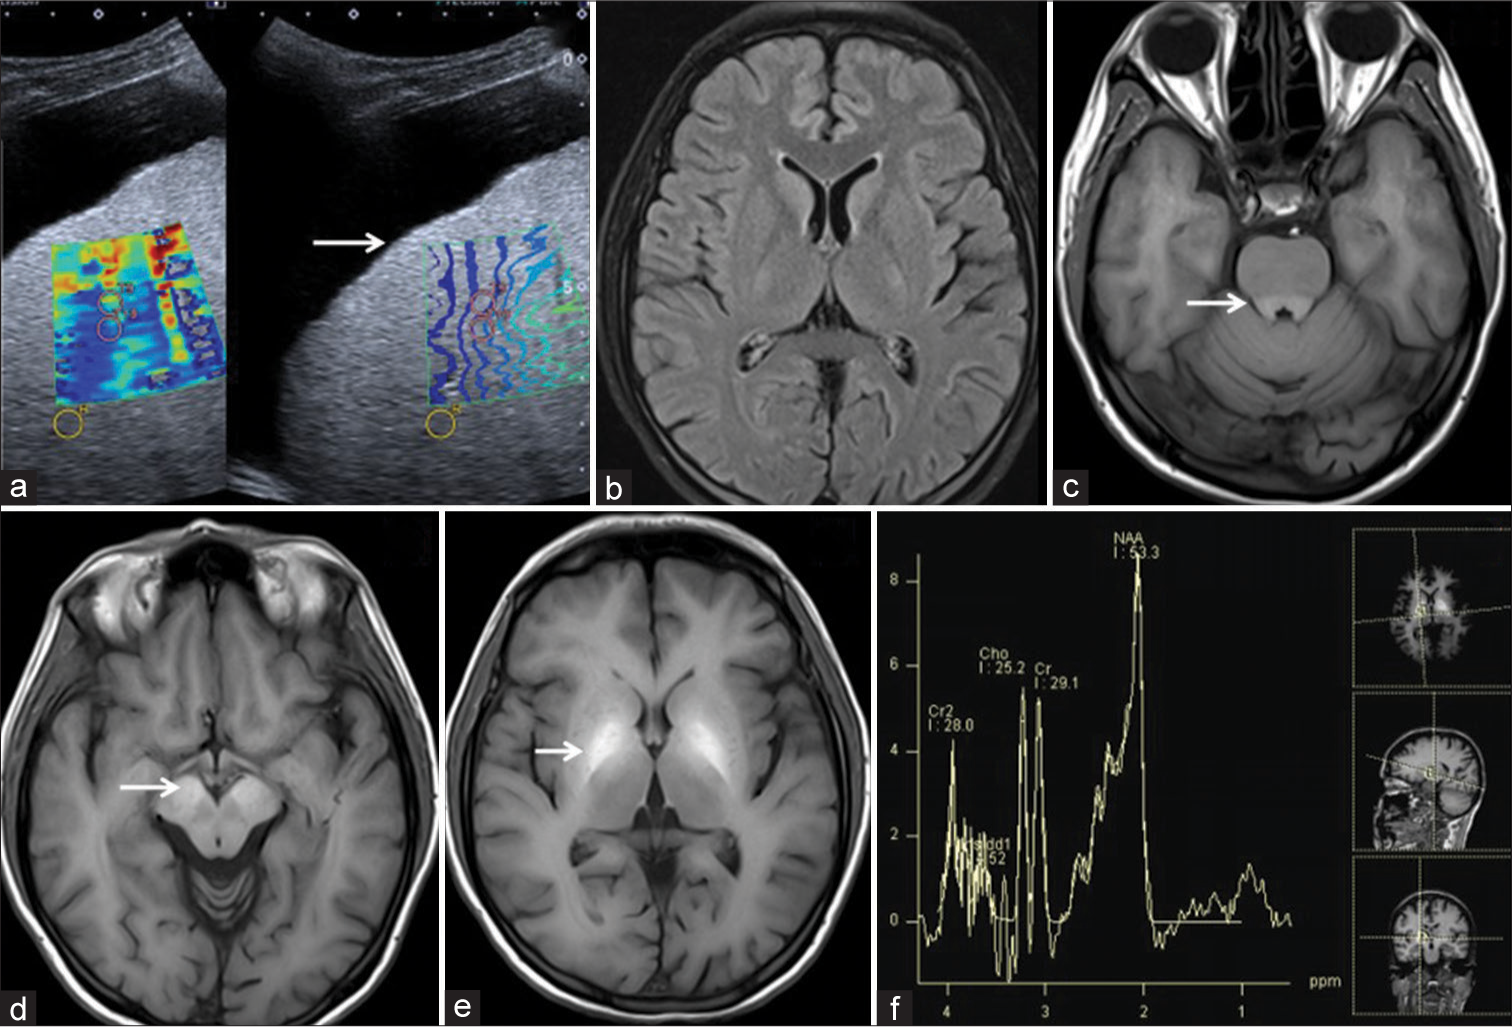
- 37-year-male patient with liver cirrhosis had moderately positive minimal hepatic encephalopathy with Pontine involvement. (a) USG image showed ascites with liver surface irregularities and nodularities (arrow) with a mosaic color pattern of shear wave elastography. (b) Axial fluid-attenuated inversion recovery image showed mild cerebral atrophy. (c-e) Axial T1 weighted image showed moderate T1 hyperintensities in the basilar portion of Pons, bilateral substantia nigrae and globus pallidi (arrows). (f) Low time of echo magnetic resonance spectroscopy showed a Glx peak.
1H-MR spectroscopy
Single-voxel low time of echo (TE) (TE = 30 ms) 1H-MR spectroscopy was obtained. A voxel of 5–8 mL was placed in the right globus pallidus in all cases and controls. The presence of Glx complex (Glutamine, Glutamate, and Gamma-aminobutyric acid complex) peak was detected in 2.05–2.50 ppm. The Glx/Cr, Cho/Cr, and mI/Cr ratios were calculated from the spectrum in Siemens syngo.via imaging software.
Biochemical correlation
Tumor necrosis factor-alpha (TNF-α) and interleukin 6 (IL-6) pro-inflammatory cytokines levels were estimated by quantitative enzyme-linked immunosorbent assay (ELISA) method. TNF-α and IL-6 were estimated using Invitrogen Human TNF-α ELISA and Invitrogen Human IL-6 ELISA kits (BD OptEIA ELISA kit—BD biosciences-San Jose, California, USA).
ELISA technique
The IL-6 and TNF-α ELISA tests utilize monoclonal antibodies specific for IL-6 and TNF-α on a 96-well plate each. The IL-6 and TNF-α concentrations are determined in accordance with the standard curve, with IL-6 and TNF-α concentration on the X-axis and absorbance on the Y-axis.
Liver function tests, prothrombin time, and other routine examinations of blood and other ancillary tests were also performed.
Follow-up
All cases were followed up for four weeks after the MRI scans, and the patient’s survivability was recorded.
Statistical analysis
All the data analysis was performed using the Statistical Package for the Social Science version 16. The results were shown as mean ± (standard deviation [SD]). Student’s t-test was used for comparison between the control and case groups. Pearson Chi-square test and non-parametric Mann– Whitney U-test were also analyzed. P < 0.005 was considered as statistically significant.
RESULTS
This study comprised 100 patients with liver cirrhosis and 100 healthy controls. The case group comprised 85 males and 15 females. The age ranges from 22 to 70 years with a mean age of 45.18 ± 10.8 (SD). The clinical, biochemical profiles, and USG findings are shown in Table 2.
| Variable (parameters) | Cases (MHE) | Control | P-value |
|---|---|---|---|
| Age (years) | 45.18±10.8 (SD) | 45.57±15.2 (SD) | 0.112 |
| Spleen size (cm) | 14.50±0.52 (SD) | 12.65±0.53 (SD) | 0.001 |
| Disease duration (months) | 6.32±0.67 (SD) | - | - |
| ALT (U/L) | 82.56±65.78 (SD) | 15.66±4.88 (SD) | 0.0005 |
| AST (U/L) | 129.12±89.1 (SD) | 21.33±0.53 (SD) | 0.0005 |
| ALP (U/L) | 180.41±81.75 (SD) | 16.37±2.75 (SD) | 0.0005 |
| S. Bilirubin (mg/dL) | 5.32±5.23 (SD) | 0.74±0.21 (SD) | 0.0005 |
| Child-Pugh class | |||
| A (5–6) | 8 | - | - |
| B (7–9) | 42 | - | - |
| C (10–15) | 50 | - | - |
| IL-6 (pg/mL) – Mean | 219±180 (SD) | 67.4±77 (SD) | 0.0005 |
| TNF-α(pg/mL) – Mean | 99±118 (SD) | 57.5±76 (SD) | 0.065 |
| PHES score (mean) | |||
| Mean | −7.58±3.43(SD) | −3.41±3.87 (SD) | 0.0005 (Mann-whitney U-test) |
| Child-Pugh class A | −8.7±2.5 (SD) | ||
| Child-Pugh class B | −7.62±3.7 (SD) | ||
| Child-Pugh class C | −7.36±3.3 (SD) | ||
| IL-6 (pg/mL) | |||
| Mean | 219±180 (SD) | 67.4±77 (SD) | 0.0005(Mann-Whitney U test) |
| Child-Pugh class A | 81.76±41.1 (SD) | ||
| Child-Pugh class B | 219±180 (SD) | ||
| Child-Pugh class C | 242±185 (SD) | ||
| TNF-α(pg/mL) | |||
| Mean | 99±118 (SD) | 57.5±76 (SD) | 0.065(Mann-Whitney U test) |
| Child-Pugh class A | 131±185 (SD) | ||
| Child-Pugh class B | 112±119 (SD) | ||
| Child-Pugh class C | 82.7±104 (SD) | ||
| T1W visibility score | |||
| Child-Pugh class A | Score 2 (n-1), score 1 (n-4), score 0 (n-3) | ||
| Child-Pugh class B | Score 2 (n-4), score 1 (n-15), score 0 (n-23) | ||
| Child-Pugh class C | Score 2 (n-18), score 1 (n-19), score 0 (n-13) | ||
| Glx/Cr ratio (According to Child-Pugh class) | |||
| Mean | 0.95±0.24 (SD) | 0.30±0.01 (SD) | 0.0005 |
| Child-Pugh class A | 0.89±0.22 (SD) | ||
| Child-Pugh class B | 0.96±0.21 (SD) | ||
| Child-Pugh class C | 0.96±0.27 (SD) | ||
| mI/Cr ratio (According to Child-Pugh class) | |||
| Mean | 0.11±0.13 (SD) | 0.30±0.01 (SD) | 0.0005 |
| Child-Pugh class A | 0.08±0.09 (SD) | ||
| Child-Pugh class B | 0.13±0.16 (SD) | ||
| Child-Pugh class C | 0.09±0.10 (SD) | ||
| Cho/Cr ratio (According to Child-Pugh class) | |||
| Mean | 0.69±0.26 (SD) | 0.60±0.02 (SD) | 0.0005 |
| Child-Pugh class A | 0.65±0.28 (SD) | ||
| Child-Pugh class B | 0.75±0.20 (SD) | ||
| Child-Pugh class C | 0.64±0.29 (SD) | ||
| Glx/Cr ratio (According to severity) | |||
| Mild MHE (n-39) | 0.92±0.21 (SD) | ||
| Moderate MHE (n-38) | 1.00±0.29 (SD) | ||
| Severe MHE (n-23) | 0.64±0.26 (SD) | ||
| mI/Cr ratio (According to severity) | |||
| Mild MHE (n-39) | 0.12±0.11 (SD) | ||
| Moderate MHE (n-38) | 0.12±0.17 (SD) | ||
| Severe MHE (n-23) | 0.07±0.06 (SD) | ||
| Cho/Cr ratio (According to severity) | |||
| Mild MHE (n-39) | 0.70±0.27 (SD) | ||
| Moderate MHE (n-38) | 0.71±0.25 (SD) | ||
| Severe MHE (n-23) | 0.64±0.26 (SD) | ||
| Survivability up to 14 days follow-up | |||
| Child-Pugh class A | Alive (n-7), Died (n-1) | 0.030 (Chi-square) | |
| Child-Pugh class B | Alive (n-34), Died (n-8) | ||
| Child-Pugh class C | Alive (n-29), Died (n-21) |
MRI: Magnetic resonance imaging, MHE: Minimal hepatic encephalopathy, PHES: Psychometric hepatic encephalopathy score, TNF-α: Tumor necrosis factor-alpha, T1W: T1 weighted, IL-6: Interleukin-6, ALT: Alanine aminotransferase, AST: Aspartate aminotransferase, ALP: Alkaline phosphatase, S. Bilirubin: Serum bilirubin, Glx/Cr: Glutamate/glutamine/creatine, mI/Cr: Myoinositol/creatine, Cho/Cr: Choline/creatine
PHES score
The PHES score in cases ranges from −12 to +3, and in control groups, it ranges from −11 to +3. The case group had a mean PHES score of −7.58 ± 3.43 (SD) and the control group had a mean PHES score of −3.41 ± 3.87 (SD). The Child-Pugh class A (n = 8) liver cirrhotic patient had a PHES score of −8.7 ± 2.5 (SD), class B (n = 42) had −7.62 ± 3.7 (SD), and class C (n = 50) had −7.36 ± 3.3 (SD), as shown in Table 2. There was a significant statistical correlation between the PHES score between the case and control groups (P < 0.0005) shown in the Boxplot [Figure 5]. However, no statistical correlation was found between the PHES score and Child-Pugh categories (P = 0.602 ) in between the Child-Pugh class A and B, (P = 0.990) in between the Child-Pugh class B and C and (P = 0.590) in between the Child-Pugh class A and C.

- Boxplot showed the range of distribution of the psychometric hepatic encephalopathy score (PHES) score and proinflammatory cytokines levels in 100 cases of liver cirrhosis and 100 control group. (a) showed a boxplot of PHES score with a statistically significant difference between the PHES scores in case and control groups with P = 0.0005. (b) showed boxplot of tumor necrosis factor-alpha level and (c) showed interleukin-6 level in case and control groups.
Proinflammatory cytokine
The mean value of IL-6 in 100 cases was 219 ± 180 (SD) pg/mL. Child-Pugh class A had a mean IL-6 value of 81.76 ± 41.1 (SD), class B had 219 ± 180 (SD), and class C had 242 ± 185 (SD) pg/mL. The control group had a mean IL-6 value of 67.4 ± 77 (SD) pg/mL. The mean value of TNF-α in 100 cases was 99 ± 118 (SD) pg/mL. The IL-6 and TNF-α value in case and control groups are shown in Boxplot in Figure 5. Child-Pugh class A had a mean TNF-α value of 131 ± 185 (SD), class B had 112 ± 119 (SD), and class C had 82.7 ± 104 (SD) pg/mL. The control group had a mean TNF-α value of 57.5 ± 76 (SD) pg/mL. The TNF-α and IL-6 levels were statistically correlated according to the T1W image signal intensities, Child-Pugh score, and Glx/Cr ratio in mean curve analysis with P = 0.0005.
MRI brain and MR spectroscopy
T1W visibility score
The MRI brain in all 100 cases showed variable T1 hyperintensities in bilateral globus pallidus and substantia nigra. On the three-point visibility scale, a score of 0 = mild T1W hyperintensities was observed in 39 cases [Figure 2], a score = 1 moderate distinctly present T1W hyperintensity in 38 cases [Figure 3], and a score of 2 = markedly bright T1W hyperintensity was observed in 23 cases [Figure 4]. No T1 hyperintensities were seen in the control group. Involvement of the basilar part of Pons was observed in 29 cases [Figure 4]. The correlation of T1 hyperintensities visibility score and Child-Pugh score is shown in Table 2. There is a statically significant difference between the T1W hyperintense visibility score with the Child-Pugh score of 100 cases of Liver cirrhosis with P = 0.014, as shown in Table 2.
1H-MR spectroscopy
The MHE patients showed increased Glx complex with increased Glx/Cr ratio as compared to the control group on low TE (30 ms) 1H-MR spectroscopy. The case group had a mean Glx/Cr ratio of 0.95 ± 24.7 (SD) while the control group had 0.30 ± 0.01 (SD). Decreased myoinositol with decreased mean mI/Cr ratio and increased choline peak with increased Cho/Cr ratio were found in the case group as compared to the control group. The mean mI/Cr ratio was 0.11 ± 0.13 (SD) in the case group and 0.30 ± 0.12 (SD) in the control group and the mean Cho/Cr ratio was 0.69 ± 0.26 (SD) in the case group and 0.61 ± 0.20 (SD) in the control group, as shown in Table 2. There was a statistically significant difference in the Glx/Cr, mI/Cr, and Cho/Cr ratio between the case and control groups with P < 0.0005. Child-Pugh class A (n = 8) cases had a mean Glx/Cr ratio 0.89 ± 22 (SD), class B (n = 42) had 0.96 ± 0.21 (SD), and class C (n = 50) had 0.96 ± 0.27 (SD), as shown in Table 2. The changes of Glx/Cr, mI/Cr, and Cho/Cr ratio vary according to the Child-Pugh score and MRI signal intensities on T1W images as shown in Table 2.
The ratio of chemical metabolites
The mean and range of the ratio of various chemical metabolites detected on 1H-MR spectroscopy according to the severity of the MHE are shown in Table 2. The comparison between the PHES score and chemical metabolite ratio is shown in Table 2. A statistically significant difference was observed between the Glx/Cr, mI/Cr, and Cho/Cr ratio and PHES score in both case and control groups with P < 0.0005.
Cerebral cortical involvement
Cerebral cortical involvement was found in 13 cases (13%) of MHE. More affection of the frontal lobes was observed followed by the parietal lobes.
Associated brain parenchymal findings
Cerebral and cerebellar atrophy changes were observed in 36 cases and isolated cerebellar hemispheric and cerebellar vermian atrophy changes in 11 cases. Acute ischemic infarctions were observed in seven cases and chronic ischemic changes in 11 cases. Acute brain parenchymal hemorrhages were observed in five cases and chronic brain parenchymal hemorrhages in seven cases. Transient splenial hyperintensities were observed in five cases.
The outcome of patients with MHE
The survivability of the 100 cases of MHE is shown in Table 2. Twenty-one (42%) cases of Child-Pugh C died during the follow-up period while eight (19%) cases of Child-Pugh B and one (12.5%) in Child-Pugh A. There is a statistically significant difference between the Child-Pugh scale in the case group of liver cirrhosis and patient survivability in the four-week follow-up period with P = 0.030, as shown in Table 2.
DISCUSSION
This study measured the 1H-MR Spectroscopy findings of the brain in liver cirrhotic patients to identify MHE, which were correlated with the neuropsychiatric PHES test and proinflammatory cytokines and compared with the control group.
For the detection of MHE, the previous guidelines suggested neuropsychological analysis such as PHES battery and critical flicker frequency tests.[26,27]
Early detection of MHE is considered crucial in liver cirrhotic patients, as around 50% of MHE patients and 8% without MHE may convert into clinically overt HE during the follow-up period.[28]
This study, in a novel way, predicts the development of MHE in established cases of liver cirrhosis or those patients with portosystemic shunt surgery using newer non-invasive modalities such as PHES, IL-6, TNF-α levels, and Glx/Cr ratio on MR spectroscopy. In this study, increased levels of IL-6, TNF-α, Glx/Cr, mI/Cr, and Cho/Cr ratio were identified in the MHE case group as compared to the control group. These data indicate disturbed brain metabolism in MHE patients, which help in treatment initiation in MHE patients and further prevention of dreaded complications such as overt HE, cerebral herniation, and death.[29]
The MHE is relatively common in India, mainly due to alcohol abuse and infections such as Hepatitis B and C. There is no known documentary evidence of any study carried out in this region addressing the early detection of changes in central nervous system and assessment of the severity of HE.
Our study can predict the development of MHE in established cases of liver cirrhosis irrespective of the etiology with the use of PHES, MRI brain with low TE MR spectroscopy, and proinflammatory cytokines (IL-6 and TNF-α), which will help in the early institution of treatment and prevention of overt HE.
In our study sample, higher proinflammatory cytokines were observed in cirrhotic patients with MHE as compared to the control group due to hyperammonia-induced systemic inflammatory response with subsequent neuropsychological alteration.[30]
Increased Glx/Cr ratio with decreased mI/Cr ratio with or without increased Cho/Cr ratio is the hallmark of MHE or HE in patients with chronic liver failure.[31] The characteristic cerebral changes in MHE among cirrhotic patients are due to increased ammonia and its conversion into the glutamineglutamate complex.
In our study, we found that 1H-MR spectroscopy demonstration of chemical changes in liver cirrhotic patients significantly correlated with Child-Pugh criteria as observed by the previous studies.[29,32] The metabolic disturbances in patients with MHE having MR spectroscopy detectable increased glutamine/glutamate complex and reduction of myoinositol (mI) indicates low-grade cerebral edema.[29]
Our study also showed synergistic effects between the raised proinflammatory cytokines and low-grade CE and subsequent abnormal neurocognitive and various neuropsychiatric manifestations.[33] The neuropsychiatric test evaluation of cirrhotic patients is sometimes difficult due to multi-factorial causes of low-grade encephalopathy. Various confounding factors impact the PHES test evaluation.[34] Therefore, use of non-invasive techniques like MR Spectroscopy is more demanding for identifying MHE in cirrhotic patients.[35]
Limitations of the study
In our study sample, only adult patients of more than 18 years of age were included, so a larger sample size of pediatric and adult patient populations is needed in the future to confirm these MRI findings and compare the neuropsychiatry tests for the early detection of MHE. There were no interobserver variations accounted for scoring the T1W hyperintensity on the “three-point visibility scale” in this study sample.
CONCLUSION
Liver cirrhotic patients associated with abnormal neuropsychiatric manifestations on PHES test, raised inflammatory cytokines such as IL-6, TNF-α, and 1H-MR spectroscopy predicting the development of MHE and its severity. The raised Glx/Cr and reduction of mI/Cr ratio in 1H-MR spectroscopy in liver cirrhotic patients as compared to the control groups are considered as a potential tool for diagnosis of MHE. In addition, 1H-MR spectroscopy helps in the prioritization of cirrhotic patients waiting for liver transplantation.
Ethical approval
The research/study approved by the Institutional Review Board at Assam Medical College, number AMC/EC/3640, dated March 31, 2015.
Declaration of patient consent
The authors certify that they have obtained all appropriate patient consent.
Conflicts of interest
There are no conflicts of interest.
Use of artificial intelligence (AI)-assisted technology for manuscript preparation
The authors confirm that there was no use of artificial intelligence (AI)-assisted technology for assisting in the writing or editing of the manuscript and no images were manipulated using AI.
Financial support and sponsorship
This study was funded by Indian Council of Medical Research (ICMR) with seed grant ID: 2014-3056 (PI-Dr Deb K.Boruah).
References
- Hepatic encephalopathy-definition, nomenclature, diagnosis, and quantification: Final report of the working party at the 11th World Congresses of Gastroenterology, Vienna 1998. Hepatology. 2002;35:716-21.
- [CrossRef] [PubMed] [Google Scholar]
- Prevalence and natural history of subclinical hepatic encephalopathy in cirrhosis. J Gastroenterol Hepatol. 2001;16:531-5.
- [CrossRef] [PubMed] [Google Scholar]
- Demonstration of interstitial cerebral edema with diffusion tensor MR imaging in type C hepatic encephalopathy. Hepatology. 2006;43:698-706.
- [CrossRef] [PubMed] [Google Scholar]
- Minimal hepatic encephalopathy runs a fluctuating course: Results from a three-year prospective cohort follow-up study. Singapore Med J. 2009;50:255-60.
- [Google Scholar]
- Characteristics of minimal hepatic encephalopathy. Metab Brain Dis. 2004;19:253-67.
- [CrossRef] [PubMed] [Google Scholar]
- Minimal hepatic encephalopathy: Diagnosis by neuropsychological and neurophysiologic methods. Indian J Gastroenterol. 2003;22(Suppl 2):S37-41.
- [Google Scholar]
- Minimal hepatic encephalopathy. Indian J Gastroenterol. 2009;28:5-16.
- [CrossRef] [PubMed] [Google Scholar]
- Lactulose improves cognitive functions and health-related quality of life in patients with cirrhosis who have minimal hepatic encephalopathy. Hepatology. 2007;45:549-59.
- [CrossRef] [PubMed] [Google Scholar]
- Is it medical error if we do not screen cirrhotic patients for minimal hepatic encephalopathy? Rev Esp Enferm Dig. 2002;94:544-57.
- [Google Scholar]
- Prevalence of minimal hepatic encephalopathy and quality of life in patients with decompensated cirrhosis. Hepatol Res. 2014;44:E92-9.
- [CrossRef] [PubMed] [Google Scholar]
- Prevalence and prognostic value of quantified electroencephalogram (EEG) alterations in cirrhotic patients. J Hepatol. 2001;35:37-45.
- [CrossRef] [PubMed] [Google Scholar]
- American Association for the Study of Liver Diseases Practice Guidelines: The role of transjugular intrahepatic portosystemic shunt creation in the management of portal hypertension. J Vasc Interv Radiol. 2005;16:615-29.
- [CrossRef] [PubMed] [Google Scholar]
- Fulminant hepatitis in atropical population: Clinical course, cause, and early predictors of outcome. Hepatology. 1996;23:1448-55.
- [CrossRef] [PubMed] [Google Scholar]
- The pathophysiology of brain edema in acute liver failure. Neurochem Int. 2005;47:71-7.
- [CrossRef] [PubMed] [Google Scholar]
- IL-6 and IL-18 in blood may discriminate cirrhotic patients with and without minimal hepatic encephalopathy. J Clin Gastroenterol. 2009;43:272-9.
- [CrossRef] [PubMed] [Google Scholar]
- Serum levels of tumor necrosis factor-alpha correlate with severity of hepatic encephalopathy due to chronic liver failure. Liver Int. 2004;24:110-6.
- [CrossRef] [PubMed] [Google Scholar]
- The neurosteroid system: Implication in the pathophysiology of hepatic encephalopathy. Neurochem Int. 2008;52:575-87.
- [CrossRef] [PubMed] [Google Scholar]
- Minimal hepatic encephalopathy in patients with extrahepatic portal vein obstruction. Am J Gastroenterol. 2008;103:1406-12.
- [CrossRef] [PubMed] [Google Scholar]
- Hepatic encephalopathy: Pathophysiology and emerging therapies. Med Clin North Am. 2009;93:819-36, vii
- [CrossRef] [PubMed] [Google Scholar]
- The role of infection and inflammation in the pathogenesis of hepatic encephalopathy and cerebral edema in acute liver failure. Nat Clin Pract Gastroenterol Hepatol. 2006;3:118-9.
- [CrossRef] [PubMed] [Google Scholar]
- Serum proinflammatory cytokines correlate with diffusion tensor imaging derived metrics and 1H-MR spectroscopy in patients with acute liver failure. Metab Brain Dis. 2010;25:355-61.
- [CrossRef] [PubMed] [Google Scholar]
- Measurement of cytotoxic and interstitial components of cerebral edema in acute hepatic failure by diffusion tensor imaging. J Magn Reson Imaging. 2008;28:334-41.
- [CrossRef] [PubMed] [Google Scholar]
- Encephalopathy assessment in children with extra-hepatic portal vein obstruction with MR, psychometry and critical flicker frequency. J Hepatol. 2010;52:348-54.
- [CrossRef] [PubMed] [Google Scholar]
- Long-term efficacy of lactulose in patients with subclinical hepatic encephalopathy. Zhonghua Nei Ke Za Zhi. 2003;42:261-3.
- [Google Scholar]
- Detection of minimal hepatic encephalopathy: Normalization and optimization of the Psychometric Hepatic Encephalopathy Score. A neuropsychological and quantified EEG study. J Hepatol. 2008;49:346-53.
- [CrossRef] [PubMed] [Google Scholar]
- Comparison of the most favoured methods for the diagnosis of hepatic encephalopathy in liver transplantation candidates. Gut. 2013;62:1497-504.
- [CrossRef] [PubMed] [Google Scholar]
- Two-dimensional MR spectroscopy of minimal hepatic encephalopathy and neuropsychological correlates in vivo. J Magn Reson Imaging. 2010;32:35-43.
- [CrossRef] [PubMed] [Google Scholar]
- Proton magnetic resonance spectroscopy (1H-MRS) findings for the brain in patients with liver cirrhosis reflect the hepatic functional reserve. Am J Gastroenterol. 1999;94:2206-13.
- [CrossRef] [PubMed] [Google Scholar]
- The pathophysiologic basis of hepatic encephalopathy: Central role for ammonia and inflammation. Cell Mol Life Sci. 2005;62:2295-304.
- [CrossRef] [PubMed] [Google Scholar]
- The development of low-grade cerebral edema in cirrhosis is supported by the evolution of (1)H-magnetic resonance abnormalities after liver transplantation. J Hepatol. 2001;35:598-604.
- [CrossRef] [PubMed] [Google Scholar]
- Metabolic changes of anterior cingulated cortex in patients with hepatic cirrhosis: A magnetic resonance spectroscopy study. Hepatol Res. 2010;40:777-85.
- [CrossRef] [PubMed] [Google Scholar]
- Hepatic encephalopathy: A central neuroinflammatory disorder? Hepatology. 2011;53:1372-6.
- [CrossRef] [PubMed] [Google Scholar]
- Minimal hepatic encephalopathy. Nat Clin Pract Gastroenterol Hepatol. 2007;4:677-85.
- [CrossRef] [PubMed] [Google Scholar]
- Minimal hepatic encephalopathy in children: Evaluation with proton MR spectroscopy. AJNR Am J Neuroradiol. 2009;30:1610-3.
- [CrossRef] [PubMed] [Google Scholar]


