
Translate this page into:
Hematocrit, platelets, and Hounsfield units: A case-control study in non-contrast computed tomography imaging of cerebral venous sinus thrombosis

*Corresponding author: Muhammad Yunus Amran, Division of Interventional Neurology and Neuroendovascular Therapy, Department of Neurology, Faculty of Medicine, Hasanuddin University, Makassar, Indonesia. muhyunusamran@med.unhas.ac.id
-
Received: ,
Accepted: ,
Abstract
Objectives:
Cerebral venous sinus thrombosis (CVST) is a rare but serious condition characterized by thrombosis in the cerebral veins and dural sinuses. This study aimed to evaluate the diagnostic accuracy and practicality of imaging modalities, emphasizing computed tomography (CT) scans for emergency use due to their speed, accessibility, and cost-effectiveness, compared to advanced techniques such as magnetic resonance venography (MRV), CT venography (CTV), and cerebral digital subtraction angiography (C-DSA).
Materials and Methods:
This analytical observational study used a retrospective case-control design, including a minimum sample size of 30 patients diagnosed with CVST. Diagnoses were confirmed through neuroimaging modalities such as MRV, CTV, or C-DSA at Wahidin Sudirohusodo General Hospital in Makassar. Data collection took place from August to December 2024, utilizing secondary data from patients treated between January 2022 and August 2024. Variables analyzed included hematocrit (Hct), platelet count (Plt), Hounsfield units (HU), and the HU/Hct ratio.
Results:
Thirty-five CVST patients (mean age: 40 ± 12.69 years) and 25 control subjects (mean age: 30.4 ± 15.07 years) were evaluated. Males represented 24% of CVST patients and 76% of control subjects, while females accounted for 65.1% and 34.9%, respectively (P = 0.558). There were no significant differences observed in Hct levels (CVST: 39.19 ± 4.36%, controls: 37.5 ± 5.37%, P = 0.188) or Plt levels (CVST: 304 ± 54.52 ×10⁹/L, controls: 290 ± 99.49 × 10⁹/L, P = 0.474). However, HU values were significantly higher among CVST patients (68.67 ± 8.05) compared to controls (42.79 ± 4.93, P = 0.001). Similarly, the HU/Hct ratio was significantly elevated in CVST patients (1.75 ± 1.15) compared to controls (1.15 ± 1.75, P = 0.001). At an HU cut-off value of 60.5, sensitivity and specificity were 82.4% and 100%, respectively (Youden index: 0.824). For the HU/Hct ratio (cut-off: 1.41), sensitivity and specificity were 91.2% and 94.1%, respectively (Youden index: 0.853).
Conclusion:
This study strongly supports the use of Hct and platelet levels, alongside HU values, for the effective estimation and diagnosis of CVST.
Keywords
Cerebral venous sinus thrombosis
Hematocrit
Hounsfield units
Platelet
Ratio Hounsfield unit/hematocrit

INTRODUCTION
Cerebral venous sinus thrombosis (CVST), characterized by thrombosis in the cerebral veins and dural sinuses, is a rare condition that can lead to significant morbidity and mortality. Signs and symptoms of CVST include headache, benign intracranial hypertension, subarachnoid hemorrhage, focal neurological deficits, seizures, unexplained changes in consciousness, and meningoencephalitis.[1]
The incidence of CVST during pregnancy, puerperium, and postpartum periods is approximately 12 cases/100,000 deliveries, comparable to the incidence of arterial stroke during these periods. CVST occurs three times more frequently in women than in men, likely due to gender-specific risk factors, including oral contraceptive use, pregnancy, postpartum status, and hormone replacement therapy. Young adult women are predominantly affected, with 70–80% of cases occurring in women of childbearing age; however, this gender predominance is not observed in children or elderly populations.[2]
CVST is a clinical diagnosis that requires confirmation through neuroimaging. Given the variability of symptoms and potentially conflicting clinical reports, a high degree of clinical suspicion is essential for diagnosing this unusual and potentially fatal condition. Computed tomography (CT) is often preferred in emergency settings due to its ease of use, cost-effectiveness, and rapid availability. However, the Hounsfield unit (HU) measurement alone is insufficient for diagnosing CVST on CT imaging. Since hematocrit (Hct) levels are known to influence thrombus development in CVST, the HU/Hct ratio typically provides greater diagnostic specificity.[3] This study aimed to evaluate the diagnostic value and practicality of imaging modalities using data collected from CVST patients. Special emphasis was placed on the expanded role of CT, highlighting its benefits in saving time and resources compared to advanced imaging techniques, which are more sensitive but less readily available. The variables assessed in this study included Hct, platelet count (Plt), HU, and the HU/Hct ratio.
MATERIALS AND METHODS
Study design
This study was conducted at Wahidin Sudirohusodo Hospital from August to December 2024, using an analytical observational design with a retrospective case-control approach. The study included a minimum of 30 participants, and all data were collected from secondary sources, specifically the medical records of patients treated at Wahidin Sudirohusodo Hospital between January 2022 and August 2024. This method allowed for the systematic evaluation of relevant clinical and diagnostic variables to fulfill the study objectives.
Sample criteria
The inclusion criteria for this study involved patients diagnosed with CVST confirmed by neuroimaging techniques, including magnetic resonance venography, CT venography, or cerebral digital subtraction angiography, at Wahidin Sudirohusodo General Hospital in Makassar. In addition, CVST patients who initially underwent a non-contrast head CT scan upon hospital admission were eligible for inclusion. The exclusion criteria included cases with incomplete medical records or imaging data; patients who presented with recent head trauma, intracranial hemorrhage, or skull fractures; and those with a prior history of cranial surgery. Patients diagnosed with severe anemia or essential thrombocytosis and individuals who had received contrast agents within the previous 3 days as part of other radiological procedures were also excluded to prevent potential diagnostic confounding.
For the control group, eligible participants consisted of patients who underwent non-contrast head CT imaging at the same facility during the study period but were not diagnosed with CVST or any related cerebral venous pathology. Exclusion criteria for the control group included incomplete clinical or radiological data, as this could interfere with the accuracy and validity of the comparative analyses.
Research procedures
The procedures for this study began with the collection of clinical and imaging data from all patients diagnosed with CVST at Wahidin Sudirohusodo General Hospital in Makassar. Following this initial step, a control group was randomly selected from patients treated at the same institution who underwent non-contrast head CT scans but did not have a CVST diagnosis. Both groups were rigorously screened according to pre-defined inclusion and exclusion criteria to ensure accurate selection and comparability. After identifying eligible participants, comprehensive patient information, including demographic details, clinical presentations, hematological parameters, and radiological findings, was systematically collected and recorded. The gathered data were meticulously reviewed and subjected to statistical analysis, enabling a thorough examination of the relationships among the studied variables and fulfilling the objectives outlined for this research.
Figure 1 shows a flowchart illustrating the study selection process and analysis of Hct, Plt counts, and HU in patients with CVST compared to control subjects.

- Flowchart illustrating the study selection process and analysis of hematocrit, platelet count, and Hounsfield units (HU) in patients with cerebral venous sinus thrombosis (CVST) compared to control subjects. Hct: Hematocrit, MRV: Magnetic resonance venography, CTV: Computed tomography venography, C-DSA: Cerebral digital subtraction angiography, ROC: Receiver operating characteristic.
Data and statistical analysis
The data obtained from the study were initially processed by evaluating their normality distribution using the Kolmogorov–Smirnov test, which was selected due to the sample size exceeding 30 participants. Statistical analyses were performed using the Statistical Package for the Social Sciences software, version 25.0, to determine the relationships and potential associations among the studied variables, with a P < 0.05 indicating statistical significance. Pearson’s correlation test was employed to evaluate relationships among variables exhibiting a normal data distribution, whereas Spearman’s correlation test was used for variables showing a non-normal distribution. Comparative analysis of numerical variables between the CVST patient group and the control group was conducted using the independent t-test, while categorical variables were analyzed using the Chi-square test. All statistical tests were chosen based on their appropriateness to accurately interpret and validate the differences or relationships within the collected data, thus ensuring robust and reliable research outcomes.
RESULTS
We performed a retrospective case-control study that evaluated the correlation between Hct and Plt levels and the association with the increased HU in non-contrast head CT scans of patients, who were diagnosed with CVST. Thirty-four CVST patients, meeting the inclusion criteria, were matched with control subjects (n = 34) without CVST or other related cerebral venous abnormalities, and who underwent non-contrast head CT scan at the same institution.
Descriptive statistical methods (mean, standard deviation, frequency distribution) were used to evaluate the data of both aforementioned groups. Kolmogorov–Smirnov test was used to ascertain the normality of the data. If the data were normally distributed, Pearson’s correlation test was used to examine the correlations among independent and dependent variables; otherwise, non-parametric tests were applied. The Independent t-test was used for comparative analyses of numerical variables between both groups and the comparison of categorical variables, the Chi-square test was performed. A P < 0.05 was considered statistically significant.
Table 1 details the frequency and percentage of clinical symptoms identified in the patients with CVST. The most common symptom was headache, which occurred in 84% of patients. In comparison, diminished awareness and seizure were the least common symptoms, seen in just 3% of patients.
| Clinical symptoms | n(%) |
|---|---|
| Headache | 28 (84) |
| Dizziness | 12 (35) |
| Seizures | 1 (3) |
| Vomiting | 6 (18) |
| Hemiparesis | 4 (12) |
| Decreased consciousness | 1 (3) |
| Diplopia | 2 (6) |
| Articulation disorder | 2 (6) |
Table 2 illustrates the distribution and percentage of the most common sites of thrombosis identified among patients diagnosed with CVST. The transverse sinus was found to be the most frequently affected site, observed in approximately CVST: Cerebral venous sinus thrombosis 44.1% of cases. In contrast, the internal cerebral vein and sigmoid sinus were the least commonly affected locations, each representing only 5.8% of cases. These findings highlight the variability in anatomical involvement in CVST, underscoring the importance of recognizing diverse thrombosis sites during clinical assessment and neuroimaging evaluations.
| Location | n (%) |
|---|---|
| Transverse sinus | 15 (44.1) |
| Superior sagittal sinus | 10 (29.4) |
| Straight sinus | 4 (11.7) |
| Internal cerebral vein | 2 (5.8) |
| Sigmoid sinus | 2 (5.8) |
CVST: Cerebral venous sinus thrombosis
Table 3 presents the data regarding the onset timing of clinical symptoms in patients diagnosed with CVST. The majority of patients (68%) experienced symptom onset within a period of 2–30 days, making this the most common interval observed among the 34 cases analyzed. This finding suggests that CVST symptoms typically develop gradually over days to weeks rather than appearing abruptly. Recognizing this time frame is crucial, as early identification of symptom progression within this period can significantly enhance timely diagnosis and treatment and potentially improve patient outcomes.
| Onset | n(%) |
|---|---|
| <2 days | 7 (20.6) |
| 2–30 days | 23 (68) |
| >30 days | 4 (11.4) |
CVST: Cerebral venous sinus thrombosis
Table 4 features the characteristics of the CVST patients and control subjects [Figure 2] . There were significant differences in the following parameters between the two groups. Results of age characteristics were statistically significant (P = 0.006), showing the notable difference in age distribution between CVST patients and controls. There is also significant variation in Hct values (P < 0.001). Likewise, the HU and HU/Hct ratio were significantly different (both P = 0.001, very strong statistical difference). In contrast, gender distribution and Plt counts between CVST patients and normal controls were not significantly different, with P = 0.558 and 0.474, respectively, indicating similar characteristics were present in these populations.
| Characteristic | CVST patients (n=34) | Control group (n=34) | P-value |
|---|---|---|---|
| Age (years) | 40±12.69 | 30.4±15.07 | 0.006* |
| Gender | 0.558** | ||
| Male | 6 (24) | 19 (76) | |
| Female | 28 (65.1) | 15 (34.9) | |
| Hct (%) | 39.19±4.36 | 37.5±5.37 | 0.188 |
| HU | 68.67±8.05 | 42.79±4.93 | 0.001* |
| HU/Hct | 1.75±1.15 | 1.15±1.75 | 0.001* |
| Plt (×109/L) | 304±54.52 | 290±99.49 | 0.474* |
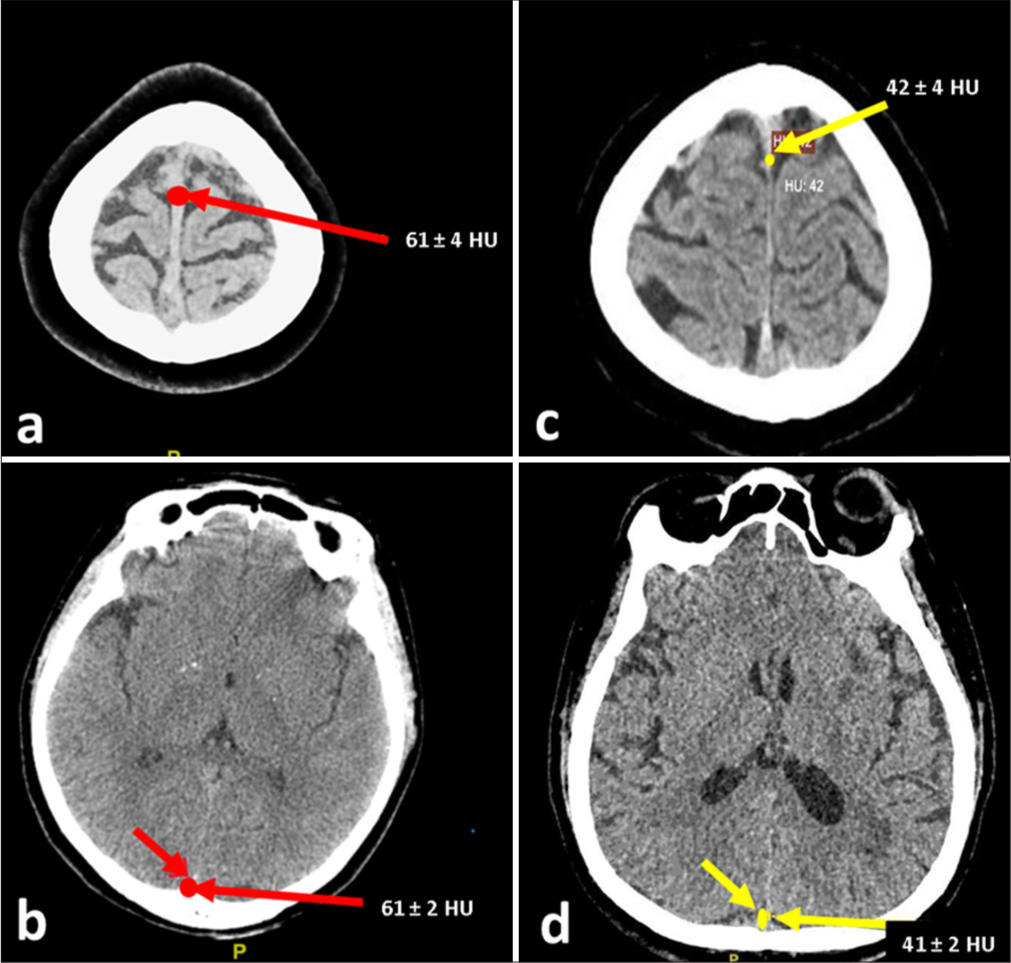
- Non-contrast computed tomography imaging in cerebral venous sinus thrombosis (CVST) patients and control subjects. (a) Hyperdense thrombosis in the superior sagittal sinus (SSS) (red arrow), measuring 61±4 HU. (b) Hyperdense thrombosis in the inferior sagittal sinus (ISS) (red arrow), measuring 61±2 HU. The hyperdensity indicates acute thrombus, characteristic of CVST. (c) Measurement of normal SSS density (yellow arrow) at 42±4 HU in a control subject. (d) Measurement of normal ISS density (yellow arrow) at 41±2 HU in a control subject. HU: Hounsfield units.
Figure 3 illustrates the receiver operating characteristic (ROC) curve for HU variables among patients diagnosed with CVST. The ROC model demonstrates excellent discriminative ability, reflected by an area under the curve (AUC) of 0.999, indicating an almost perfect predictive accuracy. Table 5 revealed the diagnostic performance of HU cut-off values for CVST diagnosis. Utilizing the Youden Index to identify the most effective threshold, the optimal cut-off value for HU in distinguishing CVST patients from non-CVST individuals was determined to be 60.5, corresponding to a Youden Index of 0.824. This high index indicates that the selected HU threshold offers substantial sensitivity and specificity, underscoring its potential utility in clinical decision-making for the diagnosis of CVST.
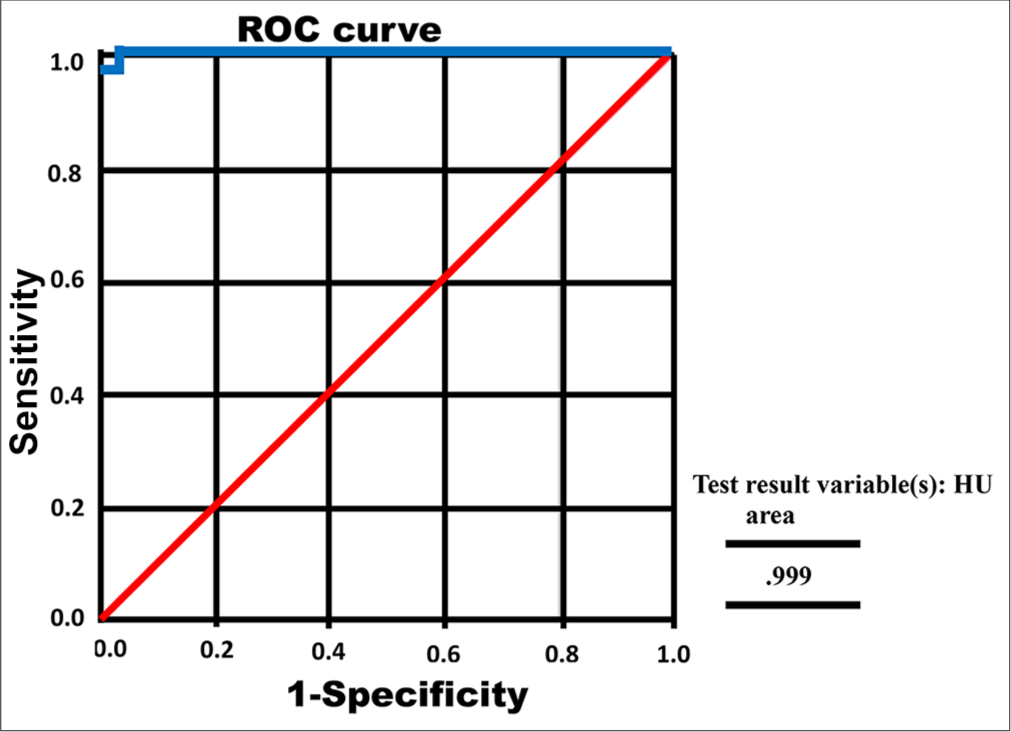
- Receiver operating characteristic (ROC) curve of Hounsfield unit (HU) of cerebral venous sinus thrombosis patients. Red line: The diagonal line of no discrimination, indicating random chance performance. Blue line: ROC curve of the model, showing its diagnostic performance.
| Variable | Cut-off value | Sensitivity (%) | Specificity (%) | Youden index |
|---|---|---|---|---|
| HU | ≥60.5 | 82.4 | 100 | 0.824 |
| ≥61.5 | 76.5 | 100 | 0.765 | |
| ≥62.5 | 73.5 | 100 | 0.735 |
The cut-off values for HU were determined through a case-control analysis for cerebral venous sinus thrombosis diagnosis. Sensitivity, specificity, and Youden index were calculated based on standard diagnostic test evaluation methods. The Youden index is a measure of the test’s overall performance, calculated as sensitivity+specificity−1. HU: Hounsfield unit
Based on Figure 4, the ROC curve analysis for the HU to HU/ Hct ratio in patients with CVST reveals a robust predictive model. The ROC model demonstrates excellent discriminative capability, highlighted by an AUC of 0.972, which signifies very strong accuracy in distinguishing CVST patients from non-CVST individuals. Table 6 revealed the diagnostic performance of HU/Hct cut-off values for CVST diagnosis. Utilizing the Youden Index, the optimal cut-off point for the HU/Hct ratio was identified as 1.41, corresponding to a notably high Youden Index of 0.853. This indicates an effective balance of sensitivity and specificity, highlighting the HU/Hct ratio as a valuable diagnostic parameter in clinical practice for identifying patients with CVST.
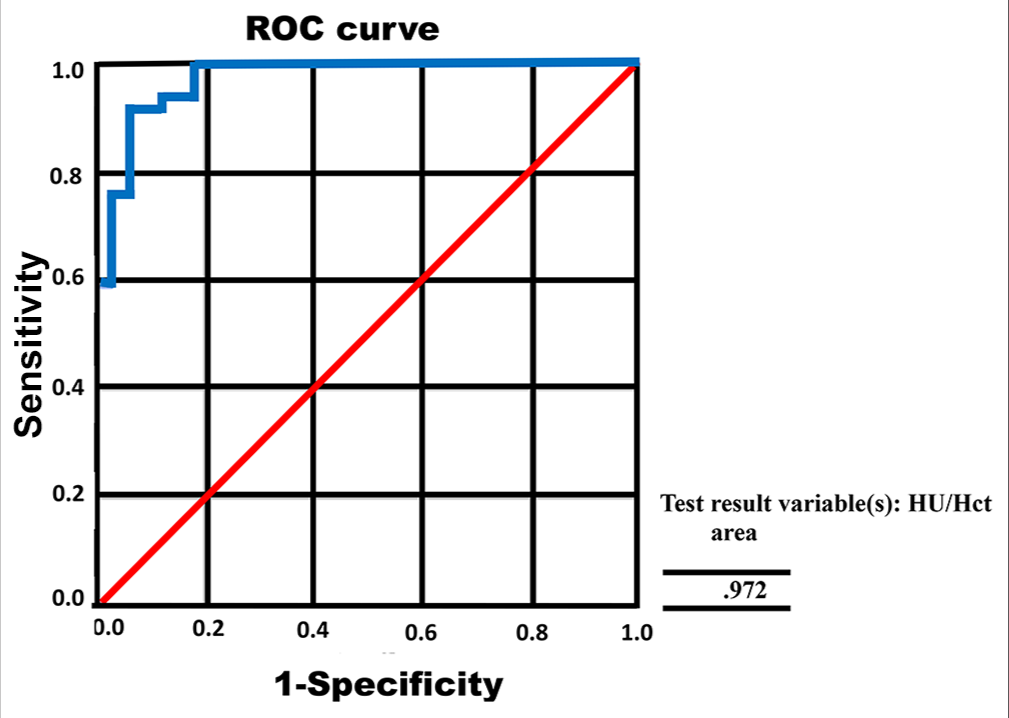
- Receiver operating characteristic (ROC) curve of the ratio of Hounsfield units (HU)/hematocrit cerebral venous sinus thrombosis patients. Red line: The diagonal line of no discrimination, indicating random chance performance. Blue line: ROC curve of the model, showing its diagnostic performance.
| Variable | Cut-off value | Sensitivity (%) | Specificity (%) | Youden index |
|---|---|---|---|---|
| HU/Hct | ≥1.34 | 94.1 | 82.5 | 0.765 |
| ≥1.41 | 91.2 | 94.1 | 0.853 | |
| ≥1.43 | 85.3 | 94.1 | 0.794 |
The cut-off values for the combined HU and Hct ratio (HU/Hct) were determined through a case-control analysis for cerebral venous sinus thrombosis diagnosis. Sensitivity, specificity, and Youden index were calculated based on standard diagnostic test evaluation methods. The Youden index is a measure of the test’s overall performance, calculated as sensitivity+specificity−1. HU: Hounsfield unit, Hct: Hematocrit
DISCUSSION
This study employs an analytical observational research methodology utilizing a retrospective case-control design. It was carried out between August and December 2024 at Wahidin Sudirohusodo General Hospital in Makassar. The primary aim of this research was to investigate the association between Hct levels, Plt counts, and neuroimaging findings, specifically assessing the increase in HU values on non-contrast head CT scans among patients diagnosed with CVST.
Conventionally, a hyperdense appearance of the dural venous sinus on CT imaging has been regarded as a key marker indicative of CVST. However, reliance solely on this qualitative imaging feature can occasionally result in false-negative diagnoses, as this hyperdense sign is not consistently observed in all CVST cases. Previous research conducted by Roland et al., Zaheer et al., and Linn et al. has highlighted the limitations of this approach, reporting sensitivities ranging from 63% to 73% for detecting hyperdense sinuses in patients with CVST through non-contrast brain CT scans. Furthermore, additional studies conducted by Zaheer et al. and Digge et al. have demonstrated that a quantitative evaluation of dural sinus attenuation potentially enhances the accuracy and reliability of detecting CVST on contrast-enhanced brain CT imaging.[4-7]
In the characteristics of the study sample, there were 6 men (17.65%) and 28 women (82.35%). These findings align with numerous epidemiological studies reported in the literature. Fleet et al. documented a similar gender ratio, finding a female-to-male ratio of approximately 3:1. It is hypothesized that various gender-specific risk factors contribute to this pattern, including pregnancy, the postpartum period, and oral contraceptive use. In addition, Mule et al. also observed that patients diagnosed with CVST were predominantly female, categorizing it as a classically female-prevalent disease in tropical regions.[8,9]
The age distribution among the study participants ranged from 18 years, the youngest patient, to 67 years, the oldest, with an average age of 40±12.70 years. This observation is supported by Rajendran et al., who reported that the majority of their study population was younger than 40 years, with an average age of approximately 31.2 years. Additional studies, such as the research conducted by Luo et al., similarly emphasized that CVST frequently affects younger adults, particularly women of childbearing age, predominantly within the age group of 30–41 years.[10,11]
The most common symptom identified among CVST patients in this study was headache, which occurred in 84% of cases. This result is consistent with previous findings from Khan et al., who reported that headache was typically the initial symptom reported by patients with CVST. Idiculla et al. further elaborated that the headache associated with CVST arises from increased intracranial pressure resulting from venous obstruction due to thrombus formation. This obstruction reduces venous drainage, consequently leading to increased intracranial pressure and brain volume, thereby inducing headache symptoms.[12,13]
In this study, the onset of symptoms in patients with CVST most frequently occurred within 2–30 days after onset. This observation aligns with findings by Furie et al., who reported that approximately 50% of CVST cases manifest symptoms within this timeframe, whereas approximately one-third of cases occur within <2 days, and only around 10% are present after more than 30 days from initial onset.[14]
Regarding thrombus localization, this study identified the transverse sinus as the most common site of thrombosis in CVST patients. This result corroborates findings reported by Khan et al. and Sidhom et al., who similarly observed that the transverse sinus is frequently implicated in thrombus formation in CVST cases. Nevertheless, other studies have generally reported the superior sagittal sinus as the most prevalent site for thrombus formation in CVST patients.[12,15]
Platelets play a critical role in relation to red blood cells and are actively involved in the thrombotic process. Therefore, this study specifically included Hct and Plt counts as additional parameters to explore their potential relationship with CVST.
The statistical analysis performed using the independent t-test to compare platelet levels between CVST patients and controls resulted in a P = 0.474. This indicates that there was no statistically significant difference in Plts between the two groups. This finding is consistent with research conducted by Nurmin et al. in 2023, which also found no significant correlation between Plts and thrombus formation in CVST. In addition, a study by Madineni et al. in 2023 evaluated platelet parameters such as platelet distribution width (PDW), mean platelet volume (MPV), and plateletcrit and observed that only severe CVST cases correlated positively with PDW, while MPV and plateletcrit did not demonstrate any significant relationship with CVST occurrence.[16,17]
The statistical analysis using the independent t-test to compare Hct levels between patients with CVST and control subjects yielded a P = 0.188. This indicates that while there is a correlation between hematocrit levels and CVST, the relationship is not statistically significant. This finding is consistent with research conducted by Yang et al. (2023), who similarly reported a positive yet statistically insignificant correlation between Hct levels and CVST occurrence. These results are further supported by studies conducted by Ratnaparkhi et al. and Shayganfar et al., who found no significant differences in Hct levels between CVST patients and control groups. Conversely, research by Walton et al. has suggested that Hct levels exceeding 45% may contribute to thrombus formation, thereby elevating the risk of CVST. In addition, Buyck et al. reported that elevated Hct values could lead to false-positive results in CVST diagnosis. Therefore, Ratnaparkhi et al. recommended incorporating the HU to Hct (HU/Hct) ratio as an additional parameter to enhance diagnostic accuracy and minimize potential false-positive interpretations.[3,18-21]
The results of this study demonstrated a statistically significant difference in the HU values between CVST patients and the control group, with a highly significant P = 0.001. However, according to Ratnaparkhi et al., HU measurements can be influenced by various factors, including dehydration, which may cause elevated radiodensity readings on CT scans. Consequently, the HU/Hct ratio becomes critically important to accurately differentiate genuine CVST cases from potential false-positive results due to such external factors, thereby reducing diagnostic uncertainty.[3]
In addition to calculating the HU value, another crucial quantitative assessment used in evaluating the dural venous sinus is the HU to Hct (HU/Hct) ratio. The findings of this study demonstrated a statistically significant difference in the HU/Hct ratio between patients diagnosed with CVST and the control group. This result aligns with research conducted by Buyck et al. ,[21] which similarly reported significant differences in the HU/Hct ratio between CVST patients and control subjects. Specifically, Buyck et al.’s[21] study involved 20 individuals in each group and consistently showed a higher HU/Hct ratio in CVST patients compared to controls. Additional research by Ratnaparkhi et al. and Shayganfar et al. further supports these findings, consistently highlighting significant variations in HU/Hct ratios between CVST and control groups.[3,19]
However, Ratnaparkhi et al. emphasized that a lower HU/ Hct ratio does not conclusively exclude a diagnosis of CVST. Various influential factors can affect dural venous sinus attenuation, including patient age, hydration status, duration and size of the sinus thrombus, and Hct levels. In line with this perspective, Akhavan et al. observed a negative correlation between the blood urea nitrogen/ creatinine ratio and the HU value, indicating that patient hydration significantly impacts the HU measurements in the dural venous sinus. Therefore, hydration levels must be carefully considered when interpreting CT imaging results.[3,22]
Regarding the limitations of this study, it is important to acknowledge the absence of serial CT scan data, which would have provided crucial evidence regarding thrombus degradation typically occurring between days 7 and 14 post-onset. In addition, potential confounding variables were not included in the analysis, which could have introduced biases and affected the reliability of the study results.
CONCLUSION
The findings of this study provide robust evidence underscoring the correlation between Hct levels, Plt counts, and the HU as diagnostic indicators for CVST. Through detailed analysis of the HU-to-Hct (HU/Hct) ratio obtained from CT scan results, a significant association was established. This relationship emphasizes the diagnostic value and clinical utility of these parameters in enhancing the accuracy, precision, and reliability of CVST assessments. By combining hematological data with advanced imaging markers, clinicians can achieve a more comprehensive evaluation, thereby improving diagnostic efficiency and clinical outcomes for patients suspected of having CVST.
Ethical approval:
The ethical approval is given by the Research Ethical Committee of Faculty of Medicine, Hasanuddin University with reference number 783/UN4.6.4.5.31/PP36/2024, dated September 25, 2024.
Declaration of patient consent:
The authors certify that they have obtained all appropriate patient consent.
Conflicts of interest:
There are no conflicts of interest.
Use of artificial intelligence (AI)-assisted technology for manuscript preparation:
The authors confirm that there was no use of artificial intelligence (AI)-assisted technology for assisting in the writing or editing of the manuscript and no images were manipulated using AI.
Financial support and sponsorship: Nil.
References
- Elevated factor VIII level associated with transverse cerebral venous sinus thrombosis. Am J Case Rep. 2019;20:274-7.
- [CrossRef] [PubMed] [Google Scholar]
- Cerebral venous thrombosis In: StatPearls. Treasure Island, FL: StatPearls Publishing; 2024. Available from: https://www.ncbi.nlm.nih.gov/books/nbk459315 [Last accessed on 2023 Jun 12]
- [Google Scholar]
- Diagnostic accuracy of Hounsfield unit value and Hounsfield unit to hematocrit ratio in predicting cerebral venous sinus thrombosis: A retrospective case-control study. Cureus. 2024;16:e57567.
- [CrossRef] [Google Scholar]
- Unenhanced brain CT is useful to decide on further imaging in suspected venous sinus thrombosis. Clin Radiol. 2010;65:34-9.
- [CrossRef] [PubMed] [Google Scholar]
- Quantitative non-contrast measurements improve diagnosing Dural venous sinus thrombosis. Neuroradiology. 2016;58:657-63.
- [CrossRef] [PubMed] [Google Scholar]
- Noncontrast CT in deep cerebral venous thrombosis and sinus thrombosis: Comparison of its diagnostic value for both entities. AJNR Am J Neuroradiol. 2009;30:728-35.
- [CrossRef] [PubMed] [Google Scholar]
- Plain CT vs MR venography in acute cerebral venous sinus thrombosis: Triumphant dark horse. Indian J Radiol Imaging. 2018;28:280-4.
- [CrossRef] [PubMed] [Google Scholar]
- Clinical profile, risk factors, and outcome of cerebral venous sinus thrombosis at tertiary care centre. NeuroQuantology. 2022;20:1649-55.
- [Google Scholar]
- Clinical and etiological profile of cerebral venous sinus thrombosis. Int J Contemp Med Res. 2020;7:A1-4.
- [CrossRef] [Google Scholar]
- Diagnosis and treatment of cerebral venous thrombosis: A review. Front Aging Neurosci. 2018;10:2.
- [CrossRef] [PubMed] [Google Scholar]
- Clinical profile and prognosis of cerebral venous sinus thrombosis. Cureus. 2020;12:e12221.
- [CrossRef] [Google Scholar]
- Cerebral venous thrombosis: A comprehensive review. Eur Neurol. 2020;83:369-79.
- [CrossRef] [PubMed] [Google Scholar]
- American heart association/American stroke association stroke council leadership. Diagnosis and management of cerebral venous sinus thrombosis with vaccine-induced immune thrombotic thrombocytopenia. Stroke. 2021;52:2478-82.
- [CrossRef] [PubMed] [Google Scholar]
- Cerebral venous thrombosis: Clinical features, risk factors, and long-term outcome in a Tunisian cohort. J Stroke Cerebrovasc Dis. 2014;23:1291-5.
- [CrossRef] [PubMed] [Google Scholar]
- Correlation between P-selection level and platelet aggregation in cerebral venous sinus thrombosis patients. Maj Kedokteran Bandung. 2023;55:191-6.
- [CrossRef] [Google Scholar]
- A study of the prognostic significance of platelet distribution width, mean platelet volume, and plateletcrit in cerebral venous sinus thrombosis. J Neurosci Rural Pract. 2023;14:418-23.
- [CrossRef] [PubMed] [Google Scholar]
- Clinical features of patients with cerebral venous sinus thrombosis at plateau areas. Brain Behav. 2023;13:e2998.
- [CrossRef] [PubMed] [Google Scholar]
- Are cerebral veins hounsfield unit and H:H ratio calculating in unenhanced CT eligible to diagnosis of acute cerebral vein thrombosis? J Res Med Sci. 2019;24:83.
- [CrossRef] [PubMed] [Google Scholar]
- Elevated hematocrit enhances platelet accumulation following vascular injury. Blood. 2017;129:2537-46.
- [CrossRef] [PubMed] [Google Scholar]
- CT density measurement and H:H ratio are useful in diagnosing acute cerebral venous sinus thrombosis. AJNR Am J Neuroradiol. 2013;34:1568-72.
- [CrossRef] [PubMed] [Google Scholar]
- Factors affecting Dural sinus density in non-contrast computed tomography of brain. Sci Rep. 2019;9:12016.
- [CrossRef] [PubMed] [Google Scholar]


