
Translate this page into:
A study of the prognostic significance of platelet distribution width, mean platelet volume, and plateletcrit in cerebral venous sinus thrombosis
-
Received: ,
Accepted: ,
How to cite this article: Madineni KU, Naveen Prasad SV, Bhuma V. A study of the prognostic significance of platelet distribution width, mean platelet volume, and plateletcrit in cerebral venous sinus thrombosis. J Neurosci Rural Pract 2023;14:418-23.
Abstract
Objectives:
Platelets play a key role in thrombus formation and propagation and are thus implicated in the pathogenesis and morbidity of cerebral venous sinus thrombosis (CVST). A whole blood count can be used to objectively measure platelet function through platelet indices, namely, platelet distribution width (PDW), mean platelet volume (MPV), and plateletcrit. This study examined how platelet indices (PDW,MPV, and plateletcrit) affect the CVST severity and functional outcome.
Materials and Methods:
In this prospective, longitudinal, and observational study, 66 patients with CVST from a tertiary care referral center were enrolled. A complete blood count including platelet indices was obtained using an automated hematology analyzer. Patients with and without parenchymal abnormalities on brain imaging were classified as having severe and non-severe CVST, respectively. The modified Rankin Scale (mRS) was used to examine functional outcomes at admission and after 90 days. The patients were categorized into low mRS (0–1) and high mRS (2–6) functional groups.
Results:
The patients with severe CVST were older (P < 0.05) and exhibited abnormally large PDW (P < 0.05) which were statistically significant. Severe CSVT also had poor functional outcome score both at admission (P < 0.05) and 90 days later (P < 0.05) which were statistically significant. Multiple logistic regression analysis concluded age and PDW as the independent predictors of severe CVST (P < 0.05). In receiver operating characteristic curve analysis, a cutoff value of 16.5 for PDW could predict CVST severity (P < 0.05). Patients with high mRS scores at admission had significantly larger PDW. At 90 days, no association was noted between PDW and mRS scores. MPV and plateletcrit levels were similar in both the severe and non-severe CVST groups and exerted no effect on functional outcomes. PDW was significantly and inversely related to plateletcrit (P < 0.05).
Conclusion:
Severe CVST and PDW had a positive correlation. During the early phases of admission, PDW levels above a particular threshold were associated with poor functional outcomes; however, no such association was observed after 90 days. MPV and plateletcrit exerted no effect on CVST severity and prognosis.
Keywords
Cerebral venous sinus thrombosis
Functional outcome
Magnetic resonance venography
Mean platelet volume
Platelet distribution width
plateletcrit

INTRODUCTION
Cerebral venous sinus thrombosis (CVST) can cause considerable cerebrovascular damage including hemorrhagic stroke.[1] CVST affects approximately 3–4 individuals per million population in India annually. Furthermore, CVST is responsible for 10–20% of causes of cerebrovascular accidents among young people.[2] CVST is 3 times more common in women than in men, and the risk is particularly higher during pregnancy and while using oral contraceptives.[3] CVST has numerous risk factors, with each having a different odds ratio. Headache is the most common presentation of CVST.[4-6] Magnetic resonance imaging (MRI) of the brain can accurately diagnose CVST.[7]
Platelets, which are vital in the formation and propagation of thrombus, are involved in the etiopathogenesis of and morbidity in CVST.[8] Platelet function can be examined using a total blood count analyzer, which provides the values of platelet indices, namely, platelet distribution width (PDW), mean platelet volume (MPV), and plateletcrit. MPV is a simple and accurate marker of the platelet activation and function.[9] PDW indicates size variation range of platelets. It is thus a precise indicator of their activation.[10] Plateletcrit refers to the total platelet mass and is beneficial for identifying platelet-related quantitative disorders.[11]
Platelet indices may be predictive and prognostic in a wide range of conditions.[12] PDW levels are higher in disease conditions such as myeloproliferative disorders, ischemic heart disease, and CVST.[13-16] Myocardial infarction, venous thromboembolism, poor coronary collaterals, and pulmonary embolism have been linked to increased MPV.[17-19] Plateletcrit has been examined in central retinal vein occlusion[20] and venous thromboembolism.[21] A higher plateletcrit value indicates a higher risk. Thus far, a Turkish study investigated the effects of platelet indices on CVST severity.[19] There is not enough research on this subject. This study investigated the effects of platelet indices (PDW, MPV, and plateletcrit) on CVST severity and functional outcomes.
MATERIALS AND METHODS
Participants
In this single-center, prospective, longitudinal, and observational study, 66 consecutive patients with CVST aged >18 years who were willing to participate were recruited. Patients receiving antiplatelet drugs were excluded from the study. Patients were enrolled from May 2018 to September 2019 from the outpatient and inpatient departments of a tertiary care referral center in Andhra Pradesh. The ethics committee at the university (SVIMS) has approved the study. Participants in the study provided informed consent. A complete medical history, as well as a comprehensive physical and neurological examination, was taken.
Definitions
Anemia is defined as the presence of a hemoglobin concentration of <13 g/dL in men, <12 g/dL in non-pregnant women, and <11 g/dL in pregnant women. Hyperhomocysteinemia refers to a serum homocysteine level of >15 µmol/L. Polycythemia refers to a hemoglobin level of >18.5 g/dL in men and >16.5 g/dL in women. The fifth edition of Diagnostic and Statistical Manual of mental disorders (DSM-5), “criteria for alcohol use disorder,” was adopted to establish its diagnosis. Binge drinking was diagnosed when individuals consumed approximately five and four standard drinks, respectively, within 2 h. A standard drink is considered to contain 14 g of alcohol.[22]
Radiological and laboratory analysis
Plain computed tomography (CT), MRI brain plain, and MR venography (MRV) brain were performed in all the patients. Imaging findings were used to confirm the clinical diagnosis. Before obtaining samples, adequate hydration of the patients was ensured. PDW, MPV, and plateletcrit were measured using the Auto Hematology Analyzer, Mindray BC-5300 series, Shenzhen Mindray biomedical electronics, China.[23] In addition, serum homocysteine levels were measured. After 48 h, a second blood sample was collected to confirm laboratory results. If the first and second test results differed significantly, then a third sample was examined to minimize laboratory errors.
Severity classification and outcome analysis
CVST severity was determined on the basis of alterations in MRI brain parenchymal signals. Patients with brain parenchymal signal abnormalities, which were determined as an altered intensity of signal change, were diagnosed as having severe CVST. Patients without brain parenchymal signal changes with or without cerebral edema were diagnosed as having non-severe CVST. The modified Rankin Scale (mRS) was used to examine functional outcomes, and the patients were categorized into “low mRS” (0–1) and “high mRS” (2–6) groups at admission and 90 days.[24]
Statistical analysis
Data were obtained from printed case record forms and entered into Microsoft Excel spreadsheets. Because data were normally distributed, parametric tests were conducted. Means and standard deviations are used to represent quantitative variables. Frequencies as percentages are used to represent qualitative variables. To examine qualitative and quantitative variables, the Chi-square test and independent Student’s t-test were used. Multiple logistic regression analysis was used to find the independent predictors of severe CVST. In a multiple logistic regression analysis model, predictors having statistical significance (P < 0.05) in univariate analysis were evaluated, and their relative odds ratios with 95% confidence intervals were determined. The ability of PDW to predict CVST severity was examined by analyzing receiver operating characteristic (ROC) curve. P < 0.05 indicated statistical significance. All statistical analyses were performed using SPSS version 25.0 and MedCalc Software.
RESULTS
Sixty-six patients (45 males and 21 females) recruited to this study. The mean age of the study participants was 35.2 ± 24.6 years. Alcohol use disorder (n = 32), hyperhomocysteinemia (n = 27), anemia (n = 15), polycythemia (n = 10), oral contraceptive pill use (n = 5), and puerperium (n = 4) were the main risk factors. All the patients with alcohol consumption disorder binge drank within 1–3 days of symptom onset. The most frequent risk factors among the men were hyperhomocysteinemia and after that alcohol use disorder. Hyperhomocysteinemia was significantly associated with alcohol use disorder in the men. Hence, hyperhomocysteinemia was not identified as a distinct risk factor. Polycythemia was the next frequent risk factor among the men. The most frequent risk factors among the women were iron deficiency anemia and after that oral contraceptive usage. All the participants had increased intracranial pressure. Seizures and focal neurological deficits were noted in 59% and 29% of the participants, respectively. Furthermore, 16 and 11 patients had high mRS scores (2–6) during admission and after 90 days, respectively. Two-thirds of the patients exhibited abnormal brain CT findings, and all of them had abnormal MRV brain findings. Superior sagittal sinus, sigmoid sinus, left transverse sinus, and right transverse were thrombosed in 76%, 38%, 26%, and 9% of study participants, respectively. In 47% of the participants, more than one sinus had been thrombosed [Figures 1 and 2].
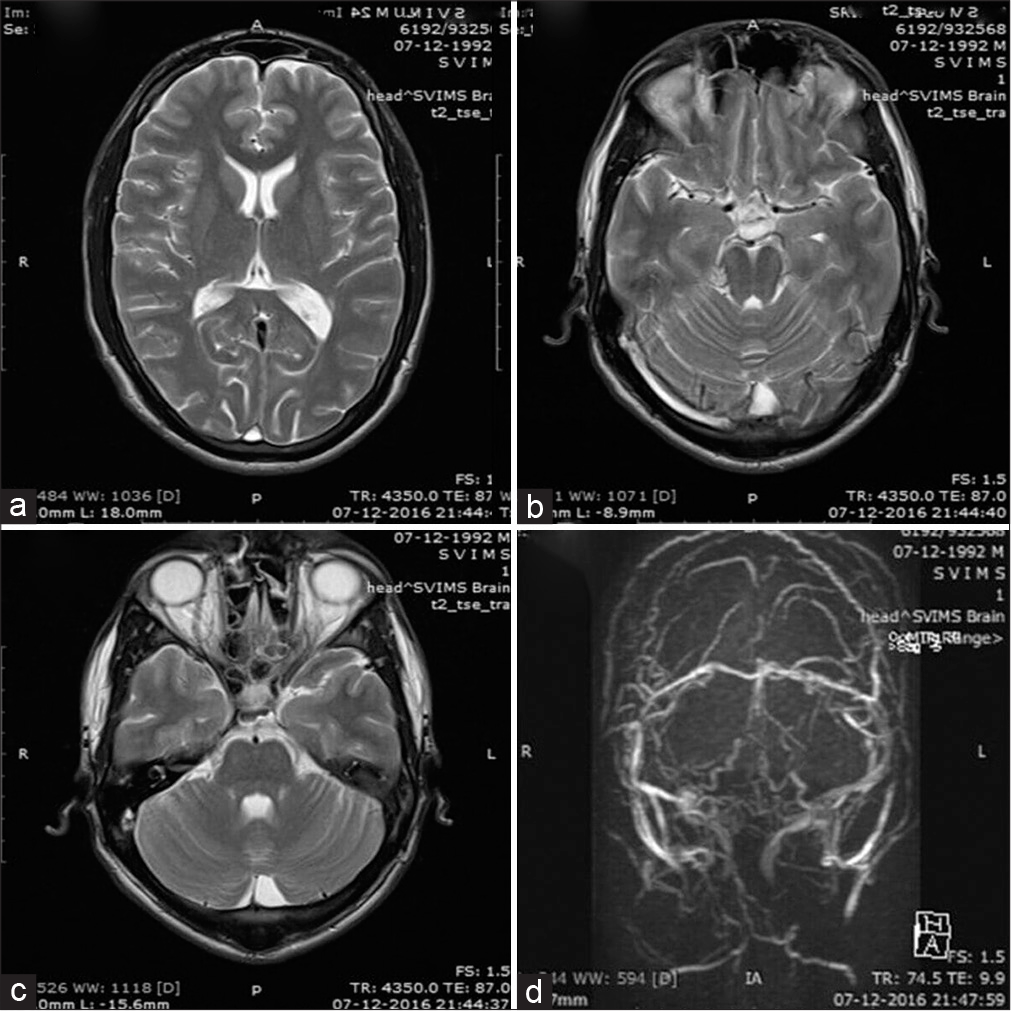
- (a) Magnetic resonance imaging brain T2 sequence showing hyperintensities in the superior sagittal sinus, (b) right transverse sinus, (c) and right sigmoid sinus. (d) In the MR venogram brain, superior sagittal sinus is not visible, transverse and the sigmoid sinuses are narrowed bilaterally with several collaterals.
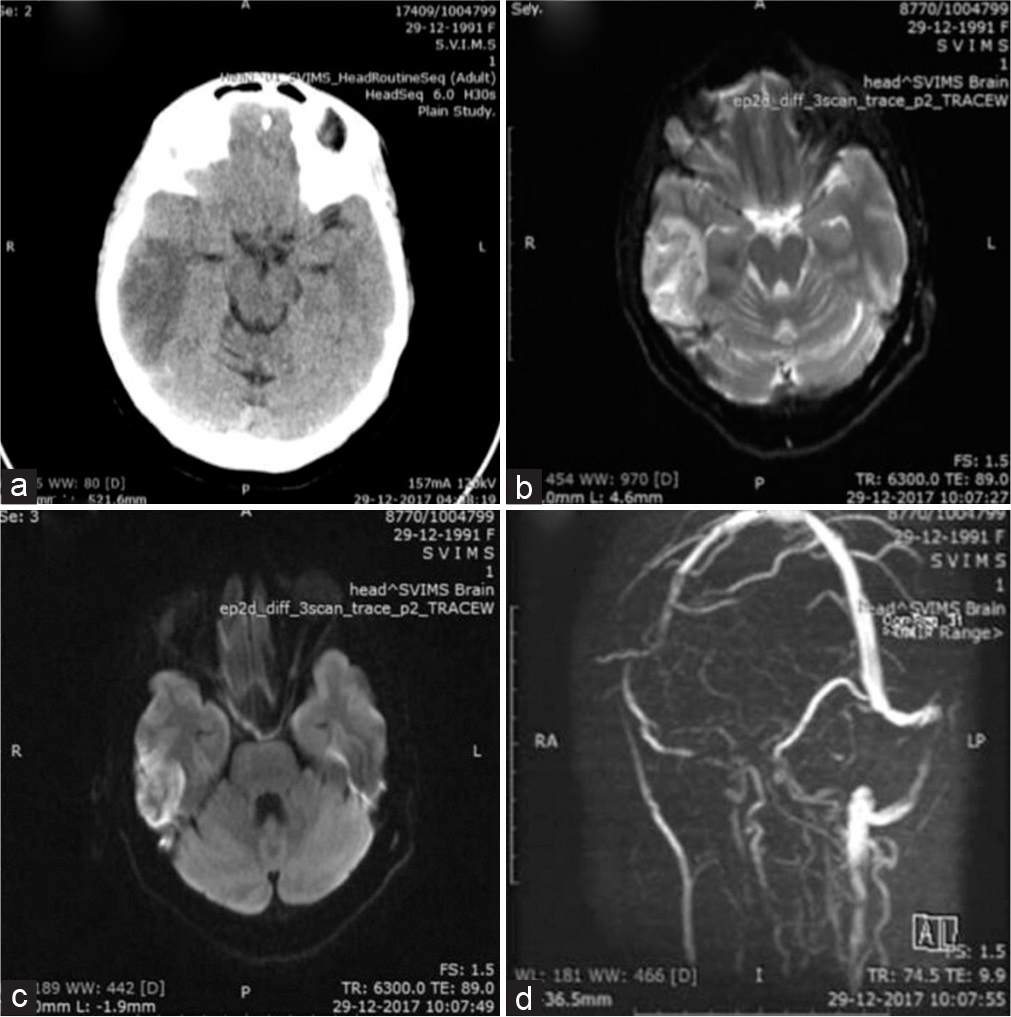
- (a) Computed tomography brain showing the right temporal lobe hypodensity. (b) Magnetic resonance imaging (MRI) brain T2 sequence showing the right temporal lobe hyperintensity. (c) MRI brain DWI sequence showing the right temporal lobe hyperintensity along with loss of flow void and thrombosis of the right sigmoid sinus. (d) In the MR venogram brain, right sigmoid, and the internal jugular veins are not visualized. DWI indicates diffusion-weighted imaging.
We compared the patients’ platelet indices with their standard laboratory values [Table 1]. Their MPV values were within normal ranges. However, PDW and plateletcrit values were at the upper end of the normal limit.
| Parameter | Mean±Standard deviation | Standard laboratory normal range |
|---|---|---|
| MPV (femtoliters) | 8.4±1.0 | 6.5–12 |
| PDW | 16.2±0.9 | 9–17 |
| Plateletcrit (%) | 0.24±0.11 | 0.10–0.28 |
Severe CVST and non-severe CVST were diagnosed in 33 patients in each group, respectively. The patients’ age and sex were similar in both the groups [Table 2]. The PDW is higher in severe CVST patients than in non-severe CVST patients, and this difference is statistically significant [P = 0.038; Table 2 and Figure 3]. Other variables, namely, old age (P < 0.05), high mRS scores at admission (P < 0.05), and high mRS scores at 90 days (P < 0.05), were significant. No correlation was noted between CVST severity and risk factors [Table 2].
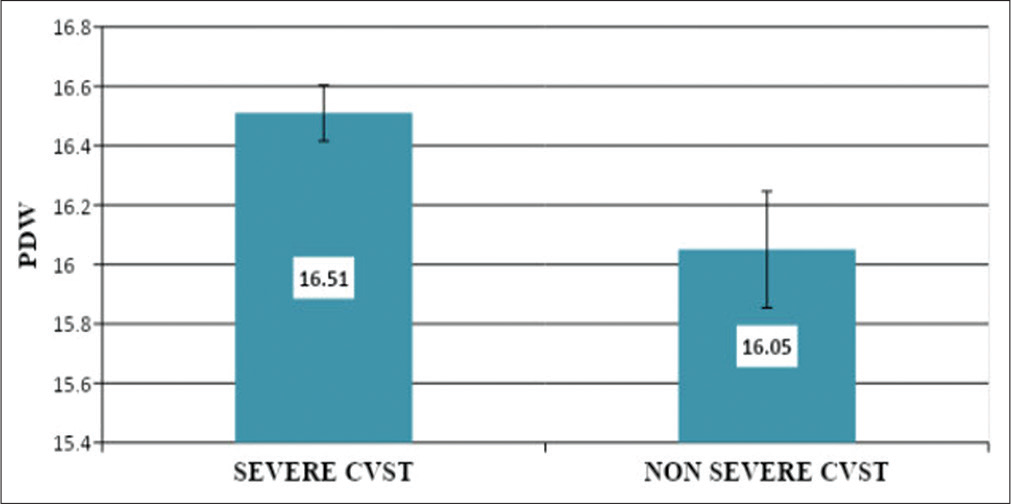
- Comparison of platelet distribution width values between “severe cerebral venous sinus thrombosis (CVST)” and “non-severe CVST” categories. PDW indicates platelet distribution width; CVST, cerebral venous sinus thrombosis.
| Variable | Severe (CVST) | Non severe CVST (n=33) | P-value |
|---|---|---|---|
| Age (mean±SD) | 39.45±15.95 | 31.00±1.80 | 0.017 |
| Hemoglobin-gm/dl (mean±SD) | 12.41±0.01 | 13.49±3.10 | 0.226 |
| MPV-fl (mean±SD) | 8.35±0.91 | 8.41±1.15 | 0.814 |
| PDW (mean±SD) | 16.05±1.12 | 16.51±0.56 | 0.038 |
| Plateletcrit % (mean±SD) | 0.24±0.09 | 0.24±0.11 | 0.728 |
| Male gender (n) | 63 | 69 | 0.311 |
| Alcohol intake (n) | 17 | 15 | 0.622 |
| Hyperhomocysteinemia (n) | 15 | 12 | 0.452 |
| Anemia (n) | 9 | 6 | 0.378 |
| Polycythemia (n) | 6 | 4 | 0.492 |
| Oral contraceptive usage (n) | 3 | 2 | 0.641 |
| Puerperium (n) | 3 | 1 | 0.302 |
| High mRS at admission (2–6), (n) | 16 | 0 | <0.0001 |
| High mRS at 90 days (2–6), (n) | 11 | 0 | <0.0001 |
CVST: Cerebral venous sinus thrombosis, SD: Standard deviation, MPV: Mean platelet volume, PDW: Platelet distribution width, mRS: Modified Rankin scale, n: number of patients
Multiple logistic regressions analyzed older age and larger PDW (P < 0.05) as the independent predictors of severe CVST [Table 3]. There was no significant difference in MPV or plateletcrit between the severe and non-severe CVST groups. A comparison of PDW with clinical and laboratory parameters indicated that increased PDW (>17) was associated with high mRS scores at admission (P < 0.05). High PDW values were significantly and inversely related to plateletcrit levels (P < 0.05; Table 4). Among the platelet indices, PDW exhibited a significant association with higher mRS scores at admission (P < 0.05). However, at 90 days, no effect of platelet indices on mRS scores was observed [Table 5]. In ROC analysis, a cutoff value of 16.5 for PDW could predict CVST severity with 45% sensitivity and 79% specificity (Area under ROC curve [AUC] = 0.649, 95% Confidence interval [CI] = 0.516–0.782, P = 0.037) [Figure 4].
| Variables | Odds-ratio | 95% CI | P-value |
|---|---|---|---|
| Age | 1.053 | 1.002–1.105 | 0.038 |
| PDW | 3.366 | 1.007–11.32 | 0.049 |
| mRS at 90 days | 6082 | 0.000 | 0.998 |
CVST: Cerebral venous sinus thrombosis, CI: Confidence interval, PDW: Platelet distribution width, mRS: Modified Rankin scale
| Variables | Normal PDW (9–17), (n=62) | Elevated PDW (>17) (n=4) | P-value |
|---|---|---|---|
| Age in years (mean±SD) | 35.22±14.56 | 36.5±23.69 | 0.916 |
| Hemoglobin-gm/dl (mean±SD) | 12.95±3.60 | 13.52±3.96 | 0.783 |
| MPV-fl (mean±D) | 8.38±1.03 | 9.42±0.89 | 0.037 |
| Plateletcrit % (mean±SD) | 0.24±0.10 | 0.13±0.08 | 0.023 |
| Male gender (n) | 42 | 3 | 0.762 |
| Severe CVST (n) | 30 | 3 | 0.302 |
| Alcohol intake (n) | 29 | 3 | 0.273 |
| Anemia (n) | 14 | 1 | 0.910 |
| Hyperhomocysteinemia (n) | 25 | 2 | 0.702 |
| Polycythemia (n) | 9 | 1 | 0.490 |
| Oral contraceptive usage (n) | 4 | 1 | 0.213 |
| Puerperium (n) | 3 | 1 | 0.226 |
| High mRS at admission (2–6), (n) | 13 | 3 | 0.014 |
| High mRS at 90 days (2–6), (n) | 9 | 2 | 0.064 |
CVST: Cerebral venous sinus thrombosis, SD: Standard deviation, MPV: Mean platelet volume, PDW: Platelet distribution width, mRS: Modified Rankin scale, fl: Femtoliters, n: Number of patients
| Variable | High mRS at admission (2–6) (n=16) | High mRS at 90 days (2–6) (n=11) | ||
|---|---|---|---|---|
| (mean±SD) | P-value | (mean±SD) | P-value | |
| Age | 8.20±0.14 | 0.477 | 8.1±1.16 | 0.381 |
| PDW | 16.66±0.93 | 0.012 | 16.64±0.57 | 0.056 |
| mRS at 90 days | 0.23±0.10 | 0.540 | 0.2±0.07 | 0.058 |
PDW: Platelet distribution width, mRS: Modified Rankin scale, n: Number of patients

- A receiver operating characteristic curve showing platelet distribution width as a predictor of severity of cerebral venous sinus thrombosis.
DISCUSSION
The average age of the study participants is in accordance to that reported in a comprehensive series published by Nizam institute’s cerebral venous stroke register located in Hyderabad, India.[25] A previous study conducted in India reported that CVST was more frequently observed in women.[26] This study’s male predominance is consistent with the findings of a recent Indian study.[27] Improvements in women’s healthcare during the puerperium may be caused by this shift in sex predominance. Increasing alcohol abuse may be responsible for the increased frequency of CVST in men.
This study’s findings agree with those of a previous Turkish study on the effects of platelet indices (PDW and MPV) on CVST severity.[18] PDW significantly differed between CVST cases and controls (P = 0.003). In addition, MPV did not differ significantly between the CVST case and control groups (P = 0.3). Alcohol use disorder did not affect mean MPV values in 40% of the patients. Moreover, age, sex, alcohol usage, smoking, and obesity did not affect MPV values.
The results of this study demonstrated no link between CVST severity and its risk factors; this finding is in accordance to that of another Indian study.[28] No effect of risk factors on clinical parameters, imaging results, and outcomes was noted. Old age, mechanical ventilation requirement, and Glasgow Coma Scale scores were identified as the independent predictors of poor clinical outcomes.[29]
Anemia (P < 0.05) and hyperhomocysteinemia (P < 0.05) risk factors demonstrated a statistically significant association with plateletcrit levels [Table 6 in supplementary material]. Furthermore, no association was observed between MPV and PDW levels and risk factors for CVST. This study recruited patients from only one academic institution. Hence, multicenter studies should be performed to validate our findings.
| Risk factor | Yes/No | Total (n=66) | Plateletcrit | p-value |
|---|---|---|---|---|
| Alcoholism | Yes No |
32 34 |
0.23±0.12 0.25±0.10 |
0.441 |
| Anemia | Yes No |
15 51 |
0.31±1.34 0.22±0.10 |
0.007 |
| Puerperium | Yes No |
05 61 |
0.25±0.69 024±0.11 |
0.842 |
| Oral contraceptive use | Yes No |
04 62 |
0.25±0.29 024±0.07 |
0.899 |
| Polycythemia | Yes No |
10 56 |
0.19±0.68 0.25±0.12 |
0.185 |
| Hyperhomocysteinemia | Yes No |
27 39 |
0.20±0.75 0.27±0.13 |
0.03 |
CVST, cerebral venous sinus thrombosis; n, number of patients
CONCLUSION
CVST is a serious neurological condition with a potential for delayed diagnosis because of its diverse presentation. Early intervention can significantly improve the outcome in affected individuals. Platelet distribution width is a platelet index that is associated with severe CVST. Large randomized control studies determining the relationship between platelet indices and CVST outcomes are warranted. The findings can facilitate the identification of patients who might benefit from endovascular therapy.
Declaration of patient consent
The authors certify that they have obtained all appropriate patient consent.
Conflicts of interest
There are no conflicts of interest.
Financial support and sponsorship
Nil.
References
- Management of dural venous sinus thrombosis in pregnancy. EJVES Extra. 2014;27:e41-2.
- [CrossRef] [Google Scholar]
- Decompressive surgery for severe cerebral venous sinus thrombosis. Neurol India. 2010;58:392-7.
- [CrossRef] [PubMed] [Google Scholar]
- Cerebral venous thrombosis-A primer for the haematologist. Blood Rev. 2015;29:45-50.
- [CrossRef] [PubMed] [Google Scholar]
- Pathophysiological aspects of cerebral venous sinus thrombosis. J Neuroradiol. 1994;21:72-80.
- [Google Scholar]
- Cerebral venous thrombosis-a review of 38 cases. Stroke. 1985;16:199-213.
- [CrossRef] [PubMed] [Google Scholar]
- Blood platelet count and function are related to total and cardiovascular death in apparently healthy men. Circulation. 1991;84:613-7.
- [CrossRef] [PubMed] [Google Scholar]
- Platelet activation: Assessment and quantification. Eur Heart J. 2001;22:1561-71.
- [CrossRef] [PubMed] [Google Scholar]
- Elevation of endothelial microparticles, platelets, and leukocyte activation in patients with venous thromboembolism. J Am Coll Cardiol. 2005;45:1467-71.
- [CrossRef] [PubMed] [Google Scholar]
- Platelet size: Measurement, physiology, and vascular disease. Blood Coagul Fibrinolysis. 1996;7:157-61.
- [CrossRef] [Google Scholar]
- Platelet distribution width: A simple, practical and specific marker of activation of coagulation. Hippokratia. 2010;14:28-32.
- [Google Scholar]
- Platelet volume indices in patients with coronary artery disease and acute myocardial infarction: An Indian scenario. J Clin Pathol. 2006;59:146-9.
- [CrossRef] [PubMed] [Google Scholar]
- The prognostic value of an increased mean platelet volume and platelet distribution width in the early phase of cerebral venous sinus thrombosis. Clin Appl Thromb Hemost. 2013;19:29-32.
- [CrossRef] [PubMed] [Google Scholar]
- Platelet distribution width for differential diagnosis of thrombocytosis. Clin Chem. 1997;43:1072-6.
- [CrossRef] [PubMed] [Google Scholar]
- Mean platelet volume as a predictor of cardiovascular risk: A systematic review and meta-analysis. J Thromb Haemost. 2010;8:148-56.
- [CrossRef] [PubMed] [Google Scholar]
- Mean platelet volume is a risk factor for venous thromboembolism: The Tromso study, Tromso, Norway. J Thromb Haemost. 2010;8:157-62.
- [CrossRef] [PubMed] [Google Scholar]
- Hematological parameters and coronary collateral circulation in patients with stable coronary artery disease. Exp Clin Cardiol. 2013;18:e12-5.
- [Google Scholar]
- Diagnostic value of platelet indexes for pulmonary embolism. Am J Emerg Med. 2015;33:760-3.
- [CrossRef] [PubMed] [Google Scholar]
- Plateletcrit as a screening tool for detection of platelet quantitative disorders. J Hematol. 2013;2:22-6.
- [CrossRef] [Google Scholar]
- Characteristics of platelet indices and their prognostic significance in selected medical condition-a systematic review. Adv Med Sci. 2020;65:310-5.
- [CrossRef] [PubMed] [Google Scholar]
- Helping Patients who Drink too Much. A Clinician's Guide. NIH Publication no. 5-3769 Bethesda, MD: National Institute on Alcohol Abuse and Alcoholism; 2005.
- [Google Scholar]
- BC-5300. Available from: https://www.mindray.com/en/product/BC-5300.html [Last accessed on 2021 Apr 02]
- [Google Scholar]
- Interobserver agreement for the assessment of handicap in stroke patients. Stroke. 1988;19:604-7.
- [CrossRef] [PubMed] [Google Scholar]
- Risk factors, clinical profile, and long-term outcome of 428 patients of cerebral sinus venous thrombosis: Insights from Nizam's institute venous stroke registry, Hyderabad (India) Neurol India. 2012;60:154-9.
- [CrossRef] [PubMed] [Google Scholar]
- The incidence of cerebral venous thrombosis: A cross-sectional study. Stroke. 2012;43:3375-7.
- [CrossRef] [Google Scholar]
- Mean platelet volume is an independent risk factor for myocardial infarction but not for coronary artery disease. Br J Haematol. 2002;117:399-404.
- [CrossRef] [PubMed] [Google Scholar]
- Standardization and reference intervals of platelet volume indices: Insight from the Brazilian longitudinal study of adult health (ELSA-BRASIL) Platelets. 2015;26:413-20.
- [CrossRef] [PubMed] [Google Scholar]
- Do the risk factors determine the severity and outcome of cerebral venous sinus thrombosis? Transl Stroke Res. 2018;9:575-81.
- [CrossRef] [PubMed] [Google Scholar]


