
Translate this page into:
Three dimensional convolutional neural network-based automated detection of midline shift in traumatic brain injury cases from head computed tomography scans

*Corresponding author: Deepak Agrawal, Department of Neurosurgery, All India Institute of Medical Sciences, New Delhi, Delhi, India. drdeepak@gmail.com
-
Received: ,
Accepted: ,
How to cite this article: Agrawal D, Joshi S, Bahel V, Poonamallee L, Agrawal A. Three dimensional convolutional neural network-based automated detection of midline shift in traumatic brain injury cases from head computed tomography scans. J Neurosci Rural Pract. 2024;15:293-9. doi: 10.25259/JNRP_490_2023
Abstract
Objectives:
Midline shift (MLS) is a critical indicator of the severity of brain trauma and is even suggestive of changes in intracranial pressure. At present, radiologists have to manually measure the MLS using laborious techniques. Automatic detection of MLS using artificial intelligence can be a cutting-edge solution for emergency health-care personnel to help in prompt diagnosis and treatment. In this study, we sought to determine the accuracy and the prognostic value of our screening tool that automatically detects MLS on computed tomography (CT) images in patients with traumatic brain injuries (TBIs).
Materials and Methods:
The study enrolled TBI cases, who presented at the Department of Neurosurgery, All India Institute of Medical Sciences, New Delhi. Institutional ethics committee permission was taken before starting the study. The data collection was carried out for over nine months, i.e., from January 2020 to September 2020. The data collection included head CT scans, patient demographics, clinical details as well as radiologist’s reports. The radiologist’s reports were considered the “gold standard” for evaluating the MLS. A deep learning-based three dimensional (3D) convolutional neural network (CNN) model was developed using 176 head CT scans.
Results:
The developed 3D CNN model was trained using 156 scans and was tested on 20 head CTs to determine the accuracy and sensitivity of the model. The screening tool was correctly able to detect 7/10 MLS cases and 4/10 non-MLS cases. The model showed an accuracy of 55% with high specificity (70%) and moderate sensitivity of 40%.
Conclusion:
An automated solution for screening the MLS can prove useful for neurosurgeons. The results are strong evidence that 3D CNN can assist clinicians in screening MLS cases in an emergency setting.
Keywords
Midline shift
Traumatic brain injury
Three dimensional convolutional neural network
Head computed tomography
Screening tool

INTRODUCTION
Traumatic brain injury (TBI) remains a major global public health challenge resulting in numerous fatalities at the scene and leaving a significant percentage of survivors with lifelong disabilities.[1] It is frequently cited that TBI leads to the death or hospitalization of 10 million people annually with a heavy impact on low- and middle-income countries.[1]
Severe TBI is the primary cause of hospitalization, disability, and post-injury mortality worldwide, often referred to as a “silent epidemic.”[2] Addressing the unique challenges associated with brain injuries requires specialized knowledge, comprehensive evaluation, and ongoing support to achieve optimal outcomes for individuals affected by these injuries. Unlike bodily injuries, brain injuries are not always externally visible. They can be “invisible,” lacking obvious external signs making their diagnosis more challenging and prone to being overlooked or misdiagnosed. Any asymmetry detected in a head computed tomography (CT) scan may be indicative of underlying pathology or abnormality within the brain such as the presence of midline shift (MLS). The MLS occurs because of TBI and has severe implications. The development of automated tools for MLS detection using image processing techniques is of paramount importance. Implementing an automated detection system can promptly flag cases requiring urgent review facilitating timely care provided by clinicians.[3] Careful screening by the automated system might also provide insights for further management enabling first-line physicians to reconsider injury severity and prioritize accordingly.[3] Although the automated system is not intended to surpass the expertise of specialists such as neurosurgeons, neurologists or neuroradiologists, it can save their time and offer valuable objective information in emergency settings. The article also explores the various challenges that come with MLS detection and some of the recent advancements in this field. This paper presents the development of a deep learning-based neurotrauma screening tool designed to automatically alert neurologists to the presence of MLS in TBI cases.
MATERIALS AND METHODS
Data acquisition
Head CT scans were prospectively collected from the Department of Neurosurgery, All India Institute of Medical Sciences, New Delhi, for the study. The study received ethics approval from the Institute’s Ethics and Scientific Committee. The data collection spanned a period of nine months from January 2021 to September 2021 and included consecutive head CT scans of patients coming to the neurosurgery department. The head CT scans were obtained from two different machines, namely Siemens (Germany) and GE Healthcare (Illinois, United States of America). At the hospital, all head CT scans were stored in the standard Digital Imaging and Communications in Medicine format, which includes text information embedded within the images. Accessing and displaying the CT images was facilitated through the Oviyam Picture Archiving and Communication System (PACS) hardware. The head CT scans along with their corresponding clinical data were retrieved from the Oviyam PACS system. Consecutive clinical data including demographic details and Glasgow coma score were downloaded from the clinical patient record system. The radiologist’s report of the CT scans, used as the gold standard for evaluation, was also included in the metadata collected alongside the head CT scans. The local Picture Archiving and Communication System (PACS) servers were the source of data extraction and storage for this study. To ensure patient privacy and compliance with regulations, all data underwent anonymization following the Health Insurance Portability and Accountability Act guidelines.
Head CT dataset
Upon acquisition, the collected data underwent comprehensive analysis to assess various aspects of the head CT scans. Among the considerations, the slice thickness was examined, ranging from 0.625 mm to 5 mm. For inclusion in the study, only scans with a slice thickness of 1 mm and a 30 s kernel were considered. In addition, head CT scans with discernible artifacts were excluded from the dataset to ensure data quality. To differentiate true MLS cases from those mimicking normal cases or artifacts, a knowledge-based classification system was employed. This system incorporated rules that utilized quantified imaging features and anatomical information. The dataset was divided into training, validation, and testing classes facilitating the development and evaluation of the automated detection system. The training class encompassed a total of 156 head CT scans consisting of 78 normal cases and 78 cases with MLS. The testing class, used for evaluating the system’s performance, comprised 10 normal cases and 10 MLS cases. Consequently, the dataset contained a total of 176 head CT scans.
Technological approaches for automated detection
The chosen technique for automated detection in this study is the three dimensional (3D) convolutional neural network (CNN). The architecture of the 3D CNN comprises convolutional layers, each consisting of fixed-size convolutional filters responsible for extracting relevant features from the input images. Subsequently, these features are spatially reduced and accumulated using pooling layers, employing either max pooling or average pooling techniques. The extracted features are then passed through fully connected layers to reach the output units of the network. The utilization of fully connected layers, along with appropriate activation functions, enables the classification of inputs based on the reduced set of feature vectors.[4]
Developing the model considered the quantity and quality of the available data. During the training phase, the model was monitored using validation metrics and employed the “save best model” option to optimize performance. The pre-processing, hyperparameters, and data augmentation techniques were applied consistently across the training of the 3D CNN models. However, variations were introduced in the training modules to achieve the best results. Below are the details of the specific model configuration that attained the highest performance outcomes during experimentation.
Implementation and model configuration
Labels
The binary labels for each imaging study, indicating negative or positive MLS, were derived from the clinical radiology reports associated with the respective studies as detailed in the supplementary material. It is important to note that the labels were assigned at the level of the entire head CT imaging study and not to individual images within each head CT.
Pre-processing
Each head CT study encompassed a variable number of 512 × 512 (pixel) axial images, mainly due to differences in head size. To achieve uniformity across studies, volume resizing was performed standardizing the image dimensions to 128 × 128 × 64. In addition, min-max normalization was applied to all volumes. The window level was set at −300, and the window width was set at 1400. Contrast enhancement was performed using a contrast factor of 2, and Gaussian smoothing with sigma = 1 was applied. As part of the data augmentation process for training images, rotations were introduced at angles of (20, −10, −5, 5, 10, 20).
Hyperparameters
The model’s hyperparameters were meticulously chosen to optimize performance. The batch size was set at 2, and the initial learning rate was set to 0.0001 employing exponential decay. A decay rate of 0.96 was utilized with decay steps at 100000 following the staircase. The model was trained over 200 epochs with an early stopping mechanism to avoid overfitting. For this model, the binary cross-entropy loss function was employed, and the learning rate was maintained at 0.0001 with optimization performed using the Adam optimizer.
Architecture of the 3D CNN Model
The architecture of the 3D CNN model is depicted in Figure 1. It comprises four blocks followed by a global average pooling layer, two fully connected dense layers, and a dropout layer. The input to the CNN architecture consists of head CT scans with dimensions (128, 128, 64) and one channel. The architecture is composed of four blocks each containing 3D convolutional layers with subsequent ReLU activation functions. In addition, each block includes a 3D MaxPooling layer and a batch normalization layer to enhance the learning process. The dimensions of the input are progressively reduced through the four blocks. The first block reduces the dimensions to (63, 63, 31, 64), the second block further reduces to (30, 30, 14, 64), the third block reduces to (14, 14, 6, 128), and the fourth block further reduces to (6, 6, 2, 256). Following the final block, a global average pooling layer is applied to generate a vector. This vector is then passed through a fully connected layer, with a dropout layer applied subsequently to mitigate overfitting. The output layer consists of a single neuron producing a binary classification output (1 or 0) indicating the presence or absence of hemorrhage in the head CT scan. The performance of the algorithm was evaluated using accuracy and loss values.
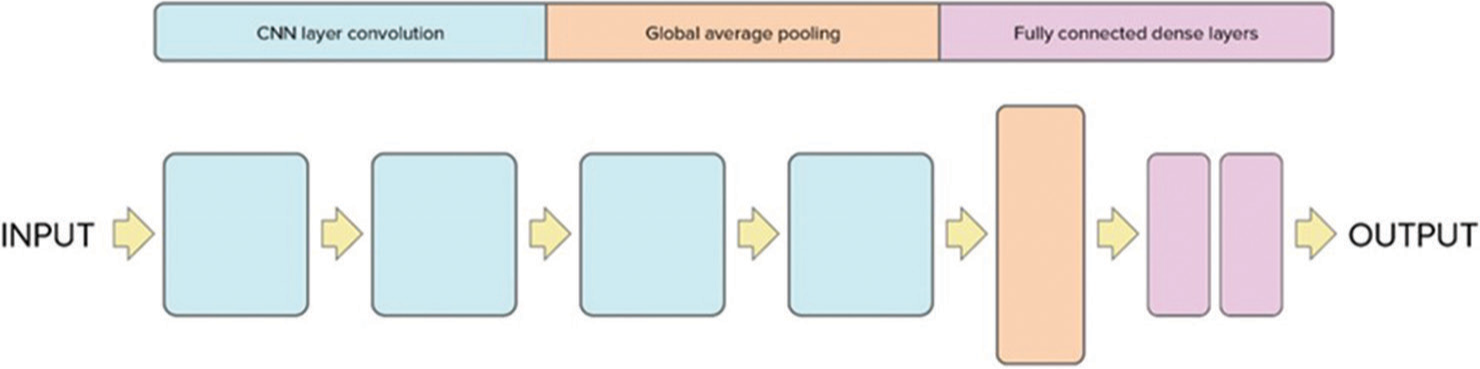
- Proposed 3D convolutional neural network architecture for midline shift. CNN: Convolutional neural network.
Training
During training, the 3D CNN model underwent various training modules, and the details of the best-performing model are provided below. The model was trained for 200 epochs with early stopping implemented at 60 epochs using a validation loss with a patience of 50. The training and validation data were split in a ratio of 60:40, respectively. This approach allowed the model to achieve optimal performance effectively detecting MLSs in head CT scans.
RESULTS
Model analysis and performance
Our study demonstrates that deep neural networks trained on clinical imaging datasets can effectively detect critical radiological conditions such as MLS with reasonable accuracy. The screening tool underwent testing on 20 cases to assess its performance. The training model exhibited the ability to detect 7 MLS cases out of the 10 true MLS cases and correctly identified 4 non-MLS cases out of the 10 true non-MLS cases resulting in an overall accuracy of 55%. In addition, the model showed a specificity of 70% and a sensitivity of 40%. The training plot graph, depicting the accuracy and loss of the model during the training process, is illustrated in Figure 2. The recorded values for loss and accuracy were 0.4682 and 0.7133, respectively while the validation set yielded a loss of 0.4628 and an accuracy of 0.7368. The confusion matrix for the best-performing training plot providing a visual representation of the model’s performance is presented in the Figure 3. The robust performance of our deep learning algorithms indicates their promise in potentially enhancing the speed and accuracy of MLS detection in head CT scans.
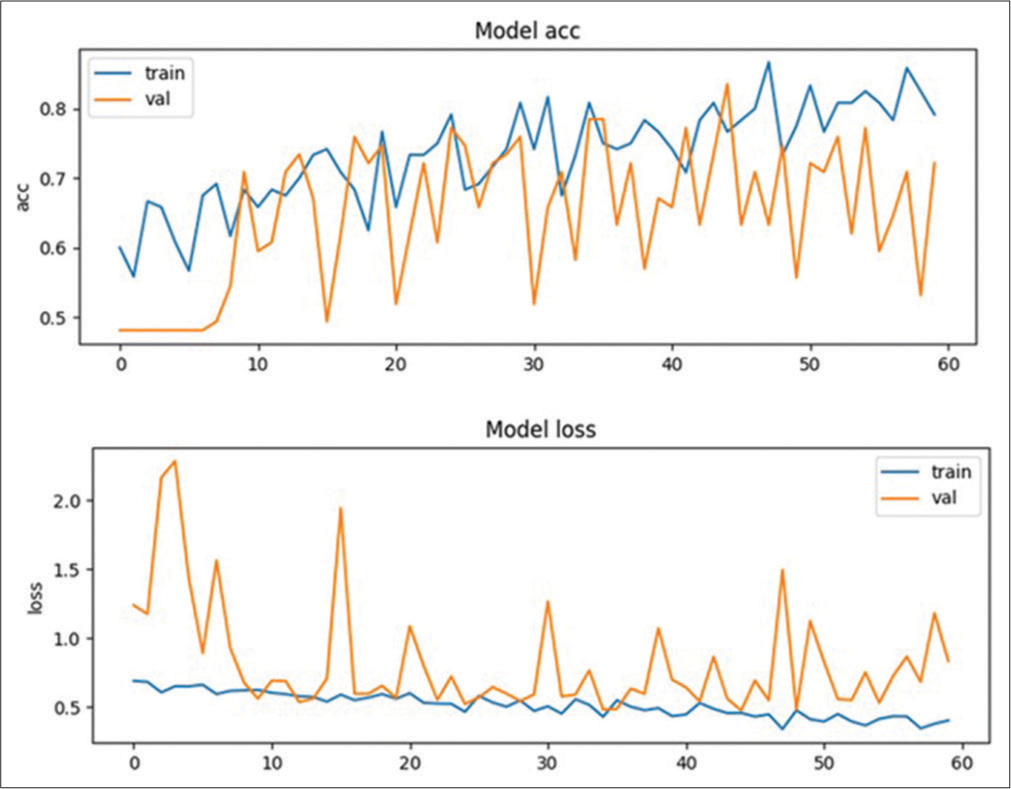
- Training plot graph showing model’s accuracy and loss. train: Training dataset, val: Validation dataset, acc: Accuracy.
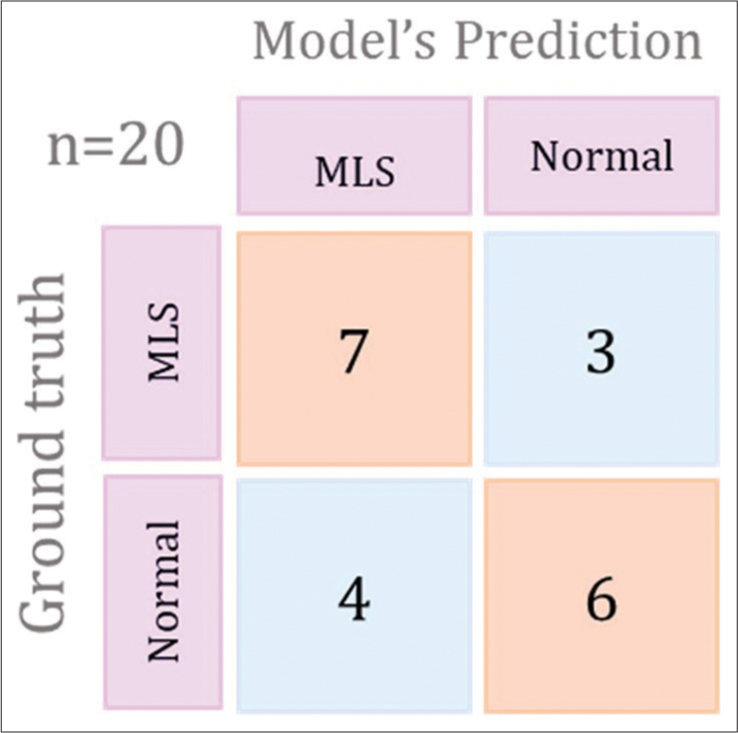
- Graphical representation to show confusion matrix for the best preforming training plot. MLS: Midline shift.
DISCUSSION
In a head CT scan, the brain midline is represented by an imaginary line connecting the attachment centers of the falx. This line delineates the ideal midline, which hypothetically passes through the pineal gland, septum pellucidum, and cerebral falx dividing the brain into two equal hemispheres.[5] Deviation of the midline structure, whether it be the pineal gland, third ventricle or septum pellucidum, from the ideal midline is labeled as a MLS. However, most of the authors often describe MLS in terms of the displacement of the septum pellucidum relative to the ideal midline observed on CT images.[6,7] Various techniques are present to manually quantify MLS. The Brain Trauma Foundation proposed a method that involved measuring the intracranial width at the level of the foramen of Monro and then determining the distance from the inner skull to the septum pellucidum.[3] Another method involves measuring the maximum distance from the midline formed by the anterior falx and posterior falx to the septum pellucidum at the axial level of the foramen of Monro.[3,6,8] Another approach suggested measuring the distance from a line connecting the most anterior and posterior visible points on the falx to the farthest point on the septum pellucidum.[9]
In recent years, there has been a growing interest in leveraging artificial intelligence (AI) techniques for automating radiological procedures in TBI cases. However, a comprehensive investigation and synthesis of AI-based studies focused on identifying MLS in TBI cases are currently lacking.[10] Building upon our previous work on intracranial hemorrhage detection in TBI, which outlined future research directions,[11] the present research addresses this gap by developing a 3D CNN model specifically designed for MLS detection from head CT scans in TBI cases. This study presents a novel technique dedicated to MLS detection. To our knowledge, it is the only work exclusively developed for this purpose. Consequently, direct comparison with existing literature is not feasible. However, we conducted a review of related works on MLS automation and briefly summarized the existing literature. In addition, one of our works provides an elaborate review of all related literature, particularly focusing on automated MLS quantification.[11] The field of automatic MLS analysis has witnessed significant advancements with several approaches proposed to identify and quantify MLSs from head CT scans. These automatic methods capitalize on the brain’s symmetry or employ specific anatomical landmarks such as the falx cerebri, frontal horns of the lateral ventricles, and the third ventricle.[4] By exploring and comparing these approaches, our aim is to provide valuable insights into their effectiveness, limitations, and potential applications in clinical practice.[12]
The symmetry-based approach
This approach is based on the concept of symmetry around the brain’s midline. It does not require the recognition of specific anatomical landmarks. Instead, it seeks to identify a curve that connects all displaced and deformed structures known as the “deformed midline” (DML).[4] Liu et al.[5] developed the hemorrhage-MLS heuristic model to explore the relationship between intracranial hemorrhage and MLS. The model utilized 11 CT images and 423 midline points employing 10-fold cross-validation. However, clear results were not provided. A ventricular geometric pattern-related approach was done using anatomical information from 170 CT sets to identify the ideal midline and the MLS.[13] Liao et al. proposed the “skull axis” method for MLS measurement on CT slices at the level of the foramen of Monro. They tested the algorithm on 81 clinical cases demonstrating moderate accuracy in detecting MLS and lower accuracy for large MLSs (>5 mm) with spontaneous intracerebral hemorrhage. However, their approach had limitations including manual slice selection and limited performance in severe TBI cases.[7] On the lines of symmetry-based approach, a shape-matching technique was used for MLS identification aiming to correlate MLS with intracranial pressure (ICP) levels. The method was evaluated on 391 slices from 17 TBI patients yielding errors of approximately 1 mm for the ideal midline and <2.25 mm for the DML in over 80% of cases. However, difficulties were encountered when ventricles could not be identified due to significant brain deformation. The study achieved an accuracy of approximately 70% with a sensitivity of about 65% and specificity of about 73%.[12]
Some researchers faced challenges in estimating larger MLS and focused on addressing this issue. One such paper developed a computer-based approach using MATLAB algorithms to detect MLS larger than 5 mm. The software was validated on over 200 patients suspected of acute TBI demonstrating high sensitivity (98%) for detecting radiological signs of acute TBI. The method achieved a sensitivity of 92% and specificity of 85% for detecting MLS larger than 5 mm. However, due to limited patients with such findings and additional false-positive results, the positive prediction rate of their MLS detection method was only 70%.[14]
The landmark-based approach
In landmark-based algorithms, the focus is on recognizing specific structures, typically frontal horns of the lateral ventricles, septum pellucidum, third ventricle, etc. These structures serve as anatomical markers for MLS measurement. Among the identified landmarks, the most suitable ones are chosen to construct the DML, which is then compared to the ideal midline for quantifying MLS. This approach allows for targeted analysis and measurement of MLSs based on anatomical markers within the ventricular regions.[6,14] One of such landmark-based approach developed a fully automatic tool, which showed a strong correlation with manual drawing, detecting both small MLSs (<2 mm) and large MLSs (>10 mm). This study demonstrated good sensitivity (84.6–91.7%) and specificity (80–97.4%) for detecting MLSs of 2 mm and 5 mm > 10 mm.[3] A quantification tool, called Icobrain, is based on 2D U-Net and can identify and measure the MLS. The study conducted for developing Icobrain included a dataset of 38 images and achieved a median absolute difference in MLS of 0.86 mm and a classification accuracy of 0.89 for MLS detection at 5 mm threshold.[15] A CNN-based model was employed to estimate the extent of MLS in TBI patients.[16] In 2017, a study introduced an MLS measurement method with an average processing time of approximately 10 s. The automated system exhibited an overall accuracy of 90.24%, which further improved to 92.68% with manual calibrations. This method also reported an accuracy of 0.90 for detecting MLS larger than 5 mm in a study involving 43 subjects.[17]
One approach proposed MLS measurement by recognizing the septum pellucidum and tested the system on images from 96 patients. The algorithm demonstrated accuracy in measuring MLS up to 30 mm with a mean difference of 0.23 ± 0.52 mm compared to manual measurements in 78 cases. This approach achieved a sensitivity of 94%, specificity of 100%, and a positive predictive value of 100% for MLS >5 mm. However, accurately measuring large MLS with significant hematoma remained challenging.[18,19] In another study, Gaussian mixture clustering was applied to an experimental dataset with 565 patients for automated MLS detection and quantification. The method achieved a maximum distance error of 4.7 ± 5.1 mm, with over 100 patients having MLS larger than 5 mm.[5]
Chilamkurthy et al.[20] conducted MLS detection on two datasets: Qure25k (25,000 images, area under the curve [AUC] 0.93) and CQ500 (500 images, AUC 0.97). Their method achieved an average sensitivity of 0.89 for MLS detection (>5 mm). On the other hand, Nguyen et al.[8] proposed a landmark-based system with two modules for MLS detection and quantification using CQ500 dataset achieving a total accuracy of 0.89. Most research efforts focus on MLS quantification, some primarily emphasize measuring the shift rather than its detection. In contrast, our work is specifically developed with the purpose of MLS detection contributing to the advancement of automated MLS detection and quantification in TBI cases. The developed 3D CNN model represents a significant step toward improving MLS detection accuracy and has the potential to enhance diagnostic efficiency in TBI management.
Future directions
Identification of MLS in an emergency setting is a strenuous job. As a radiologist, one must read all the CT scans of a lot of patients and look out for abnormality in all the normal cases.[3] The assessment of secondary injuries post-TBI such as MLS and ICP, holds significant clinical relevance for patient management.[15] Among the various imaging modalities, CT of the brain is commonly performed and interpreted by radiology trainees.[5,14] Previous studies have consistently demonstrated a strong correlation between a considerable MLS observed on CT scans and adverse outcomes including disability or mortality in TBI cases.[13,21] One crucial measurement utilized in the assessment of brain symmetry changes is the MLS, which serves as an essential indicator of pathological severity. Severe brain trauma leads to brain swelling causing imbalanced pressures between the left and right hemispheres. This pressure imbalance leads to the shift and deformation of the ideal midline into a curve causing the MLS.[5,13] A MLS exceeding 5 mm on initial brain CT images is considered significant and predictive of poor neurological outcomes.[3,17,21] While the current work focuses on MLS detection, it does not quantify MLS. To further enhance the outcomes of this study, future directions involve expanding the dataset and continuing to train the 3D CNN model. Including data with various slice thicknesses, kernels, and larger datasets will enhance the robustness of the model and improve overall accuracy. With broader dataset incorporation, the automated MLS detection system can become a valuable triaging tool or an immediate notifier for patients with critical findings, particularly in emergency settings upon acquiring a head CT scan. The proposed system holds promise for facilitating teaching and research endeavors and streamlining the search through large datasets of CT scans. However, to fully harness the potential of this model, additional studies are required to address limitations and validate performance across diverse patient populations and different scanning equipment.
CONCLUSION
In this study, we have successfully developed an automated screening tool capable of detecting MLS on head CT scans in patients with TBI. The CNN-based approach demonstrated acceptable sensitivity for MLS detection indicating its potential applicability in routine clinical practice. Our study demonstrates the feasibility and effectiveness of automated MLS detection using deep learning algorithms. By addressing future directions, refining the model’s capabilities, and conducting further validation, we envision integrating this technology as a valuable tool in clinical settings enhancing patient care and improving diagnostic efficiency.
Ethical approval
The study is approved by the Institutional Ethics Committee at JIPMER, number JIP/IEC/2020/08, dated 25th June 2020 Institute of Ethics committee, All India Institute of Medical Sciences, 28/03/2020, Ref no. IEC-148/06.03.2020, RP-38/2020 .
Declaration of patient consent
Patient’s consent not required as patients identity is not disclosed or compromised.
Conflicts of interest
There are no conflict of interest.
Use of artificial intelligence (AI)-assisted technology for manuscript preparation
The authors confirm that they have used artificial intelligence (AI)-assisted technology for assisting in the writing or editing of the manuscript or image creations.
Financial support and sponsorship
Nil.
References
- Estimating the global incidence of traumatic brain injury. J Neurosurg. 2018;130:1080-97.
- [CrossRef] [PubMed] [Google Scholar]
- Diagnosis and treatment of traumatic brain injury United States: Academic Press; 2022.
- [Google Scholar]
- A robust, fully automatic detection method and calculation technique of midline shift in intracranial hemorrhage and its clinical application. Diagnostics (Basel). 2022;12:693.
- [CrossRef] [PubMed] [Google Scholar]
- Automated detection and screening of traumatic brain injury (TBI) using computed tomography images: A comprehensive review and future perspectives. Int J Environ Res Public Health. 2021;18:6499.
- [CrossRef] [PubMed] [Google Scholar]
- Automatic detection and quantification of brain midline shift using anatomical marker model. Comput Med Imaging Graph. 2014;38:1-14.
- [CrossRef] [PubMed] [Google Scholar]
- Brain midline shift measurement and its automation: A review of techniques and algorithms. Int J Biomed Imaging. 2018;2018:4303161.
- [CrossRef] [PubMed] [Google Scholar]
- Automatic recognition of midline shift on brain CT images. Comput Biol Med. 2010;40:331-9.
- [CrossRef] [PubMed] [Google Scholar]
- Brain midline shift detection and quantification by a cascaded deep network pipeline on non-contrast computed tomography scans In: 2021 IEEE/CVF international conference on computer vision workshops (ICCVW). 2021. p. :487-95.
- [CrossRef] [PubMed] [Google Scholar]
- Reliability assessment of computerized tomography scanning measurements in intracerebral hematoma. Neurosurg Focus. 2003;15:E6.
- [CrossRef] [PubMed] [Google Scholar]
- Automated identification and quantification of traumatic brain injury from CT scans: Are we there yet? Medicine (Baltimore). 2022;101:e31848.
- [CrossRef] [PubMed] [Google Scholar]
- Automated detection of intracranial hemorrhage from head CT scans applying deep learning techniques in traumatic brain injuries: A comparative review. Indian J Neurotrauma. 2023;20:81-8.
- [CrossRef] [Google Scholar]
- Automated midline shift and intracranial pressure estimation based on brain CT images. J Vis Exp. 2013;74:3871.
- [CrossRef] [Google Scholar]
- Automatic midline shift detection in traumatic brain injury. Annu Int Conf IEEE Eng Med Biol Soc. 2018;2018:131-4.
- [CrossRef] [PubMed] [Google Scholar]
- Computer-aided assessment of head computed tomography (CT) studies in patients with suspected traumatic brain injury. J Neurotrauma. 2008;25:1163-72.
- [CrossRef] [PubMed] [Google Scholar]
- Automatic quantification of computed tomography features in acute traumatic brain injury. J Neurotrauma. 2019;36:1794-803.
- [CrossRef] [PubMed] [Google Scholar]
- The delineation of largely deformed brain midline using regression-based line detection network. Med Phys. 2020;47:5531-42.
- [CrossRef] [PubMed] [Google Scholar]
- A simple, fast and fully automated approach for midline shift measurement on brain computed tomography. ArXiv. :abs/1703.00797.
- [Google Scholar]
- Automatic measurement of midline shift on deformed brains using multiresolution binary level set method and Hough transform. Comput Biol Med. 2011;41:756-62.
- [CrossRef] [PubMed] [Google Scholar]
- Automated assessment of midline shift in head injury patients. Clin Neurol Neurosurg. 2010;112:785-90.
- [CrossRef] [PubMed] [Google Scholar]
- Deep learning algorithms for detection of critical findings in head CT scans: A retrospective study. Lancet. 2018;392:2388-96.
- [CrossRef] [PubMed] [Google Scholar]
- Degree of midline shift from CT scan predicted outcome in patients with head injuries. J Med Assoc Thai. 2010;93:99-107.
- [Google Scholar]


