
Translate this page into:
The Swallow Tail Sign of Substantia Nigra: A Case–Control Study to Establish Its Role in Diagnosis of Parkinson Disease on 3T MRI
Ruchi Gupta, MD Flat no 204, Ganga 4, Jalalpur City, Ramjaipal Nagar, Danapur, Patna, Bihar 801503 India drruchigupta28@gmail.com
This article was originally published by Thieme Medical and Scientific Publishers Pvt. Ltd. and was migrated to Scientific Scholar after the change of Publisher.
Abstract
Abstract
Background and Objectives The loss of swallow tail sign (STS) has been studied for the diagnosis of Parkinson's disease (PD). The study aims to establish the role of STS on high-resolution 3D susceptibility-weighted images (SWI) on 3T MRI in clinically diagnosed cases of PD and compare with control population.
Methods and Materials Forty-five patients with clinically diagnosed PD and Parkinson plus syndrome (PPS) formed the study group and were compared with 45 controls without any neurological disease and normal brain magnetic resonance imaging (MRI). Presence or absence of STS was studied on 1-mm thick axial 3D SWI images in bilateral substantia nigra by two radiologists independently, followed by consensus reading. Bilateral absent, unilateral absent, and faintly present STS were considered as absent STS and predicted PD or PPS, and bilateral presence was considered as a positive STS, and was assessed keeping the clinical diagnosis as the gold standard.
Results The sensitivity of the absent STS was 75.55%, specificity 97.77%, positive predictive value 97.14%, negative predictive value 80% and accuracy 86.66%, in the diagnosis of PD or PPS, with odd ratio of 132 (confidence interval 15.97–1098.75). Kappa coefficient was 0.80 (p < 0.001) for both inter- and intrarater agreement, suggesting high reproducibility for the detection of STS.
Conclusions Absence of the STS is a good predictor of degeneration of the nigrosome 1 in the substantia nigra in the PD or PPS patients; hence, it can act as a useful marker of these diseases.
Keywords
SWI
susceptibility
3T
nigrosome
swallow tail sign
parkinson disease
parkinson plus syndrome

Key Messages
Degeneration of nigrosome 1 in substantia nigra presents as loss of swallow tail sign on high-resolution axial susceptibility-weighted imaging images and can act as a marker of Parkinson's disease.
Introduction
Parkinson's disease (PD) is a neurological disorder which is progressive in nature. It includes motor symptoms like tremors, rigidity, bradykinesia, gait abnormality, and nonmotor symptoms like dementia, disturbances in eating, swallowing and bladder and bowel control.1 To make the diagnosis of PD in early stages can be challenging. Nigrosome-1 is the largest cluster of dopaminergic neurons present in dorsolateral substantia nigra (SN) which is most affected in PD. It is seen as a hyperintense structure in the otherwise hypointense SN on high-resolution 3D susceptibility-weighted imaging (SWI) sequence at 3T MRI and hence gives the appearance of swallow tail sign (STS). Degeneration of the nigrosome-1 will appear as absence of the STS; hence, it can be a useful marker of PD.2 Parkinson plus syndrome (PPS) appears as atypical PD, with additional differences like lack of tremor, eye movement abnormalities, orthostatic hypotension, and lack of response to L-Dopa.3 4
Subjects and Methods
The study got approval from the Institutional Ethics Committee (IEC). Informed consent was taken from all participants, according to the Declaration of Helsinki and the IEC-approved proforma. The study was a prospective case–control study, with patients with PD or PPS recruited from the institute's neurology department. The patients were recruited during their disease workup and the magnetic resonance imaging (MRI) scans including the SWI sequence were done as part of evaluation. Sample size calculation was done making the assumptions of 90% power, 30% exposure to controls, odd ratio (OR) of 4.5 and confidence interval (CI) of 95%, using the Fleiss method with continuity correction, to yield a total sample size of 90, with 1:1 case and control ratio.
All research participants underwent a mini-mental state examination (MMSE), and scores ≥ 27 were essential to be enrolled in the study. The disease severity was measured using the unified Parkinson's disease rating scale and Hoehn and Yahr clinical rating scales.
The controls included spouse, relatives and friends/acquaintances of patients; however, one-to-one age and sex matching could be done for 26 participants and remaining 19 controls were derived from patients already undergoing an MRI scan for nonneurological indication, mostly a knee or shoulder MRI for osteoarthritis or rotator cuff evaluation. Controls could have controlled diabetes or hypertension, but no neurological symptoms or deficits, and a normal MMSE score.
The study was designed to enroll consecutive patients, but 3 patients and 4 controls had claustrophobia, 6 scans (4 patients and 2 controls) were deemed unsuitable due to motion artifact, presence of microbleeds and ischemic lesions and significant ventriculomegaly, and 3 patients opted out later; accordingly, 10 more cases and 6 controls were further enrolled to complete the estimated sample size.
MRI of all cases and controls was performed on a 3T scanner (Discovery 750w, GE, United States), using a 40-channel head coil at the institute's radiodiagnosis department in the presence of the principal investigator. Patients underwent a full MRI scan of the brain, while controls underwent limited brain scan including a diffusion-weighted imaging (DWI), fluid-attenuated inversion recovery (FLAIR) and the 3D susceptibility-weighted imaging (SWI) sequence. The MR sequence studied was a high-resolution whole brain 3D SWI sequence using gradient echo planar imaging (EPI) with scan duration of 4 minutes 26 seconds, TR/TE-41/23 milliseconds, number of excitations (NEX) - 0.70, FLIP angle 15 degrees, frequency field of view (FOV) 24, phase FOV 0.70, bandwidth 62.50, and Echo train length of 4. Magnitude and phase images were generated, which were later reformatted as minimum intensity projection (minIP) images. The axial slices were oriented parallel to a line drawn from genu to splenium of corpus callosum. The slice thickness of the acquisition was kept as 1 mm to avoid slice overlap and also generate high-quality volumetric data.
The imaging data was anonymized and transferred to a commercial server-client solution (AW Server 4.7, GE, United States) and reviewed on the individual client workstations of the two radiologists, blinded to the patient's or control's status as such, who marked their entries on a form designed on the free software EpiInfo (CDC, Atlanta, Georgia, United States).
Presence or absence of the STS was assessed in axial sections on the 3D SWI sequence in nigrosome-1, which is seen in the posterior third of SN in midbrain on both sides. It normally appears as a high-signal structure maintaining a linear, comma or wedge shape, and bordered on both sides by low-signal structures (pars compacta SN and medial lemniscus), such that this complex resembles a swallow's tail.
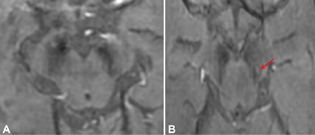
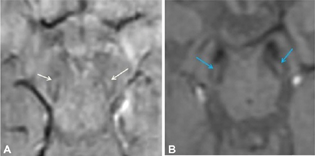
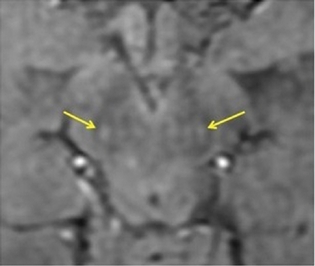
The reports of STS were classified in the following four groups: bilateral absent, bilateral present, unilateral absent, and unilateral or bilateral faintly present. Bilateral absent, unilateral absent and faintly present were considered as absent STS (Fig. 1), considering the asymmetric onset of PD, and only bilateral presence were considered as a positive STS (Figs. 2 and 3), to provide a simple dichotomized data for statistical evaluation.
-
Fig. 1 Clinical Parkinson's disease (A) Bilateral swallow tail sign (STS) absent in 74-year-old male (B) Absent STS on the right side and faintly positive on the left side (red arrow) in a 54-year-old female.
Fig. 1 Clinical Parkinson's disease (A) Bilateral swallow tail sign (STS) absent in 74-year-old male (B) Absent STS on the right side and faintly positive on the left side (red arrow) in a 54-year-old female.
-
Fig. 2 Normal swallow tail sign in control population (A) 46-year-old male (B) 60-year-old female.
Fig. 2 Normal swallow tail sign in control population (A) 46-year-old male (B) 60-year-old female.
-
Fig. 3 Clinical Parkinson's disease—swallow tail sign seen in bilateral substantia nigra in a 45-year-old female marked by yellow arrows (false positive sign).
Fig. 3 Clinical Parkinson's disease—swallow tail sign seen in bilateral substantia nigra in a 45-year-old female marked by yellow arrows (false positive sign).
Each reader read the scan again after 4 weeks and a final joint reading session was done with both radiologists and the chief neurologist for each of the scans. The data was uploaded to Microsoft Excel 2010 and statistical analysis was done using IBM SPSS for Windows version 22.0 (SPSS, Inc., Chicago, IL, United States).
Demographics were compared between patients and controls using two sample t-test. For nonnormalized data, nonparametric tests were used for group comparisons. Fisher's exact test was used, if applicable, for sample distribution. Kappa value was determined for interrater agreement. Sensitivity, specificity, negative predictive value (NPV) and positive predictive value (PPV), and accuracy were calculated. Descriptive data were described as numbers and percentages, and values were generated as mean ± standard deviation (SD); p < 0.05 was considered as significant for all tests. Logistic regression with adjustment for age difference was done and OR derived. Images for publication were generated directly using the software's export function.
Results
A high intrarater and interrater agreement was observed, with kappa of 0.80 (p < 0.001) for either types, with an absolute agreement of 94%. For both raters, the differences were in the “faintly present” and “unilateral absent” findings, while no discordance was observed in “bilateral present” or “bilateral absent” findings.
The data of patients and controls with presence and absence of the STS are tabulated in Table 1.
|
Study group (PD/PPS +); n = 45 |
Control group (PD/PPS –); n = 45 |
|
|---|---|---|
|
Mean age ± SD (years) |
59.3 ± 10.78 (range 23–75) |
54.7 ± 10.96 (range 30–72) |
|
Male to female ratio |
2.46:1 |
2.75:1 |
|
STS absent (test positive) |
77.78% (34/45) (true positive) |
(2.2%) 1/45 (false positive) |
|
STS present (test negative) |
22.22% (11/45) (false negative) |
(97.7%) 44/45 (true negative) |
Abbreviations: PD, Parkinson's disease; PPS, Parkinson plus syndrome; SD, standard deviation; STS, swallow tail sign.
The two sample t-test comparing the mean age of patients and controls showed significant difference, 59.3 ± 10.78 years and 54.7 ± 10.96 years, respectively (p = 0.0479). Mean age of the 34 true positive patients was 60.6 ± 9.22 years, while the mean age of the remaining STS present participants (including the false negative patients and the controls) was 54.7 ± 11.58 years, and the two sample t-test showed significant age difference between these two groups (p = 0.0125).
More males were seen in either groups, with the male to female ratio being 2.46:1 and 2.75:1 in patient and control groups, respectively, and the Fisher exact test showed equal distribution (p < 0.001). Similarly, there was no significant difference in sex distribution of true positive and the STS present participants (Fisher exact test, p < 0.001).
In the study group, out of 45 patients, 34 (77.78%) had absent STS (true positives) and 11 (22.22%) had present STS (false negatives). Among the true positives, 25 were females and 9 were males; in false negatives, 6 were males and 5 were females. In the control group, out of 45 patients, STS was absent in 1 female patient (false positive) and present in 44 subjects (true negatives), out of whom 33 were males and 11 were females.
Keeping clinical diagnosis as gold standard, the accuracy of absent STS in the diagnosis of PD and PD plus syndromes was 86.66%, sensitivity 75.55%, specificity 97.77%, PPV 97.14%, NPV 80%, and positive likelihood ratio 34. Using logistic regression, OR was 136 (95% CI 16.73–1105.57) and final OR after adjusting the age effect was 132 (95% CI 15.97–1098.75).
Discussion
Susceptibility weighted sequence (SWI/susceptibility-weighted angiography [SWAN]) is a 3D spoiled gradient-echo (GE) sequence that helps in delineation of blood degradation products and iron and calcium deposits. These paramagnetic, diamagnetic, and ferromagnetic substances increase the local magnetic inhomogeneity, leading to T2 shortening and hence drop in signal on T2* weighted GE sequences.5 SWI sequence consists of both phase and magnitude information. Paramagnetic substances, such as deoxyhemoglobin and hemosiderin, induce positive phase shift and diamagnetic substances, such as calcium, cause a negative phase shift. The iron content in SN in PD is nearly 80%, more than in healthy individuals, and appear dark on SWI sequence.6
PD is a neurological disease which is characterized by degeneration of dopaminergic neurons in the SN. Nigrosomes are the dopaminergic cells in the SN and are a part of five groups, of which nigrosome 1 is the largest group.7 Nigrosome 1 appears bright on SWI sequence and seen in posterolateral part of SN pars compacta. Loss of nigrosome 1 manifests as absence of the STS.2
Blazejewska et al described the hyperintense linear area within the posterolateral region of the otherwise hypointense SN pars compacta on 7T MRI high-resolution T2*-weighted sequence, conforming to nigrosome 1 and was not seen in all 10 PD patients in their series.8 Schwarz et al described the similar structure as STS on high resolution T2*-weighted sequence on 3T MRI. The study predominantly included non-PD participants and demonstrated very high sensitivity (100%), high specificity (97%), NPV (1), PPV (0.69) and accuracy (96%) of the absent STS in PD patients compared with the presence of STS in the control group.2 Few studies available in the literature show variable sensitivity and specificity. A study by Cosottini et al established mean sensitivity of 79%, specificity of 94%, and diagnostic accuracy of 86% on 3T MRI.9 In our study, specificity and PPV were higher, and sensitivity was on lower side (75.55%); however, the results were somewhat similar to Cosottini et al. On the other hand, Gao et al in a universality study found 49 participants from the control group (96.08%) had bilateral or unilateral presence of the STS, while 54 patients (100%) lacked the STS.10 Interestingly this study also had found 15 cases to be unsuitable due to artifacts or presence of brainstem disease. In our study, issues were also faced due to claustrophobia, presence of disease, or failure to perform one-to-one matching. On 7T MRI, Schmidt et al studied 13 healthy adults and observed the STS in 81% of cases, while 19% did not have the STS. The authors hypothesized that variable organization of nigrosome 1 in different individuals leads to lack of uniform signal in SWI; hence, few of the normal subjects may be classified as to harbor the disease (false positive).11 In our series, false positive cases were very low, only 1 out of 45 controls (2.22%) showed absent STS.
In a study done to evaluate if loss of STS could distinguish PD from PPS, the authors included 25 PD, 21 PPS and 14 control subjects, and found there was no difference in the presence of sign between the two patient groups and sign was present in 79% of controls. The overall sensitivity of the absence of sign in PD and PPS was 0.76 and 0.91/1.0, while the specificity was 0.34 and 0.35/0.36, respectively. The sensitivity, specificity, and diagnostic accuracy of the loss of the sign for controls versus all patients was 0.85, 0.79, and 0.83, respectively.12 In our study, both PD and PPS patients were included and clubbed in one group and loss of the sign was then compared with normal controls. A subgroup analysis comparing these two groups also did not show any significant difference. Sensitivity and accuracy in our study are similar to the above study; however, the specificity and PPV of the sign was very high, nearly 97%, thus indicating very high likelihood of the presence of PD or PPS if the STS is absent. Also, comparing the STS in the two groups, the final OR adjusted to age calculated was 132, using logistic regression, with the simple interpretation being that the absence of the STS has a 132 times odds of having PD or PPS (p < 0.001).
Our study had a visible effect of age on the performance of the STS, with mean age of true positive being higher than the mean age of false negative or the controls, indicating that the sensitivity of the test probably increases with age. This finding however needs to be confirmed with a larger study group.
The control population in our study had very few false positive test. This might be related to proper selection of the control group or the difference in the slice thickness, 1 mm in our study versus 1.5 to 2 mm in other studies.10 13 14 Also, the images were read by two radiologists who had more than 10 years of experience, one being a neuroradiologist, and both being already involved in routine clinical and research work related to degenerative brain disorders. This finding is also significant in light of the knowledge that the readers were blinded yet had correctly classified 11 out of the 34 true positive cases as “faintly present STS” (6 unilateral and 4 bilateral). Erroneous judgment of these cases as “absent STS” could have significantly altered the statistical results. Also, the inter- and intrarater agreement of these “unilateral present STS” and “faintly present STS” were very high.
In addition to SWI, high-resolution quantitative susceptibility mapping (QSM) can be done for the imaging of nigrosome 1. A study was done at 3T in 38 idiopathic Parkinson disease (IPD) patients and 25 healthy subjects. The segmented SN that had susceptibility values lower than 60, 65, 70, 75, and 80 ppb were compared between the two groups and found that the voxels with values less than 70 ppb differentiated IPD and normal subjects with best diagnostic performance (p < 0.0001).15 The technique needs to be further evaluated in larger studies.
Our study has several limitations. We had clubbed PD and PPS participants together, and larger sample size of both groups could have offered better statistical differences. We did not compare the STS with the disease severity. Increase in sample size of PD patients will also help us to achieve more accurate results in future. Better age matching between the two groups could have offered sharper results. Also, the clinical diagnosis was taken as gold standard, even though the cases were taken from dedicated clinic with experienced staff, having consecutive patients. A randomized study design might have also been better. Other imaging parameters of the MRI, clinical scales, and other imaging tools like positron emission tomography (PET) or dopamine transported scan could have been included in the study to offer a composite model for evaluation of PD and PPS patients.
Conclusion
The healthy nigrosome-1 present in dorsolateral SN can be easily and reliably seen in the form of the STS on thin slice 3D SWI sequence at 3T MRI. The absence of the STS, indicating nigrosome-1 degeneration, can act as a diagnostic marker for the PD or PPS with very high specificity and PPV; hence, this sequence should always be included in the MRI protocol in imaging of suspected cases.
Conflict of Interest
None declared.
Funding None.
References
- Structural and functional imaging in parkinsonian syndromes. Radiographics. 2014;34(5):1273-1292.
- [Google Scholar]
- The 'swallow tail' appearance of the healthy nigrosome - a new accurate test of Parkinson's disease: a case-control and retrospective cross-sectional MRI study at 3T. PLoS One. 2014;9(4):e93814.
- [Google Scholar]
- Diagnosis and management of atypical parkinsonian syndromes. J Neurol Neurosurg Psychiatry. 2002;72(01):I10-I16.
- [Google Scholar]
- P. K. Gangopadhaya SK Das. Parkinsonism plus syndrome – A review. Neurol India. 2009;51:183-188.
- [Google Scholar]
- Susceptibility weighted imaging: clinical applications and future directions. World J Radiol. 2018;10(4):30-45.
- [Google Scholar]
- Utility of susceptibility-weighted imaging in Parkinson's disease and atypical Parkinsonian disorders. Transl Neurodegener. 2016;5:17.
- [Google Scholar]
- Parkinson's disease related signal change in the nigrosomes 1-5 and the substantia nigra using T2* weighted 7T MRI. Neuroimage Clin. 2018;19:683-689.
- [Google Scholar]
- Visualization of nigrosome 1 and its loss in PD: pathoanatomical correlation and in vivo 7 T MRI. Neurology. 2013;81(6):534-540.
- [Google Scholar]
- Comparison of 3T and 7T susceptibility-weighted angiography of the substantia nigra in diagnosing Parkinson disease. AJNR Am J Neuroradiol. 2015;36(3):461-466.
- [Google Scholar]
- Universality analysis of the existence of substantia nigra “swallow tail” appearance of non-Parkinson patients in 3T SWI. Eur Rev Med Pharmacol Sci. 2016;20(7):1307-1314.
- [Google Scholar]
- Ultra high-field SWI of the substantia nigra at 7T: reliability and consistency of the swallow-tail sign. BMC Neurol. 2017;17(1):194.
- [Google Scholar]
- Can loss of the swallow tail sign help distinguish between Parkinson Disease and the Parkinson-Plus syndromes? Clin Imaging. 2017;44:66-69.
- [Google Scholar]
- Nigrosome 1 detection at 3T MRI for the diagnosis of early-stage idiopathic Parkinson disease: assessment of diagnostic accuracy and agreement on imaging asymmetry and clinical laterality. AJNR Am J Neuroradiol. 2015;36(11):2010-2016.
- [Google Scholar]
- MRI of the swallow tail sign: a useful marker in the diagnosis of lewy body dementia? AJNR Am J Neuroradiol. 2017;38(9):1737-1741.
- [Google Scholar]
- Diagnosis of early-stage idiopathic parkinson's disease using high-resolution quantitative susceptibility mapping combined with histogram analysis in the substantia nigra at 3 T. J Clin Neurol. 2018;14(1):90-97.
- [Google Scholar]


