
Translate this page into:
Study of attentional deficits (unilateral spatial neglect) in Moroccan adolescents attending school-Rabat Sale Kenitra region

*Corresponding author: Jaouad Rouane, Department of Biology, Cognitivo-Behavioral Neuroscience and Applied Nutrition Laboratory, Clinical Neuropsychology Team, Faculty of Sciences, Ibn Tofail University, Kenitra, Morocco. jaouad.rouane@uit.ac.ma
-
Received: ,
Accepted: ,
How to cite this article: Rouane J, Moussa Ahmadou T, Ahami AO. Study of attentional deficits (unilateral spatial neglect) in Moroccan adolescents attending school-Rabat Sale Kenitra region. J Neurosci Rural Pract 2023;14:729-34.
Abstract
Objectives:
Attention is an essential part of cognitive functions for all learning in the school environment. The screening of attentional deficits constitutes an important field of research, given its relationship with other cognitive functions and the neurocognitive profiling of Moroccan adolescents in school.
Materials and Methods:
A study was conducted over 3 months. A comparative and predictive method is used, the Bells test, to assess the state of neglect of these students, as well as the detection of attention deficit.
Results:
Two hundred and fifty students participated, including 152 girls [60.4%] and 98 boys [39.6%], the average age is 16.77 ± 1.23 years, range: 14–21, divided into three school levels: Common core (TC) 27.6%, 1st-year baccalaureate 50.8%, and 2nd-year baccalaureate 21.6%. This study found that 18.4% of the students had attentional deficits and 4% had a unilateral spatial neglect pattern in young adolescents in school.
Conclusion:
The Bells Test is a useful screening tool to detect these attentional deficits. This implies that attentional disorders negatively influence the academic and motor performance of the subjects. This implies that attentional disorders negatively influence the academic and motor performance of the subjects and, therefore, increase the percentage of school failure.
Keywords
Attentional deficit
Unilateral spatial negligence
Moroccan adolescents in school
Hemineglect

INTRODUCTION
Attention research has developed in recent years. There are now many new ways of studying how we can select certain aspects for processing while neglecting others, and how we can combine tasks, learn skills, and perform intentional actions. Attention is increasingly seen as a complex process closely linked to perception, memory, and action. Attention refers to the goal-directed orientation of activity, which increases the efficiency of the processes of information intake and action execution. This corresponds to an optimization of information processing[1] to better perceive, conceive, distinguish, and memorize.
Attention is a complex cognitive process involving the selection, control, and maintenance of information. It is not a single process, but rather a network of processes that work together to enable us to focus on relevant information and ignore distractions.
Several researchers have attempted to model attention and determine its different facets. In this sense[2] has dissociated attention into three aspects: The first aspect is the notion of alertness, which means maintaining vigilance to accomplish the task. The second aspect of alertness is the ability to select information from one source or another. The third aspect is linked to the idea of a limited central processing capacity, which makes the attentional processing of two tasks simultaneously seem difficult.
Attention, then, takes several forms, according to several specialists,[3,4] determine three types: Sustained (or maintained), selective (or focused), and divided.
Unilateral spatial neglect (USN) is a disorder in which people ignore stimuli on one side of their body. The disorder can be caused by damage to the parietal lobe of the brain and can have a significant impact on a person’s life.
This singular disorder of spatial use and awareness is most often the result of a right hemispheric lesion, notably parietal.[5,6] USN may be linked to a variable combination of disorders of selective spatial attention[7-9] which highlighted the involvement of the right parietal-frontal regions in a vigilance task. It appears that the attentional processes involved in selective attention tasks are also affected by the deficits observed in hemineglect since the brain regions activated in these tasks correspond to those impaired in most of these patients.
Understanding the mechanisms of USN and the diagnostic technique is important to provide clinicians with suitable tools for diagnosis, treatment, and rehabilitation. Research into USN can also contribute to a better understanding of the brain’s mechanisms of spatial processing and the neural correlates of perceptual awareness.
We aim to screen for attention disorders, in particular USN, and to collect relevant data on a sample of Moroccan students. Cancellation paradigms are often used for the neuropsychological assessment of attention.[10]
A well-known cancellation instrument for assessing attention deficit and hemineglect syndrome is the Bells Test approved by Azouvi P et al.[11] and, developed by Gauthier et al.[13] It involves canceling out target images (bells) from a random mix of distractors to study attentional functions, perception, and processing speed. Studies have used different versions of the Bell Test to assess children with attention deficit hyperactivity disorder.[12]
The present study will enable us to develop a screening tool for USN and attentional deficit that is culturally adapted to Moroccan students, to administer the screening tool to a sample of Moroccan students, to analyze the data to identify the prevalence of NSU and attentional disorders in the sample, and to correlate the prevalence of NSU with other factors, such as age, gender, and level of education.
MATERIALS AND METHODS
Location and duration of the study
The study was conducted in two Moroccan qualifying high schools, Salman Elfarissi and Cheikh Ibn Taymia, located in the Skhirat Témara province of the Sale Rabat Kenitra region in central Morocco.
The study will past 3 months.
Subject of study
The number of students who participated in the study was 250, with (152 girls [60.4%] and 98 boys [39.6%], the mean age is 16.77 ± 1.23 years, range: 14–21). The classes studied were chosen randomly, without discrimination, divided into three educational levels: Common core (TC) 27.6%, 1st-year baccalaureate (1BAC) 50.8%, and 2nd-year baccalaureate (2BAC) 21.6%. All participants agreed to participate voluntarily in this study; they had sufficient vision to discriminate the stimuli (some of them had corrective glasses). We included students with sufficient vision to discriminate the stimuli and excluded students with vision problems.
Inclusion and exclusion parameters
All participants agreed to take part voluntarily in this study; they had sufficient vision to distinguish the stimuli (some of them wore corrective glasses) and the physical ability to perform the physical education and sports sessions. We included students whose vision was sufficient to distinguish the stimuli and excluded students with vision problems.
Tools used
Bell’s Test
Test administration
The cancellation test involves the detection of bells placed randomly among several distractors on an A4 sheet of paper. The test consists of 315 stimuli, including 280 distractors (house, horse, tree, and car.) and 35 bell figures, which are target stimuli. The latter are all circled with a pencil or pen.[13] They are arranged from left to right in seven columns (3 on the left, 1 in the middle, and 3 on the right), each containing five bells and 40 other stimuli. Without wasting any time, the subject begins to circle all the bells with the pencil on the task sheet placed in front of him/her, with the black dot on the subject’s side, centered on his/her midsagittal plane.
At the end of the test, the following variables are scored: (1) The number of omissions of targets on the left side, (2) the number of omissions of targets on the right side, (3) the total number of omissions, and (4) the time taken to complete the test.[13] Each participant uses a scanning strategy to search for bells; seven strategies are noted:
Strategy A: Top to bottom, right to left. Strategy B: Top to bottom, left to right. Strategy C: Bottom right to bottom left.
Strategy D: Bottom left to right. Strategy E: Top to bottom right. Strategy F: Top to bottom left. Strategy G: Bottom to top right. Strategy H: Bottom to top left. Strategy I: Disorganized bell-shaped search.
The norms presented therefore enabled the screening of spatial neglect, using lateralized indices, and of more diffuse attention disorders, taking into account global omissions and the time taken to complete the test.[14]
Statistical analysis
Descriptive statistics
Results are expressed as mean ± standard deviation.
Analytical statistics
The student’s t-test was used to compare the mean scores of the different variables concerning gender.
Analysis of variance (ANOVA) and Tukey tests were used to compare the mean scores of the different variables with the age group.
RESULTS
Sample distribution
Our sample is represented by 152 girls (60.4%) and 98 boys (39.6%), range: 14–21, with (16 and 17) most represented by 65.60%, the mean age is 16.77 ± 1.23 years. Classes were divided into three levels of education: Core curriculum (TC) 27.6%, 1BAC 50.8%, and 2BAC 21.6% [Table 1].
| Sex | Age | Total | |||||
|---|---|---|---|---|---|---|---|
| M | F | (14 and 15) | (16 and 17) | (18 and 19) | (20 and 21) | ||
| 1st year baccalaureate | 51 | 76 | 1 | 110 | 14 | 2 | 127 |
| 2nd year baccalaureate | 17 | 37 | 0 | 10 | 38 | 6 | 54 |
| Common core | 30 | 39 | 22 | 44 | 3 | 0 | 69 |
| Total | 98 | 152 | 23 | 164 | 55 | 8 | 250 |
Screening for attention disorders (USN)
Bells Test performance study
Bells Test scores averaged 33.54 ± 1.66 with (min = 26, max = 35) [Table 2]. With an average completion time of 3:20 ± 00:52 with (min = 01:50, max = 6:19) and an average omission of 1.47 with (min = 0, max = 9).
| Minimum | Maximum | Average | Standard deviation |
|
|---|---|---|---|---|
| Total score | 26 | 35 | 33.54 | 1.667 |
| Production time | 01:50 | 06:19 | 03:20 | 00:52 |
| Omission | 9 | 0 | 1.47 | 1.667 |
By gender
The distribution of Bells Test score averages by gender [Table 3] shows that the averages are higher for girls, with an average of 33.65 ± 1.665 than for boys, with an average of 33.37 ± 1.665. According to the student’s t-test [Table 3], all results showed no significant difference between girls and boys in Bells Test scores (P = 0.189).
| Bells test (MOY±ECART) | |
|---|---|
| Average total (n=250) | 33.54±1.66 |
| Sex | |
| M (n=98) | 33.37±1.665 |
| F (n=152) | 33.65±1.665 |
| P-value | P=0.189 |
M : Boys, F: Girls
Depending on age
Analysis of score averages by age group shows that the average score for the (20 and 21) age group is the highest, followed by the (18 and 19) and (16 and 17) age groups, while the lowest average score is for the (14 and 15) age group.
According to the ANOVA test, the results showed a significant difference between age categories in terms of Bells test scores (F = 11.791; P < 0.05). This was also confirmed by the Tukey test, which found that means with the same letter did not differ significantly. In our case, we found two categories (14 and 15) (a) and (16 and 17) (b); (18 and 19) (b) and (20 and 21) (b) [Table 4 and Figure 1].
| Age category | (14 and 15) | (16 and 17) | (18 and 19) | (20 and 21) | FICHER (P-value) | Sig. |
|---|---|---|---|---|---|---|
| Bells Test (MOY±ECART) (Min, Max) |
(a) 31.91±2.172 (26, 35) |
(b) 33.53±1.652 (28, 35) |
(b) 34.09±1.005 (31, 35) |
(b) 34.63±0.518 (34, 35) |
11.791 | 0.000 |
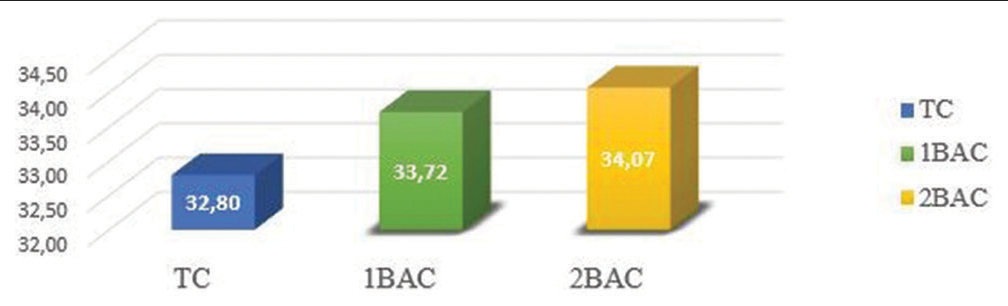
- Distribution of Bells Test score means by school level.
By school level
Analysis of the mean scores concerning grade level [Figure 1] shows that the mean score for the 2BAC is the highest at 34.7 ± 1.079, followed by the 1BAC at 33.72 ± 1.578, while the lowest mean score is for the common barter at 32.80 ± 1.592.
According to the ANOVA test, the results showed a significant difference between school levels (F = 11.178; P = 0.00).
Distribution of omissions
[Table 2] shows an average of 1.46 1.667 with a maximum of nine omissions and a minimum of 0 total omissions.
According to [Table 5], 34.4% circled all the bells on the sheet. About 58% omitted four bells on the sheet. About 4% omitted five bells on the sheet. About 3.2% omitted six or more of the bells on the sheet.
| Number of omissions | Number | % |
|---|---|---|
| 0 | 87 | 34.4 |
| 1–4 | 145 | 58 |
| 5 | 10 | 4 |
| ≥6 | 8 | 3.2 |
Table 6 shows the mean omission distributions: On the left with (0.90 ± 1.020, max = 5, min = 0), and on the right with (0.90 ± 1.011, max = 5, min = 0).
| Left omission | Right omission | |
|---|---|---|
| Average | 0.90 | 0.92 |
| Standard deviation | 1.020 | 1.011 |
| Minimum | 0 | 0 |
| Maximum | 5 | 5 |
Table 7 shows that 54.4% and 56% of students circled all the bells on the right and left of the sheet, respectively. About 44.8% and 42.4% of students omitted 1–4 bells on the right and left of the sheet, respectively. About 0.8% and 1.6% of students omitted five bells on the left and right of the sheet, respectively. No student scored six or more omissions, either on the left or right of the sheet.
| Number of omissions | OD | OG | ||
|---|---|---|---|---|
| Number | % | Number | % | |
| 0 | 136 | 54.4 | 140 | 56.0 |
| 1–4 | 112 | 44.8 | 106 | 42.4 |
| 5 | 2 | 0.8 | 4 | 1.6 |
| ≥6 | 0 | 0 | 0 | 0 |
OG: Left omission, OD: Right omission
The results of the tables show that 18.4% of students have an attention deficit. About 4% of students have a profile of USN.
Execution strategy
Figure 2 shows that 19% of subjects use strategy A to search for bells. About 11% of subjects use strategy B to search for bells. About 5% of subjects use strategy C to search for bells. About 10% of subjects use strategy D to search for bells. About 11% of subjects use strategy E to search for bells. About 8% of subjects use strategy F to search for bells. About 5% of subjects use strategy G to search for bells. About 4% of subjects use strategy H to search for bells. About 27% of subjects use strategy I to search for bells.
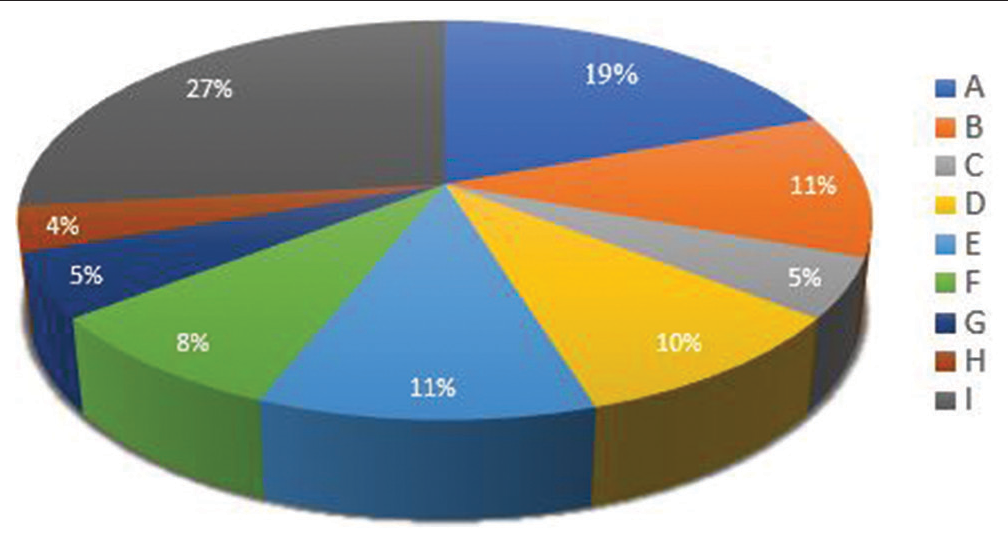
- Different scanning strategies for the Bell Test.
DISCUSSION
Our study aims to screen Moroccan school children for attentional deficits and USN.
The Bells Test scores showed a mean score of 33.54, lower than that found in studies.[13,14] This difference in scores may be due to the age of the participants.
According to both descriptive and analytical analyses, gender does not affect participants’ test performance. A finding confirmed by studies.[13-15]
The results showed a significant difference in scores between age categories, which is consistent with the study[14] but contradicts studies carried out by Gauthier et al.,[13] Azmy et al.[15] The results showed a significant difference between school levels in terms of scores, with a decrease in total omissions with the rise in school level (increase in score averages as school level rises). This difference can be explained by the fact that subjects with lower levels of education have less control over the quality of their work. An effect of educational level on completion time has already been described in certain perceptual-motor tasks.[16]
This reinforces the significant difference in scores by age category since each school level is made up of a defined age category. This contradicts the results of Rousseaux et al.[14] who report no significant difference between school levels.
The results showed that 18.4% of subjects had attention problems score rating[13] and 4% had a profile of USN. This low percentage is explained by Gauthier and Joanette[17] who observed that subjects aged 18–28 omitted no more than two bells in each hemispace. The presence of these deficits will have a negative effect on students’ academic and sporting performance.
This study showed that 27% of the students in our sample, particularly those with attention problems, did not use an organized scanning strategy to search for bells. These results are in line with those reported by Gauthier et al.[13] who showed that the scanning strategy of left hemiplegics is disorganized compared with that of normal. Fortin et al.[18] believe that academic success is the result of an interactive process between personal and environmental factors. Furthermore, Becker and Luthar[19] suggests that mental health in young people is one of the components linked to academic performance. On the other hand, several studies around the world have demonstrated the link between neurocognitive factors and school performance.[20-24] Screening for attentional disorders is a genuinely encouraging field for clinical practice and research, in the same way as memory or executive disorders affect all cognitive functions. They can also have an impact on language production. They can give rise to significant difficulties in the school, workplace, and social or family environment.
CONCLUSION
We were able to screen for attention disorders (USN) using the bell barrage test, which is a reliable and valid instrument for assessing visual hemineglect.[13,25] The study revealed that 18.4% of students had attention problems, and 4% had a profile of USN. This implies that attention disorders have a negative influence on the academic and motor performance of subjects, thus increasing the percentage of academic failure.[15]
These results call on all those involved, whether in health, education, scientific research, or other fields, to intervene to get to the bottom of the factors underlying this neurocognitive deficit, and thus respond appropriately to remedy the problem.
Declaration of patient consent
Patient’s consent not required as patients identity is not disclosed or compromised.
Conflicts of interest
There are no conflicts of interest.
Use of artificial intelligence (AI)-assisted technology for manuscript preparation:
The authors confirm that there was no use of artificial intelligence (AI)-assisted technology for assisting in the writing or editing of the manuscript and no images were manipulated using AI.
Financial support and sponsorship
Nil.
References
- Interactions entre attention et fonctions exécutives In: Fonctions exécutives et re-education. Paris: Masson; 2006.
- [Google Scholar]
- The neuropsychology of attention. Germany: Springer Science and Business Media; 2013.
- [CrossRef] [Google Scholar]
- Mechanisms underlying hemispatial neglect. Ann Neurol. 1979;5:166-70.
- [CrossRef] [PubMed] [Google Scholar]
- Orientational bias model of unilateral neglect: Evidence from attentional gradients within hemispace In: Unilateral neglect: Clinical and experimental studies. United Kingdom: Psychology Press; 2013. p. :71-94.
- [Google Scholar]
- Localization of a human system for sustained attention by positron emission tomography. Nature. 1991;349:61-4.
- [CrossRef] [PubMed] [Google Scholar]
- A compendium of neuropsychological tests: Administration, norms, and commentary United Kingdom: Oxford University Press; 2006.
- [Google Scholar]
- Sensitivity of clinical and behavioural tests of spatial neglect after right hemisphere stroke. J Neurol Neurosurg Psychiatry. 2002;73:160-6.
- [CrossRef] [PubMed] [Google Scholar]
- Differences in adult schooling on performance in the Bell Cancellation Test. Estud Psicol. 2012;17:215-22.
- [CrossRef] [Google Scholar]
- The bells test: A quantitative and qualitative test for visual neglect. Int J Clin Neuropsychol. 1989;11:49-54.
- [CrossRef] [Google Scholar]
- A battery for assessing spatial neglect: Norms and effects of age, educational level, sex, hand, and laterality. Rev Neurol. 2001;157:1385-400.
- [Google Scholar]
- Screening for attention deficit disorder (unilatéral spatial neglect) in a sample of junior high school students of M'rirt (Middle Atlas-Morocco) Int J Innov Appl Stud. 2014;9:10.
- [Google Scholar]
- Gender-and age-specific changes in motor speed and eye-hand coordination in adults: Normative values for the Finger Tapping and Grooved Pegboard Tests. Percept Mo Skills. 1993;76(3_suppl):1219-30.
- [CrossRef] [PubMed] [Google Scholar]
- Elaboration of an assessment for hemispatial neglect. The bells test In: Conference on: Attention, theoretical and clinical perspectives. Toronto: Rotnan Research Institute of Baycrest Center; 1992.
- [Google Scholar]
- Discriminating factors in personal, family and school life. Between internalized, externalized and concurrent behavioural problems in secondary 1 students. Rev Sci Éduc. 2000;26:197-218.
- [Google Scholar]
- Social-emotional factors affecting achievement outcomes among disadvantaged students: Closing the achievement gap. Educ Psychol. 2002;37:197-214.
- [CrossRef] [PubMed] [Google Scholar]
- Adult counting is resource demanding. Br J Psychol. 2004;95:19-30.
- [CrossRef] [PubMed] [Google Scholar]
- The role of working memory in mental arithmetic. Eur J Cogn Psychol. 2004;16:353-86.
- [CrossRef] [Google Scholar]
- Academic failure in secondary school: The inter-related role of health problems and educational context. In: Soc Probl. Vol 51. 2004. p. :569-86.
- [CrossRef] [PubMed] [Google Scholar]
- Representations of relationships to teachers, parents, and friends as predictors of academic motivation and self-esteem. J Early Adolesc. 1994;14:226-49.
- [CrossRef] [Google Scholar]
- The relationship of self-esteem to grades, achievement scores, and other factors critical to school success. Sch Couns. 1994;41:239-44.
- [Google Scholar]
- Evaluation of left visuospatial neglect: Norms and discrimination power of two tests. Neuropsychology. 1990;4:87-96.
- [CrossRef] [Google Scholar]


