
Translate this page into:
Platelet and Red Blood Cell Indices in Patients with Panic Disorder: A Receiver Operating Characteristic Analysis
Ramdas S. Ransing, MBBS, MD Department of Psychiatry, BKL Walawalkar Rural Medical College Sawarde, Chipalun, Ratnagiri, Maharashtra 415606 India ramdas_ransing123@yahoo.co.in
This article was originally published by Thieme Medical and Scientific Publishers Private Ltd. and was migrated to Scientific Scholar after the change of Publisher.
Abstract
Abstract
Objective Panic disorder (PD) is associated with changes in platelet and red blood cell (RBC) indices. However, the diagnostic or predictive value of these indices is unknown. This study assessed the diagnostic and discriminating value of platelet and RBC indices in patients with PD.
Materials and Methods In this cross-sectional study including patients with PD (n = 98) and healthy controls (n = 102), we compared the following blood indices: mean platelet volume (MPV), platelet distribution width (PDW), and RBC distribution width (RDW). The receiver operating characteristic (ROC) curve was used to calculate the area under the ROC curve (AUC), sensitivity, specificity, and likelihood ratio for the platelet and RBC indices.
Results Statistically significant increase in PDW (17.01 ± 0.91 vs. 14.8 ± 2.06; p < 0.0001) and RDW (16.56 ± 2.32 vs. 15.12 ± 2.43; p < 0.0001) levels were observed in patients with PD. PDW and mean corpuscular hemoglobin concentration had larger AUC (0.89 and 0.74, respectively) and Youden’s index (0.65 and 0.39, respectively), indicating their higher predictive capacity as well as higher sensitivity in discriminating patients with PD from healthy controls.
Conclusion PDW can be considered a “good” diagnostic or predictive marker in patients with PD.
Keywords
ROC curve
area under the curve
panic disorder
mean platelet volume
RBC indices

Introduction
Panic disorder (PD), a type of heterogeneous anxiety disorder, is characterized by unexpected, recurrent episodes of panic attacks with various somatic, physiological, and cognitive symptoms.1 Decades of research has failed to determine the exact pathophysiology of PD. Currently, the lack of serotonin (5-hydroxytryptamine), inhibition of the neuronal network, and faulty buffering of an oversensitive alarm system by endogenous opioids have been mainly hypothesized to explain the pathophysiology of panic attacks.2 3
Researchers have used peripheral serotonergic markers (e.g., serum serotonin levels and platelet indices) to explore the serotonergic dysfunction hypothesis.4 5 Among the platelet indices, the mean platelet volume (MPV) and platelet count were mostly studied,5 6 whereas platelet distribution width (PDW) and plateletcrit were poorly studied. Although MPV is extensively studied in patients with PD, the results are contradictory and suggest that MPV is a poor diagnostic marker.4 5 6 7 Furthermore, Almis et al in their study including a small group of patients with generalized anxiety disorder reported that MPV is a poor biochemical marker, indicating the need to explore other diagnostic markers.8
The simple inexpensive red blood cell (RBC) indices, such as RBC distribution width (RDW) and the RBC count, may have diagnostic and prognostic value in patients with PD.4 Studies have reported that both the platelet and RBC indices are altered in patients with depression, anxiety, psychosis, PD, or schizophrenia.9 10 11 RBC indices have not been studied extensively; thus, the role of RBC indices in patients with PD remain undetermined.4 Therefore, the clinical utility of these parameters is ambiguous.
Therefore, in this hospital-based study, the discriminating potential of platelet and RBC indices was assessed in patients with PD and healthy controls, and the cutoff value with the highest prediction was estimated in rural Indian patients with PD.
Materials and Methods
Study Population and Design
The cross-sectional and diagnostic study was conducted as per the principles of the Declaration of Helsinki and was approved by the Institutional Ethical Committee. The study was conducted at a tertiary care rural hospital for a period of 6 months.
Sample Size
To calculate the sample size, on the basis of a previous study,4 we considered MPV as a poor marker (area under the curve [AUC] = 0.7) for differentiating between patients with PD and healthy controls. We hypothesized that an alternative marker, namely PDW, may have increased accuracy for detecting PD and may be a “good” marker (AUC = 0.85). The sample size for the PD group and control group was calculated using the following parameters and receiver operating characteristic (ROC)12: type I error = 0.05; power = 80%; AUC for MPV under null hypothesis = 0.70; AUC for PDW under null hypothesis = 0.70; AUC for MPV under alternate hypothesis = 0.70; AUC for PDW under alternate hypothesis = 0.85; and allocation ratio = 1. Thus, for comparing the two diagnostic markers, a sample size of more than 96 in each group was considered sufficient for the study.
Participants
Patients receiving psychiatric emergency services at the tertiary care rural hospital were invited to participate in the study. This study included 98 patients aged 18 to 45 years who were diagnosed as having PD. Diagnostic and Statistical Manual of Mental Disorder (Fifth Edition [DSM-5]) was used for the diagnosis of PD.13 Patients with substance use, comorbid major depression, psychotic disorder, dysthymia, acute or chronic medical illness, diabetes mellitus, cardiovascular diseases, cancer, pregnancy, neurologic/neurodevelopmental disorder, smoking, generalized anxiety disorder, and hematological disorder were excluded from the study.
Healthy Controls
In this study, 102 age- and sex-matched healthy controls were recruited from the general community. None of them received any medication, and the exclusion criteria were considered during their recruitment. Informed consent was obtained from all patients and healthy controls prior to their participation in this study.
Clinical and Laboratory Assessment
Sociodemographic data, RBC and platelet indices were collected from patients with PD and healthy controls fulfilling the inclusion and exclusion criteria who also provided written informed consent. Blood samples (5 mL) were drawn from the antecubital vein of patients with PD and of the healthy controls under all aseptic precautions. The blood samples were collected into tubes containing EDTA (ethylenediaminetetraacetic acid) and were processed within 30 minutes of blood collection. RBC indices, platelet indices, and other blood parameters were measured using a fully automated coulter (Ac.T diff 2/02020, Beckman Coulter), and these were further confirmed through peripheral smear examination. Standard reference values were used for the interpretation of all parameters.14
Statistical Analysis
Statistical analysis was performed using the SPSS software, version 21 (SPSS Inc., Chicago, Illinois, United States). Descriptive parameters are expressed as mean, standard deviation, or percentage. Normality of the distribution for variables was tested using the Shapiro–Wilk normality test. The unpaired t-test and Pearson chi-square test were used to test normally distributed variables. The Mann–Whitney U test was used for the analysis of nonnormally distributed variables. The diagnostic value of platelet indices (MPV and PDW) and RBC indices (RDW) was evaluated through ROC curve analysis. AUC and Youden’s index were used to compare the diagnostic value of each parameter. A p-value of less than 0.05 was considered statistically significant.
Results
Sample Characteristics
The Shapiro–Wilk normality test (p > 0.05), and a visual inspection of normal Q-Q plots, their histograms, and box plots showed that the study data for hemoglobin (Hb) and hematocrit were normally distributed for both the PD and healthy control groups. The remaining blood parameters failed to pass the normality test.
Sociodemographic and Hematological Characteristics
Table 1 presents a comparison of sociodemographic and hematological characteristics of patients with PD and healthy controls. No significant difference was observed in age and gender between the two groups (p > 0.05 and p = 0.15, respectively).
|
Variables |
Panic disorder (n = 98), mean ± SD (mean rank) |
Healthy controls (n = 102), mean ± SD (mean rank) |
p-Values |
|---|---|---|---|
|
Abbreviations: fL, femtoliters; MCH, mean corpuscular hemoglobin; MCHC, mean corpuscular hemoglobin concentration; MCV, mean corpuscular volume; MPV, mean platelet volume; PDW, platelet distribution width; RBC, red blood cell; RDW, red cell distribution width; SD, standard deviation. aMann–Whitney U-test bChi-square test cUnpaired t-test. dhighly significant (p < 0.01) every highly significant (p < 0.001) fsignificant (p < 0.05) |
|||
|
Age (years)a |
29.05 ± 8.18 (102) |
28.54 ± 7.36 (100) |
p > 0.05 |
|
Genderb (%) |
|||
|
Male |
30 (30.61%) |
41 (40.20%) |
χ2 = 2.00; df = 1; p = 0.16 |
|
Female |
68 (69.39%) |
61 (59.80%) |
|
|
RBC indices |
|||
|
Hemoglobin (gm/dL)c |
11.91 ± 1.88 |
11.54 ± 2.37 |
t = 1.23; df = 199; p = 0.21 |
|
RBC count (×1012/L)a |
4.335 ± 0.58 (109.2) |
4.103 ± 0.81 (93.23) |
p = 0.05 |
|
Hematocrit (%)c |
36.28 ± 5.07 |
33.89 ± 6.77 |
t = 2.82; df = 199; p = 0.005d |
|
MCV (fL)a |
84.22 ± 10.13 (105.5) |
83.08 ± 10.93 (96.7) |
p = 0.28 |
|
MCH (pg)a |
27.67 ± 3.86 (97.15) |
28.27 ± 4.60 (104.7) |
p = 0.36 |
|
MCHC (g/L)a |
32.77 ± 1.31 (75.31) |
34.02 ± 1.53 (125.4) |
p < 0.0001e |
|
RDW (%)a |
16.56 ± 2.32 (123.3) |
15.12 ± 2.43 (79.82) |
p < 0.0001e |
|
Platelet indices |
|||
|
Platelet count (×109/L)a |
268.6 ± 69.64 (110.6) |
245.2 ± 92.09 (91.86) |
p = 0.02f |
|
MPV (fL)a |
7.52 ± 0.89 (74.87) |
8.46 ± 1.05 (125.9) |
p < 0.0001e |
|
Plateletcrit (%)a |
0.20 ± 0.05 (98.65) |
0.20 ± 0.07 (103.2) |
p = 0.57 |
|
PDW (%)a |
17.01 ± 0.91 (142.2) |
14.8 ± 2.06 (61.84) |
p < 0.0001e |
Among the RBC indices, the RDW level was higher and was highly significant in the PD group than in the control group (16.56 ± 2.32 vs. 15.12 ± 2.43; p < 0.0001). In addition, the mean corpuscular hemoglobin concentration (MCHC) level was lower in the PD group than in the control group (32.77 ± 1.31 vs. 34.02 ± 1.53; p < 0.0001). The PD group showed a significant increase in hematocrit compared with the control group (36.28 ± 5.07 vs. 33.89 ± 6.77; p < 0.001).
Among the platelet indices, PDW was higher and highly significant in the PD group than the control group (17.01 ± 0.91 vs. 14.8 ± 2.06; p < 0.001), whereas the MPV level was significantly lower in the PD group than the control group (7.52 ± 0.89 vs. 8.46 ± 1.05 fL; p < 0.001). In addition, the PD group showed a high platelet count compared with the control group (268.6 ± 69.64 × 10⁹ L−1 vs. 245.2 ± 92.09 × 10⁹ L−1; p = 0.02). Furthermore, no statistically significant difference was observed in Hb, RBC count, MCH, MCV, and plateletcrit between the PD and control groups.
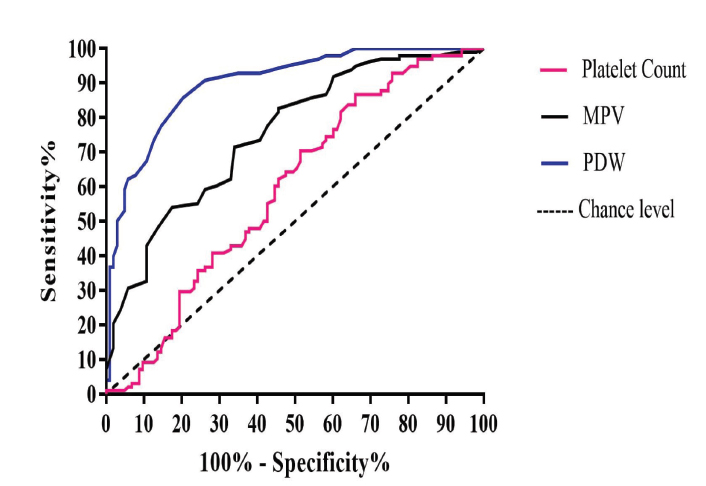
The RBC and platelet indices showing significant differences between the PD and control groups were further analyzed using AUC. Of all the hematological parameters examined, PDW had favorable diagnostic value for PD (AUC: 0.89; 95% CI: 0.85–0.94; p < 0.001) (Table 2). The AUC for MCHC, MPV, and RDW was almost similar (0.74, 0.75, and 0.71, respectively), suggesting their favorable diagnostic value for PD. The AUC was smaller for hematocrit and platelet count than other studied indices (0.60 and 0.59, respectively). The ROC curves of MPV, PDW, and MCHC shifted to the upper left of the graph, which indicates that these parameters can adequately distinguish between patients with PD and healthy controls (Fig. 1).
|
Indices |
Cutoff value |
AUC |
Sensitivity % |
Specificity % |
Youden’s index |
Likelihood ratio |
|---|---|---|---|---|---|---|
|
Abbreviations: fL, femtoliters; MCHC, mean corpuscular hemoglobin concentration; MPV, mean platelet volume; PDW, platelet distribution width; RBC, red blood cell; RDW, red cell distribution width. |
||||||
|
RBC indices |
||||||
|
Hematocrit (%) |
(>33.9) |
0.60 |
70.41 |
45.63 |
0.16 |
1.29 |
|
RDW (%) |
(>15.05) |
0.71 |
61.22 |
63.11 |
0.24 |
1.66 |
|
MCHC (g/L) |
(<34.05) |
0.74 |
82.65 |
57.28 |
0.39 |
1.93 |
|
Platelet indices |
||||||
|
PDW (%) |
(>16.05) |
0.89 |
85.71 |
79.61 |
0.65 |
4.20 |
|
MPV (fL) |
(<8.35) |
0.75 |
82.65 |
54.37 |
0.37 |
1.81 |
|
Platelet count (×109/L) |
(>250.5) |
0.59 |
56.12 |
55.34 |
0.11 |
1.25 |
-
Fig. 1 Receiver operating characteristic curves of MPV, PDW, and platelet count. MPV, mean platelet volume; PDW, platelet distribution width.
Fig. 1 Receiver operating characteristic curves of MPV, PDW, and platelet count. MPV, mean platelet volume; PDW, platelet distribution width.
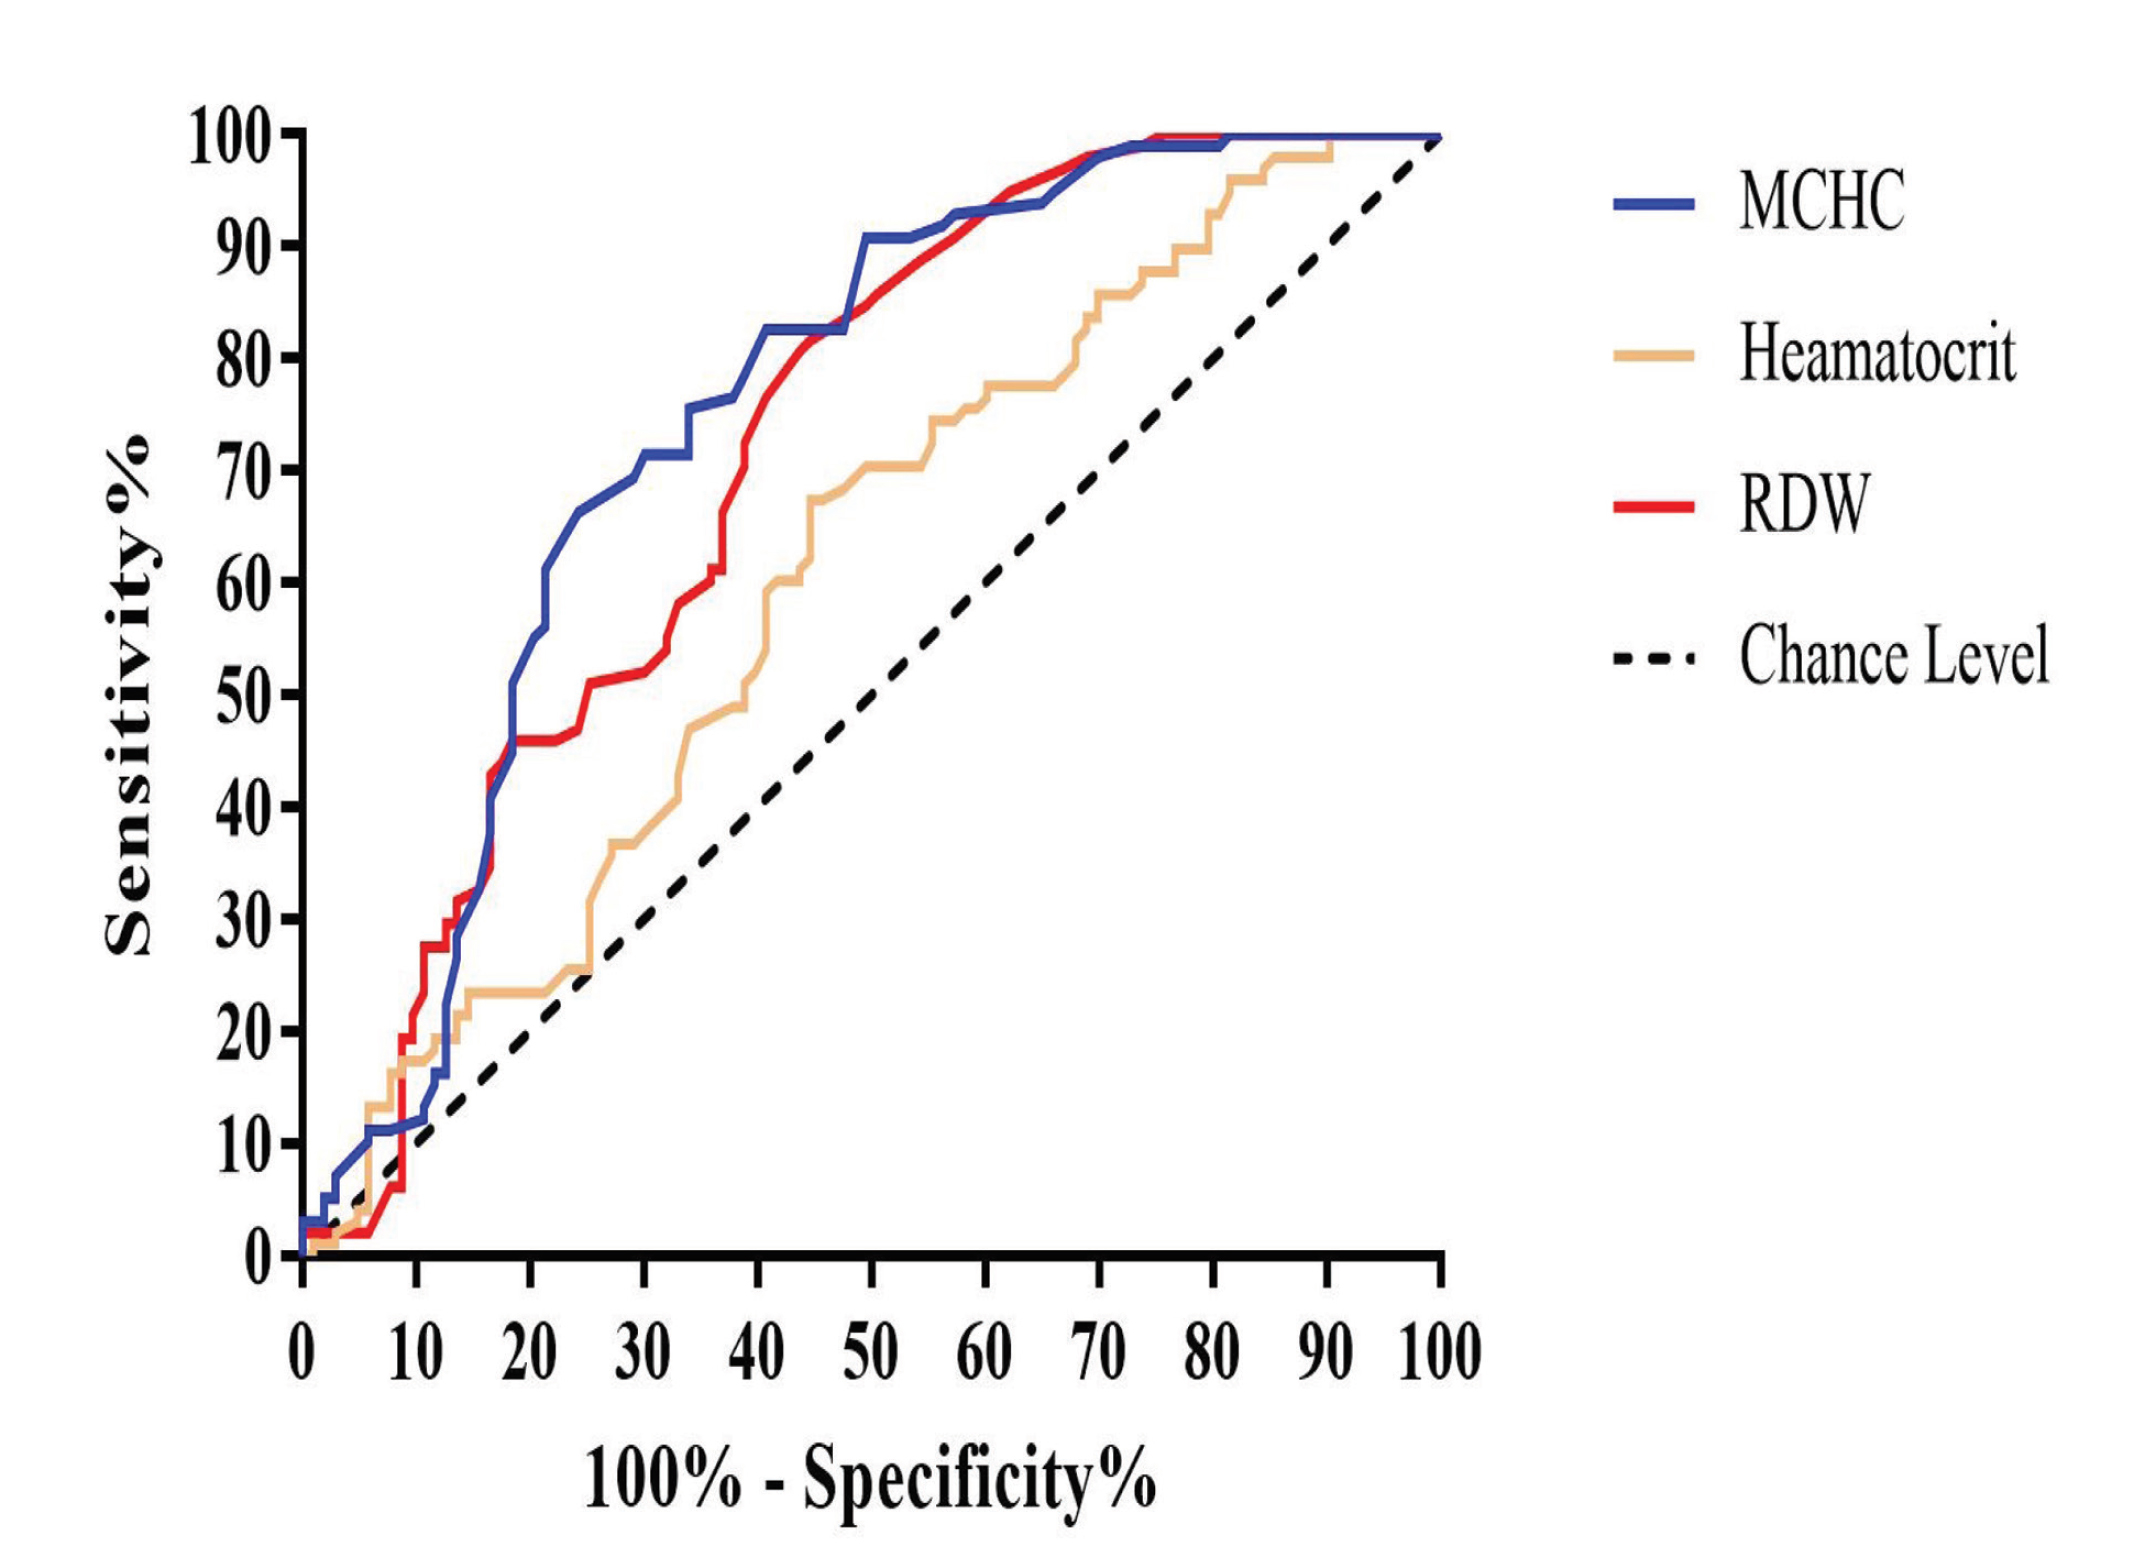
Using a cutoff point (>16.05%) of PDW, the sensitivity, specificity, and likelihood ratio for PD were 85.71%, 79.61%, and 4.20, respectively (Table 2; Fig. 1). Using a cutoff value (<8.35 fL) of MPV, the sensitivity, specificity, and likelihood ratio for PD were 82.65%, 54.37%, and 1.81, respectively. Finally, using a cutoff (>15.05%) of RDW, the sensitivity, specificity, and likelihood ratio for PD were 61.22%, 63.11%, and 1.66, respectively (Table 2; Fig. 2). PDW had a higher Youden index (0.65) than the other studied indices.
-
Fig. 2 Receiver operating characteristic curves of hematocrit, RDW and MCHC. MCHC, mean corpuscular hemoglobin concentration; RDW, red cell distribution width.
Fig. 2 Receiver operating characteristic curves of hematocrit, RDW and MCHC. MCHC, mean corpuscular hemoglobin concentration; RDW, red cell distribution width.
Discussion
Our study finding showed that PDW is a simple, efficient, and sensitive parameter for discriminating between patients with PD and healthy controls. Recently, platelet indices such as MPV, PDW, and platelet count have gained popularity in differentiating patients with PD from healthy controls.4 5 6 7 Platelets are dynamic blood particles whose primary functions are hemostasis and thrombosis.15 In addition, platelets contribute to the inflammatory process, which is involved in the etiopathogenesis of psychiatric disorders including PD.4 5 6 7 Thus, platelet indices are considered important biomarkers of psychiatric disorders including PD. Platelet activation has been reported in patients with psychiatric disorders including PD.2 16
In this study, we found that PDW had the highest sensitivity, specificity, and AUC at a cutoff value of >16.05%, indicating its superiority over other studied platelet indices such as MPV and platelet count. PDW measures the volume variability in platelet size, changes with platelet activation, and reflects the heterogeneity in platelet morphology.17 Under physiological conditions, PDW and MPV usually change in the parallel direction and have a direct relationship.18 However, the relationship may be altered under pathological inflammatory conditions.18 We found an increased level of PDW and a reduced level of MPV in patients with PD, which supports the inflammatory etiology of PD.4 6 18 However, Kokacya et al and Asoglu et al have reported an elevated level of MPV in patients with PD.5 7 This may be because the study participants were without any comorbid illness such as dysthymia and depression and were adequate in sample size in this study.
An elevated level of MPV indicates a high grade of inflammation, whereas a low level of MPV is associated with a low grade of inflammation.17 The low levels of MPV in our study suggest that PD is a chronic illness characterized by a low grade of inflammation. Moreover, the AUC (0.75) and Youden’s index (0.37) of MPV indicate its poor diagnostic and predictive value for PD. This may be the reason for previously published contradictory and inconclusive results.4 5 6 7 18 In addition, MPV has poor diagnostic value in patients with generalized anxiety disorder.8
In this study, among the RBC indices, MCHC had the highest AUC, sensitivity, specificity, and Youden’s index. Moreover, we found low MCHC level in patients with PD; this finding is consistent with previous findings.4 The increased RDW level in patients with PD supports the finding of a previous study.4 7 RDW is a numerical measure of the size variability of circulating RBC and has been reported to be a strong and independent predictor in patients with cardiovascular disease.19 Therefore, in patients with PD, RDW and MCHC can be considered the novel and independent prognostic factors. However, prospective interventional studies are required to demonstrate the role of RDW and MCHC in patients with PD.
Previous studies have highlighted that platelet count, RBC count, hematocrit, and plateletcrit are potential biomarkers.4 5 6 7 In this study, ROC analysis and Youden’s index indicate that these indices are not useful to diagnose or predict PD. In addition to PD, hematological indices such as MPV, PDW, and RDW are affected in patients with depression,20 21 generalized anxiety disorder,8 bipolar disorder,22 or schizophrenia.10 This suggests that these indices may discriminate patients with PD or psychiatric illness from the healthy population. However, they may not be useful to discriminate between patients with PD and those with schizophrenia or depression. Therefore, a comparative study with an adequate sample size of patients with bipolar disorder, schizophrenia, PD, depression, or generalized anxiety disorder and healthy controls is required to explore the clinical significance of these hematological indices.
Strengths, Limitations, and Future Direction
This is the first study to estimate the diagnostic or predictive value of platelet or RBC indices in patients with PD. We elucidated sensitivity, specificity, AUC, and likelihood ratio for PDW, MPV, RDW, MCHC, platelet count, and hematocrit, which have relevance in clinical practice. The clustering of positive indices with high sensitivity and specificity may help researchers define or discriminate patients with PD from healthy controls or patients with other psychiatric illnesses.
Although the study was conducted with an adequate sample size and with a power of 80%, the relationship between disease severity and RBC or platelet indices was not studied. The study was conducted at a specific hospital, limiting the generalizability of findings. Specific inflammatory markers such as interleukins and cytokines, which may affect these indices, were not estimated. Further research should focus on a large set of the clinical population involving patients with depression, bipolar disorder, or schizophrenia, with the standardization of biomarkers, estimation of their specificity, and evaluation of their relevance in clinical practice.
Conclusion
Platelet or RBC indices, in particular PDW and MCHC, can discriminate patients with PD from healthy controls. At present, no diagnostic marker is available for any psychiatric disorder, and PDW can be considered an effective marker for separating patients with PD from healthy subjects. Future studies comparing various combinations of RBC/platelet indices with clinical scales are needed to evaluate the clinical utility of these indices in patients with PD.
Conflict of Interest
None declared.
References
- Subtypes of panic attacks: a critical review of the empirical literature. Depress Anxiety. 2009;26(10):878-887.
- [Google Scholar]
- Translational approach to the pathophysiology of panic disorder: focus on serotonin and endogenous opioids. Neurosci Biobehav Rev. 2017;76:48-55. (Pt A)
- [Google Scholar]
- The neurobiology of panic: a chronic stress disorder. Chronic Stress. 2017;1:2470547017736038.
- [Google Scholar]
- Mean platelet volume and platelet distribution width level in patients with panic disorder. J Neurosci Rural Pract. 2017;8(2):174-178.
- [Google Scholar]
- Increased mean platelet volume in patients with panic disorder. Neuropsychiatr Dis Treat. 2015;11:2629-2633.
- [Google Scholar]
- Decreased mean platelet volume in panic disorder. Neuropsychiatr Dis Treat. 2014;10:1665-1669.
- [Google Scholar]
- Mean platelet volume and red cell distribution width levels in initial evaluation of panic disorder. Neuropsychiatr Dis Treat. 2016;12:2435-2438.
- [Google Scholar]
- Mean platelet volume level in patients with generalized anxiety disorder. Psychiatr Clin Psychopharmacol. 2018;28:43-47.
- [Google Scholar]
- Unrecognized prevalence of macrocytosis among the patients with first episode of psychosis and depression. Indian J Psychol Med. 2018;40(1):68-73.
- [Google Scholar]
- Mean platelet volume in schizophrenia unaltered after 1year of clozapine exposure. Schizophr Res. 2014;157:134-136. (1-3)
- [Google Scholar]
- Mean platelet volume in bipolar disorder: the search for an ideal biomarker. Neuropsychiatr Dis Treat. 2016;12:2057-2062.
- [Google Scholar]
- easyROC: an interactive web-tool for ROC curve analysis using R language environment. RJ. 2016;8(2):213-230.
- [Google Scholar]
- American Psychiatric Association. In: Diagnostic and Statistical Manual of Mental Disorders, Fifth Edition (DSM-5). Washington, DC: American Psychiatric Association; 2013.
- [Google Scholar]
- Harrison's Principles of Internal Medicine. (19th ed). New York, NY: McGraw-Hill; 2015. p. :2754-2769.
- [Google Scholar]
- Circulating platelets as mediators of immunity, inflammation, and thrombosis. Circ Res. 2018;122(2):337-351.
- [Google Scholar]
- The use of platelet indices, plateletcrit, mean platelet volume and platelet distribution width in emergency non-traumatic abdominal surgery: a systematic review. Biochem Med (Zagreb). 2016;26(2):178-193.
- [Google Scholar]
- Platelet distribution width: a simple, practical and specific marker of activation of coagulation. Hippokratia. 2010;14(1):28-32.
- [Google Scholar]
- High red blood cell distribution width is closely associated with risk of carotid artery atherosclerosis in patients with hypertension. Exp Clin Cardiol. 2010;15(3):37-40.
- [Google Scholar]
- Mean platelet volume in patients with major depression: effect of escitalopram treatment. J Clin Psychopharmacol. 2009;29(4):368-371.
- [Google Scholar]
- Association of mean platelet volume with DSM-IV major depression in a large community-based population: the MELEN study. J Psychiatr Res. 2012;46(3):298-302.
- [Google Scholar]
- Platelet parameters (PLT, MPV, P-LCR) in patients with schizophrenia, unipolar depression and bipolar disorder. Psychiatry Res. 2016;237:238-245.
- [Google Scholar]


