
Translate this page into:
Epidemiological Profiling and Trends of Primary Intracranial Tumors: A Hospital-Based Brain Tumor Registry from a Tertiary Care Center
Mukesh Kumar, MS, MCh Department of Neurosurgery, SMS Medical College Jaipur, Rajasthan India drmannu84@gmail.com
This article was originally published by Thieme Medical and Scientific Publishers Pvt. Ltd. and was migrated to Scientific Scholar after the change of Publisher.
Abstract
Abstract
Background and Objectives Hospital-based cancer registry is an essential tool for augmentation of the standard of care, administration motive, and resource for population-based cancer registries. Here, we presented hospital-based brain tumor registry (HBBTR) to outline a comprehensive epidemiological data, both clinical and histopathological, as well as trends of central nervous system tumors. In addition, we compare this data with national brain tumor data as well as an international brain tumor registry.
Materials and Methods For the generation of this 7-year HBBTR data of all primary intracranial tumors operated, diagnosed, and registered at the Department of Pathology, Sawai ManSingh, between January 1, 2013 and December 31, 2019, was collected, analyzed, and compared with Tata Memorial Hospital, National Institute of Mental Health and Neurosciences, and Central Brain Tumor Registry of the United States.
Results A total of 3,526 patients were of primary intracranial tumors. Out of which, male patients were 1,982 (56.2%), while 1,544 (43.8%) were female patients. Maximum proportion of tumors was in fifth decade. Overall, pediatric and adult patients constituted of 15.5 and 84.5% of the cases, respectively. Among all primary intracranial tumors, meningiomas (20%) were most common followed by glioblastoma multiformat (18%) and least common were germ cell tumors (0.1%) followed by pineal tumors (0.3%). In pediatric cohort astrocytic tumors (30.1%) are most common followed by embryonal tumors (20.8%), while in adults meningiomas (23.1%) were most common followed by glioblastomas (20.3%). Our registry showed similar trends of tumors with national data as compared with international data in median age of presentation.
Conclusion This HBBTRs provide prevalence of primary intracranial tumors at a tertiary care center and could be a part of population-based registry.
Keywords
epidemiology
hospital-based cancer registry
primary intracranial tumors

Introduction
Cancer is a global disease and one of the preeminent causes of morbidity and mortality worldwide, with ~14 million new cases in 2012. Cancer was accountable for 8.8 million deaths in 2015; being the second most common cause of death globally after cardiovascular disease.1 Because of lack of infrastructure, low health budget, late-stage presentation, inaccessible diagnosis, and treatment, it causes ~70% of deaths in low- and middle-income countries.1 2
Cancer registry studies have pivotal role to find out epidemiology and patterns of cancer as well as precise measurement of the incidence trends. So, in future they will be helpful for designing infrastructure, upgrading diagnostic procedures and treatment facilities, and executing necessary screening programs for a wide variety of cancers.3 Population-based cancer registries (PBCRs) gather data on cancer occurrence in demarcated populations, clearly highlighting public health challenges. In resource-limited setting, they uplift the standard for enhanced and unbiased cancer care by delivering information for epidemiological studies and recognizing intervention preferences.4 However, hospital-based cancer registries (HBCRs) administer information to hospital management and policy makers about patients treatment needs by documentation of cases in specific hospitals for best care. These registries built a fundamental part of all PBCRs, helped in assessing cancer patient survival but do not supply cancer incidence rate statistics.5
Tumors of central nervous system (CNS) represent the 17th most common cancer worldwide and account for 1 to 2% of all tumors. Although CNS tumors are not frequent but the effect on healthcare systems is out of proportion with incidence due to the high rate of mortality and morbidity leading to relatively poor survival rate.6
For making large-scale contribution nationally, generation of hospital-based brain tumor registry (HBBTR) data for epidemiology and trends of intracranial tumors is important in Indian population, similar to the ones done internationally.7 For comparison of data of CNS tumors with previous and future studies, as well as world literature, HBBTRs would provide us necessary clinical benchmark. Such data would be invaluable not only in highlighting healthcare and policy needs of the nation but also in directing academic research into brain tumors.
In India, availability of robust statistical data for use in national cancer registries and epidemiology studies is limited as few studies on brain tumors are available in India coming from major institutes such as Tata Memorial Hospital (TMH), Mumbai, All India Institute of Medical Sciences, Delhi, and National Institute of Mental Health and Neurosciences (NIMHANS), Bangalore, which could aid in the calculation of accurate incidence rates for various brain tumors in our country.8 9 10 In addition, some epidemiological studies in India have focused solely on the pediatric population.11 12
Aims and Objectives
The aims of this study are (1) to outline a comprehensive epidemiological data, both clinical and histopathological, as well as trends of CNS tumors (according to the World Health Organization [WHO] 2016 classification) at the Sawai ManSingh (SMS) medical college and attached hospitals, Jaipur, India; (2) to provide significant data for designing and administering specialty healthcare services in the planning of disease elimination and control projects, in analytic activities and for brain tumor clinicians. In addition, we compare this data with data from TMH Mumbai, (NIMHANS), Bangalore, as well as an international brain tumor registry—the Central Brain Tumor Registry of the United States (CBTRUS).
Materials and Methods
For the generation of this 7-year HBBTR data of all primary intracranial tumors operated, diagnosed and registered at the Department of pathology, SMS, between January 1, 2013 and December 31, 2019 was collected. Information about patient’s age, sex, histological diagnosis, and tumor classification were entered into our database and did not involve any patient’s personal information or any implication on the management protocol. A total of 4,718 patient details were collected and evaluated. All tumors were assorted based on the WHO 2016 classification. All primary intracranial neoplasms and tumors of the pituitary gland (though not codified under WHO 2016) were also included in this registry, similar to CBTRUS.
Exclusion criteria were considered as spinal tumors, secondary tumors of the CNS (metastases), cases with incomplete clinical data, inconclusive pathology or differential diagnosis, bony tumors and benign nontumorous cystic lesions (arachnoid cysts, colloid cysts, epidermoid cysts, etc.) and duplicate records for the recurrent disease of the same patient; in that case, data from the first surgery were recorded if within the inclusion criteria. After excluding above, 3,526 cases of primary intracranial tumors were included in registry with complete case details. To remove errors in registration, documents of all registered patients were double-checked. According to CBTRUS data, cases were categorized as pediatric (0–18 years) and adult (>18 years) group. However, we have very limited resources and could not expect all the standard diagnostic procedures, including molecular and cytogenetic studies in our center; so, diagnosis was reclassified as tumors not otherwise specified.
Statistical Analysis
Data was entered in Microsoft excel spreadsheet and analyzed using SPSS version for Windows version 21.0. Quantitative variables were presented as mean and standard deviation whereas qualitative variables were presented as frequencies and proportion and graphs were generated for data visualization.
Results
Total number of patients registered in the Neuro Oncology services between the years 2013 and 2019 was 4,718. Out of which 3,526 patients were of primary intracranial tumors accounting for 74.4%. The proportion of primary intracranial tumors to all cases diagnosed at the Department of Pathology in SMS remained relatively consistent between 69 and 79% over this 7-year period (Fig. 1).

-
Fig. 1 Trends and distribution of all primary intracranial tumor cases versus total number of cases noted each year in our hospital-based brain tumor registry.
Fig. 1 Trends and distribution of all primary intracranial tumor cases versus total number of cases noted each year in our hospital-based brain tumor registry.
Demographics
The allocation of patients in proportion to gender, age, and grades of primary intracranial tumors is noted.
Distribution Based on Gender
The present registry consists of 1,982 (56.2%) male patients and 1,544 (43.8%) female patients. So, males slightly outnumbered females with male:female (M:F) ratio by 1.28.
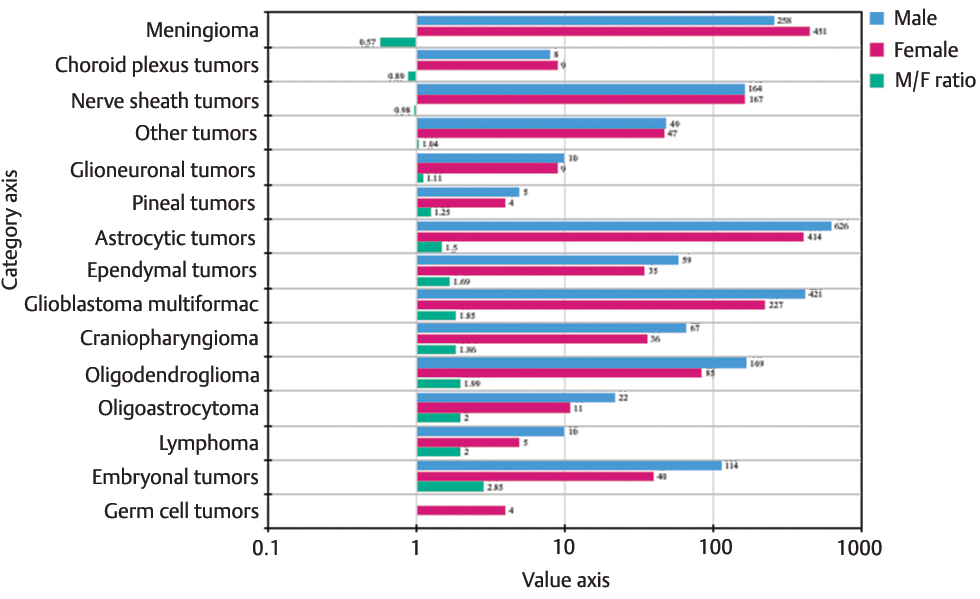
We also looked for the gender-wise distribution of all primary intracranial tumors for each histology. Most of the tumors showed male preponderance except meningiomas, choroid plexus tumors, and nerve sheath tumors. M:F ratio was as 2.85:1, 2:1, 2:1, 1.99:1, 1.86:1, 1.85:1 for embryonal tumors, lymphomas, oligoastrocytomas, oligodendrogliomas, craniopharyngioma, glioblastomas, and ependymomas, respectively. Meanwhile, meningiomas, choroid plexus tumors, and nerve sheath tumors showed a ratio of 0.57:1, 0.89:1, and 0.87:1, respectively. Some tumors demonstrated a relatively balanced ratio (Fig. 2).
-
Fig. 2 Gender-wise distribution of all primary intracranial tumors and M:F ratio.
Fig. 2 Gender-wise distribution of all primary intracranial tumors and M:F ratio.
Distribution Based on Age and WHO Grade
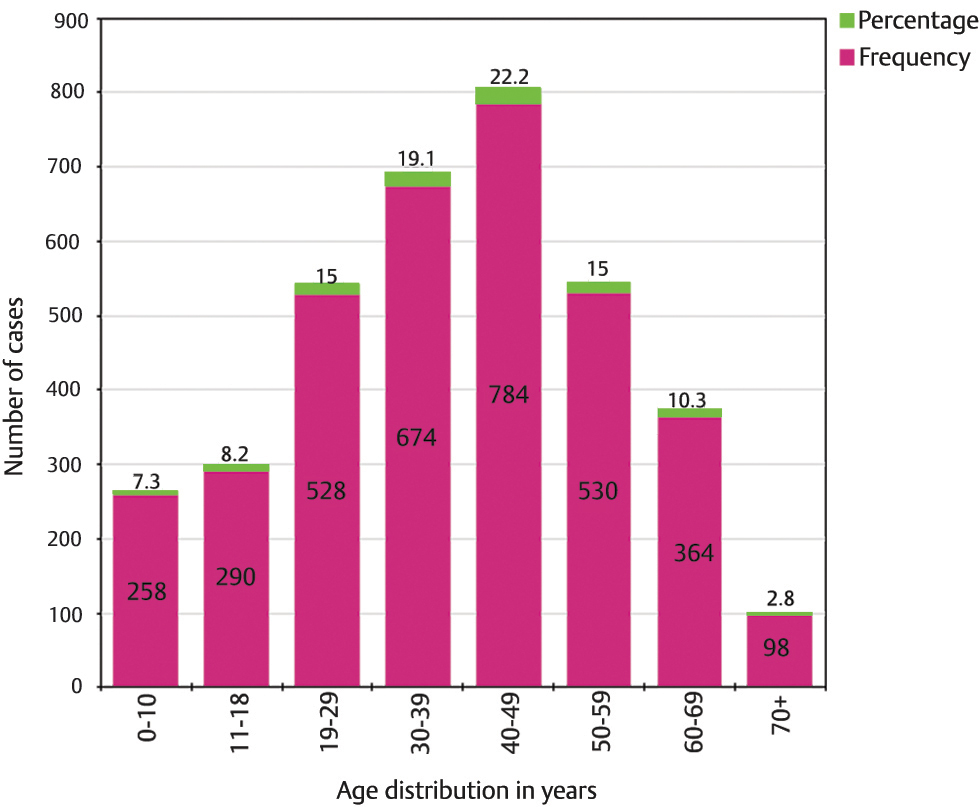
Upon age-wise distribution, it was noted that the highest fraction of intracranial tumors was diagnosed in the fifth decade, and 56.3% of all patients were adults between the ages of 30 and 60 years. About 7.3% proportion of the cohort had patients aged 10 years and below, whereas ~2.8% were aged 70 years and above (Fig. 3). Overall, pediatric and adult patients accounted for 15.5 and 84.5% of the cases, respectively. We observed the mean age of all tumors. Meningioma and glioblastoma patients had a mean age of 45.81 ± 14.16 and 45.94 ± 15.39 years, respectively.
-
Fig. 3 Distribution of all primary intracranial tumors based on age, demonstrating the number and corresponding percentage of cases for each age group.
Fig. 3 Distribution of all primary intracranial tumors based on age, demonstrating the number and corresponding percentage of cases for each age group.
In the registry, out of 3,526 cases, 3,025 cases (85.9%) were classified according to WHO grades. Overall, 38.6% tumors were WHO Grade I, 18% as Grade II, 6.5% as Grade III, and 22.8% as Grade IV tumors. About 14.1% of the cases remained unclassified with respect to WHO grading.
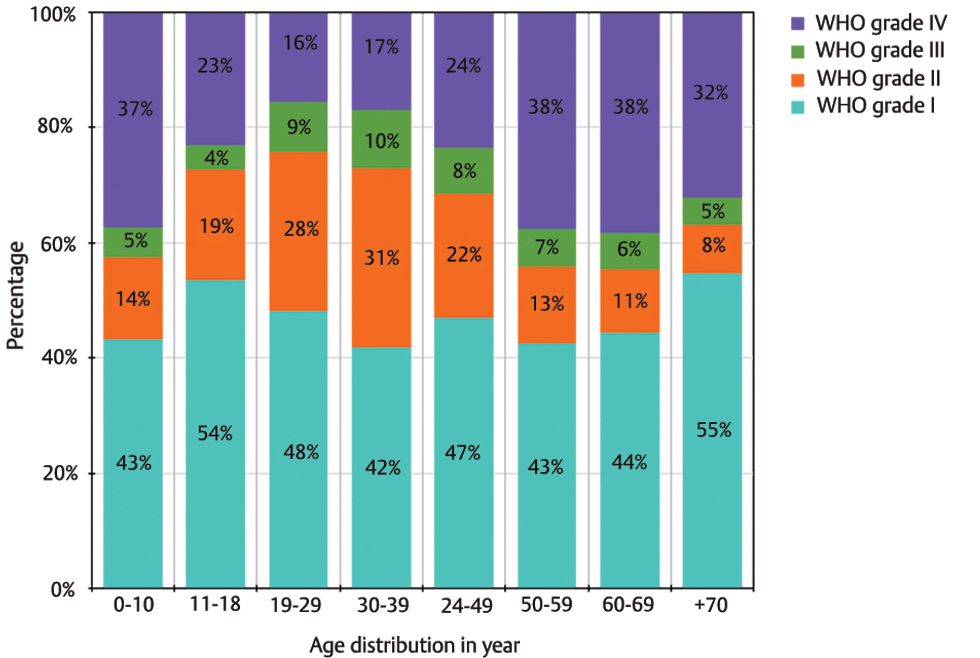
These were pituitary adenoma, lymphoma, and germ cell tumors. For the 3,025 codified tumors, we looked at the age-wise distribution along with percentage of each tumor grade. After excluding pediatric population, the results showed that with increasing age there was increase in proportion of Grade IV tumors. Inversely, with the exception of the pediatric age group, percentage of Grade I, II, and Grade III tumors were noticed to be consistently decreasing with increasing age. In the pediatric age group (0–18 years); Grade I tumors were most common, followed by Grade IV, Grade II, and Grade III tumors (Fig. 4).
-
Fig. 4 Age-wise distribution of tumors according to World Health Organization (WHO) Grade I, II, III, IV demonstrated as percentage of total cases within each age group.
Fig. 4 Age-wise distribution of tumors according to World Health Organization (WHO) Grade I, II, III, IV demonstrated as percentage of total cases within each age group.
Histopathology
In our cohort, we also analyzed the percentage distribution of all primary intracranial neoplasms based on tumor histology. Among all those, meningiomas were most common followed by glioblastoma multiformat and least common were germ cell tumors followed by pineal tumors (Fig. 5).

-
Fig. 5 Overall distribution of primary intracranial tumors (n = 3,526).
Fig. 5 Overall distribution of primary intracranial tumors (n = 3,526).
Subsequently, we segregated all primary intracranial tumors in two basic broad categories, that is, into pediatric (0–18 years, n = 548 [15.5%]), and adult (19 years and above, n = 2978 [84.5%]) population.
The spectrum of all primary intracranial tumors based on their histopathological diagnosis in these two groups is discussed in the following section.
Histological Distribution of Tumors in Pediatric Group
The largest proportion of tumors in the pediatric population was noted to be astrocytoma (30.1%) followed by embryonal tumors (20.8%) and craniopharyngioma (11.2%). Together, these three tumor types constituted more than 60% of all pediatric tumors (Fig. 6). Ependymomas, glioblastoma, oligodendroglioma, meningioma, nerve sheath tumors, pituitary adenoma other tumors (hemangioblastoma, solitary fibrous tumor/hemangiopericytoma and central neurocytoma), glioneuronal tumors, and choroid plexus tumors constituted 8, 7.8, 4.2, 3.6, 3.3, 2.6, 2.6, 2.4, and 2% of all tumors, respectively. Within embryonal tumors, medulloblastomas were most common followed by atypical teratoid/rhabdoid tumors (Fig. 6).

-
Fig. 6 Distribution of primary intracranial tumors in pediatric cohort (n = 548).
Fig. 6 Distribution of primary intracranial tumors in pediatric cohort (n = 548).
We also compared the prevalence of pediatric primary intracranial tumors reported from various centers in India (Table 1).
|
Institution |
Time period |
Total number of pediatric tumors |
Pediatric tumors as percentage (%) of total intracranial tumors |
|---|---|---|---|
|
Abbreviations: AIIMS, All India Institute of Medical Science; CMC, Christian Medical College; CSMMU, Chhatrapati Shahuji Maharaj Medical University; NIMHANS, National Institute of Mental Health and Neurosciences; PGIMER, Postgraduate Institute of Medical Education and Research; SMS, Sawai ManSingh; TMH, Tata Memorial Hospital. |
|||
|
AIIMS |
2002–2007 |
819 |
17 |
|
NIMHANS |
2010–2014 |
694 |
16.2 |
|
TMH |
2006–2007 |
288 |
21 |
|
CSMMU |
2003–2007 |
137 |
10 |
|
PGIMER, Chandigarh |
2003–2007 |
369 |
15 |
|
CMC, Vellore |
1990–2007 |
1297 |
10 |
|
GB Pant |
2003–2007 |
378 |
20.1 |
|
Current (SMS, Jaipur) |
2013–2019 |
548 |
15.5 |
Histological Distribution of Tumors in Adult Group
The study population included 2,978 histologically verified adult primary intracranial tumors. Overall, most common tumors were glial tumors contributing 44% of total tumors. However, individually meningiomas were most common and present in 23.1% (n = 689). This was followed by glioblastomas (20.3%), astrocytic tumors (15%), pituitary adenomas (13.9%), nerve sheath tumors (10.5%), oligodendroglial tumors (7.8%), and other tumors (2.8%). The less common tumors were ependymal tumors, craniopharyngioma, embryonal tumors, and oligoastrocytomas, accounting for <6%. The rarest tumors in this registry were lymphoma, choroid plexus tumors, glioneuronal tumors, and pineal tumors with a combined frequency of <1.5%. In adult group, no germ cell tumor was detected (Fig. 7).

-
Fig. 7 Distribution of primary intracranial tumors in adult cohort (n = 2,978).
Fig. 7 Distribution of primary intracranial tumors in adult cohort (n = 2,978).
Histological Distribution of Gliomas in the Adult versus Pediatric Group
In our cohort, we also exclusively analyzed distribution of gliomas in both groups. In the pediatric group, pilocytic astrocytomas were the most common (47.8%) glial tumors, constituting about half of all gliomas in children. Later ependymomas and glioblastomas were almost equal in number, 15.9 and 15.6%, respectively. Meanwhile, in adults the common tumors were glioblastomas, followed by diffuse astrocytoma and oligodendroglioma with a frequency of 44.3%, 17.5%, and 10.8%, respectively (Fig. 8).

-
Fig. 8 Distribution of gliomas in adult and pediatric groups.
Fig. 8 Distribution of gliomas in adult and pediatric groups.
Comparison with Western and Indian Literature
In our HBBTR data, we compared primary intracranial tumors based on histology and clinical parameters such as median age at diagnosis with world literature, as well as Indian data (Table 2). We noted that meningiomas were most common followed by glioblastomas in all primary intracranial tumors except TMH data and percentage of frequency for meningioma was similar with NIMHANS data and for glioblastomas with CBTRUS data. For almost all histologies, the median age at diagnosis was similar between the TMH, NIMHANS, and SMS data, marginally varying by just 1 to 5 years for most lesions except pineal tumors where variation in median age was >5 years. Median age for meningioma, glioblastoma, pituitary adenoma, nerve sheath tumors, anaplastic astrocytomas, lymphomas, and craniopharyngioma was significantly different in CBTRUS data and Indian data; it was almost one or two decades later in CBTRUS data. Median age for oligodendrogliomas, ependymomas, and embryonal tumors was almost similar in Indian data and CBTRUS data.
|
Primary ICT |
SMS data (2013–2019) |
TMH data (2013) |
NIMHANS data (2010–2014) |
CBTRUS data (2006–2010) |
||||
|---|---|---|---|---|---|---|---|---|
|
Frequency in % |
Median age (y) |
Frequency in % |
Median age (y) |
Frequency in % |
Median age (y) |
Frequency in % |
Median age (y) |
|
|
Abbreviations: CBTRUS, Central Brain Tumor Registry of the United States; ICT, intracranial tumors; NIMHANS, National Institute of Mental Health and Neurosciences; NA, not available; NOS, not otherwise specified; PGIMER, Postgraduate Institute of Medical Education and Research; SMS, Sawai ManSingh; TMH, Tata Memorial Hospital. |
||||||||
|
Meningioma |
20.1 |
45.00 |
9% |
46.5 |
20.1 |
45 |
35.8 |
65 |
|
Glioblastoma multiforme, NOS |
18.4 |
48.00 |
29% |
50 |
13.9 |
50 |
15.6 |
64 |
|
Pituitary adenoma |
12.2 |
40.00 |
4% |
39 |
8.5 |
42 |
14.7 |
51 |
|
Nerve sheath tumors |
9.4 |
38.00 |
NS |
NA |
11.1 |
40 |
8.1 |
55 |
|
Diffuse astrocytoma, NOS |
7.4 |
35.00 |
13% |
NA |
0.54 |
37 |
6.1 |
47 |
|
Pilocytic astrocytoma |
6.1 |
16.00 |
NA |
16 |
5.5 |
14 |
NA |
13 |
|
Oligodendroglioma, NOS |
7.2 |
39.00 |
6% |
37 |
9.8 |
40 |
1.7 |
43 |
|
Embryonal tumors |
4.4 |
10.00 |
8% |
NA |
4.4 |
8 |
1.2 |
9 |
|
Craniopharyngioma |
2.9 |
16.00 |
NA |
20 |
NA |
22 |
0.8 |
42 |
|
Anaplastic astrocytoma, NOS |
2.7 |
38.50 |
NA |
36 |
3% |
36 |
NA |
54 |
|
Ependymal tumors |
2.7 |
20.50 |
4% |
18.5 |
4.7 |
18 |
1.9 |
19 |
|
Hemangioblastoma |
1.3 |
35.00 |
NA |
NA |
NA |
NA |
NA |
NA |
|
Solitary fibrous tumors/ Hemangiopericytoma |
0.9 |
42.00 |
NA |
NA |
NA |
NA |
NA |
NA |
|
Oligoastrocytoma |
0.9 |
38.00 |
NA |
NA |
4.1 |
36 |
0.9 |
42 |
|
Central neurocytoma |
0.6 |
20.50 |
NA |
NA |
NA |
NA |
NA |
NA |
|
Glioneuronal tumors |
0.5 |
18.00 |
NA |
NA |
NA |
21 |
NA |
27 |
|
Choroid plexus tumors |
0.5 |
12.00 |
NA |
NA |
NA |
12.5 |
NA |
19 |
|
Lymphoma |
0.4 |
50.00 |
NA |
NA |
NA |
50 |
2.1 |
65 |
|
Pineal tumors |
0.3 |
35.00 |
NA |
18.5 |
NA |
25.5 |
NA |
33 |
|
Unique astrocytic variants |
0.4 |
20.00 |
NA |
NA |
0.4 |
15 |
NA |
22 |
|
Germ cell tumors |
0.1 |
11.00 |
NA |
NA |
NA |
16 |
0.4 |
17 |
Follow-Up
In current cohort, mean time for surgery (admission to surgery) was 5.8 ± 1.4 days for high-grade tumors and 12.4 ± 3.2 days for low-grade tumors. During postoperative period, most common complication was metabolic derangement (7.2%), followed by wound-related complication and surgical site infection constituting 2.4% and least common was coagulation abnormality. Average reporting time after sample received in pathology department was 6.2 ± 1.1 days. In 6 months of postoperative period, a significant proportion (1,324 cases—35%) was lost to follow-up. Out of 648 patients of glioblastoma, 126 patients lost to follow-up and in remaining 522 cases 186 patients died during 6 months of follow-up. During this 6-month period; 18 cases (11.7%) of medulloblastoma, 3 cases of lymphoma, single case of ependymomas, and meningioma each succumbed due to disease.
Discussion
The burden of cancer in India will nearly double in the next 20 years, in relation to a project done by International Agency for Research on Cancer (IARC), GLOBOCAN.1 The principal elements of cancer control are prevention, early perception, identification and administration of therapy, and supportive care. So, key elements of a cancer control program are cancer registries as it includes systemic assembly, storage, evaluation, interpretation, and delineation of cancer-related statics.13 PBCRs and HBCRs are the two main types of cancer registry. PBCRs that are used for epidemiological studies and public health surveillance and whether HBCRs are important resource for planning and monitoring of cancer prohibition scheme as well as useful for the analysis and comparison of tumor occurrence with other countries lay ground for evidence-based brain tumor research. Hence, they play important role for the development of quality of care of cancer patients and addressing administrating challenges in hospitals.5 14 In the United States, the CBTRUS is an exclusive professional research institution that focuses entirely on producing quality statistical data on population regarding patterns and frequency of primary brain and CNS tumors.7 It is a high-quality, large-scale statistical data and a crucial resource to the long-term goal of cancer control, planning, and evaluation. Here, we compared our registry’s data with Indian as well as international data and noted both differences and similarities.
In our HBBTR, on assessing the demographics, percentage of male and female patients was 56 and 44%, respectively, similar to NIMHANS data; whereas it was noted inversely in CBTRUS report as 42 and 58%, respectively, that could be due to bias in seeking medical care as females are less aware and less literate for the treatment in Indian scenario.10
We analyzed for the patterns of gender distribution in tumors and noted that meningioma, nerve sheath tumors, and choroid plexus tumors showed a female predominance in our registry. Among these only meningiomas denoted similarity with NIMHANS and CBTRUS data with an M:F ratio of 2:1. Reason behind female predilection could be due to association of disease risk with the presence of sex hormone receptors in meningiomas.15 16 Among gliomas, glioblastoma is the most common glioma, showed a M:F ratio of 1.85:1, higher than that reported in CBTRUS report (1.57:1). Probable explanation for male predominance of glioblastomas is the occurrence of inactivation of the tumor suppressor retinoblastoma gene in glioblastoma twice more common in males in contrast to females demonstrated by study done by Sun et al.17
When we looked for age-wise distribution of tumors, we noted that in Indians there is trend of an early onset of brain tumor presentation as compared with international population, that is, median age of primary intracranial tumors such as meningiomas, glioblastomas, pituitary adenomas, nerve sheath tumors, craniopharyngiomas, and anaplastic astrocytomas presentation is one or two decades earlier in Indian registries (SMS, TMH, NIMHANS) as compared with CBTRUS. Such trends of early onset of disease in Indians are not exclusively limited to brain cancers but have also been noted for colorectal cancer, renal cell carcinoma, and breast cancer.18 19 20 The late occurrence of tumors in international population in contrast to Indians could be due to the better wellness programs in United States leading to longer average life expectancy (both sexes combined) of 79 years as compared with 66 years in India.21 In our cohort, median age at diagnosis for pineal tumors was seen to be later than Indian data but corroborating with US data. Only explanation of this could be long duration of data collection in our HBBTR (7 years) as compared with TMH (1 year) and NIMHANS (5 years).22
Further in our cohort, tumors in pediatric population (0–18 years) accounted for 15.5%, matching with Indian data with minor differences. While in CBTRUS report (0–19 years), they comprised of 6.6% of overall CNS tumors; this could be attributed to the sizeable percentage of young people in our country as compared with the US population.21 Astrocytic tumors (including glioblastoma) constituted most common form of all primary intracranial tumors (37.9%), followed by embryonal tumors (20.8%) in pediatric cohort. Both of them were equitable with results of study performed by Jain et al with national average of 34.7 and 22.4%, respectively.11 In adult population, meningiomas were most common (23.1%) followed by glioblastomas (20.3%) similar to NIMHANS cohort (23.2%) and (15.5%) with minor variation in frequency percentage.
On analyzing individual glial tumors, pilocytic astrocytomas were most common in pediatric cohort (47.8%) and glioblastomas in adult group (44.3%), corroborating with NIMHANS data.
Brain tumors are heterogeneous because they differ not only in their histomorphological features but also have a distinct biological background and disease course. Since the global trends of brain cancer are increasing irrespective of age, preventive and protective measures to reduce the risk factors of this cancer are recommended to reduce the incidence of the disease. But brain tumors have been considered as an orphan disease due to small in number as compared with other cancers as well as relatively limited sponsorship to study these tumors. Meanwhile, the epidemiologic reports on brain tumors are, in many areas, still ambiguous; there are many optimistic areas to trace in forthcoming studies.23 The etiology of CNS tumors is complex and has multifactorial risk factors. The predominant brain tumors are meningiomas and gliomas that vary significantly in histological type, age at diagnosis, gender, race, and country. On comparing with national and international population, the crucial elements imparting the observed distinctions in data gathered from geographically heterogenous populations are gene environment and gene–gene interactions. Consequently, such interactions warrant well designed, large-scale, and statistically accurate studies to elucidate the different risk factors.15
As our cohort included the histopathologically confirmed brain tumor cases, it has generated some interesting insights and corroborating patterns into the prevalence of primary intracranial tumors. It also had certain limitations that need to be considered. The data are based on a single tertiary center’s record in North India and may not entirely exhibit the profile of whole community. Being a tertiary government institute, it also measures many mystifying elements, such as bias in referral patterns as well as toward the low socioeconomic status.
Conclusion
HBCR is a major resource for administrative planning and provides essential and effective information for tracking trends of cancer care plans over time and patterns of care in different institutions as well an important resource for PBCSs. However, HBCRs are usually expensive and do not receive enough support from IARC or other international communities. So, a single-institute HBBTR gives a quick look for the diverse distribution of brain tumors, but is of limited use. There should be a collaborative study in various hospitals of country to make a nationally representative data regarding incidence of brain tumors. Due to economic reasons in developing countries, a widespread database is a dream yet to attain. Hence, for better understanding of the epidemiological profile, etiology, incidence, and mortality of brain tumors, such registries could be useful for providing a base line as well as robust data that eventually could be stored in HBCRs and PBCSs.
Ethical Approval
Ethical approval not required as this was a retrospective analysis of brain tumors, which involved the archival tumor blocks and clinicopathological data and didn’t involve any patient’s personal information or any implication on the management protocol. Hence, according to the principles of the Helsinki Declaration, no ethical approval required.
Conflict of Interest
None declared.
Funding None.
References
- Cancer incidence and mortality worldwide: sources, methods and major patterns in GLOBOCAN 2012. Int J Cancer. 2015;136(5):E359-E386.
- [Google Scholar]
- Costs, affordability, and feasibility of an essential package of cancer control interventions in low-income and middle-income countries: key messages from disease control priorities, 3rd edition. Lancet. 2016;387:2133-2144. (10033)
- [Google Scholar]
- Projection of cancer incident cases for India -till 2026. Asian Pac J Cancer Prev. 2013;14(7):4379-4386.
- [Google Scholar]
- Cancer survival in Africa, Asia, and Central America: a population-based study. Lancet Oncol. 2010;11(2):165-173.
- [Google Scholar]
- CBTRUS statistical report: primary brain and central nervous system tumors diagnosed in the United States in 2007-2011. Neuro-oncol. 2014;16(04):iv1-iv63.
- [Google Scholar]
- CBTRUS statistical report: primary brain and central nervous system tumors diagnosed in the United States in 2006-2010. Neuro-oncol. 2013;15(02):ii1-ii56.
- [Google Scholar]
- Prospective analysis of incidence of central nervous tumors presenting in a tertiary cancer hospital from India. J Neurooncol. 2008;87(1):111-114.
- [Google Scholar]
- Descriptive epidemiology of primary brain and CNS tumors in Delhi, 2003-2007. Asian Pac J Cancer Prev. 2012;13(2):637-640.
- [Google Scholar]
- Spectrum of primary intracranial tumors at a tertiary care neurological institute: a hospital-based brain tumor registry. Neurol India. 2016;64(3):494-501.
- [Google Scholar]
- Spectrum of pediatric brain tumors in India: a multi-institutional study. Neurol India. 2011;59(2):208-211.
- [Google Scholar]
- Pediatric tumors of the central nervous system: a retrospective study of 1,043 cases from a tertiary care center in South India. Childs Nerv Syst. 2011;27(8):1257-1263.
- [Google Scholar]
- Rostam Niakan Kalhori S, Davoodi S, Zendehdel K. Systematic review of Hospital Based Cancer Registries (HBCRs): necessary tool to improve quality of care in cancer patients. Asian Pac J Cancer Prev. 2017;18(8):2027-2033.
- [Google Scholar]
- Hospital-based cancer registry: a tool for patient care, management and quality. A focus on its use for quality assessment. Clin Transl Oncol. 2014;6:104-113.
- [Google Scholar]
- Immunohistochemical detection of female sex hormone receptors in meningiomas: correlation with clinical and histological features. Neurosurgery. 1993;33(2):212-217, discussion 217–218.
- [Google Scholar]
- Reproductive factors and risk of primary brain tumors in women. J Neurooncol. 2014;118(2):297-304.
- [Google Scholar]
- Sexually dimorphic RB inactivation underlies mesenchymal glioblastoma prevalence in males. J Clin Invest. 2014;124(9):4123-4133.
- [Google Scholar]
- A positive family history of cancer or lifestyle factors may not explain the high incidence of early-onset colorectal cancer in India. Color Cancer. 2014;3:409-416.
- [Google Scholar]
- Renal cell carcinoma in India demonstrates early age of onset & a late stage of presentation. Indian J Med Res. 2014;140(5):624-629.
- [Google Scholar]
- Breast cancer care in India: the current scenario and the challenges for the future. Breast Care (Basel). 2008;3(1):21-27.
- [Google Scholar]
- Global Health Observatory Data Repository. Available from: http://apps.who.int/gho/data/node.main.688?Lang=en. Accessed on Oct 29, 2020
- Demographic profile, clinicopathological spectrum, and treatment outcomes of primary central nervous system tumors: retrospective audit from an academic neuro-oncology unit. Indian J Cancer. 2017;54(4):594-600.
- [Google Scholar]
- Brain tumor epidemiology: consensus from the Brain Tumor Epidemiology Consortium. Cancer. 2008;113(07):1953-1968.
- [Google Scholar]


