
Translate this page into:
Effect of Intraoperative Blood Loss on Perioperative Complications and Neurological Outcome in Adult Patients Undergoing Elective Brain Tumor Surgery
Girija Prasad Rath, MD, DM Department of Neuroanaesthesiology and Critical Care, Neurosciences Centre, All India Institute of Medical Sciences New Delhi 110029 India girijarath@yahoo.co.in
This article was originally published by Thieme Medical and Scientific Publishers and was migrated to Scientific Scholar after the change of Publisher.
Abstract
Abstract
Background Major blood loss during neurosurgery can lead to several complications, including life-threatening hemodynamic instabilities. Studies addressing these complications in patients undergoing intracranial tumor surgery are limited.
Materials and Methods During the study period, 456 patients who underwent elective craniotomy for brain tumor excision were categorized into four groups on the basis of estimated intraoperative blood volume loss: Group A (<20%), Group B (20–50%), Group C (>50–100%), and Group D (more than estimated blood volume). The occurrence of various perioperative complications was correlated with these groups to identify if there was any association with the amount of intraoperative blood loss.
Results The average blood volume loss was 11% ± 5.3% in Group A, 29.8% ± 7.9% in Group B, 68.3% ± 13.5% in Group C, and 129.1% ± 23.9% in Group D. Variables identified as risk factors for intraoperative bleeding were female gender (p < 0.001), hypertension (p = 0.008), tumor size >5 cm (p < 0.001), high-grade glioma (p = 0.004), meningioma (p < 0.001), mass effect (p = 0.002), midline shift (p = 0.014), highly vascular tumors documented on preoperative imaging (p < 0.001), extended craniotomy approach (p = 0.002), intraoperative colloids use >1,000 mL (p < 0.001), intraoperative brain bulge (p = 0.03), intraoperative appearance as highly vascular tumor (p < 0.001), and duration of surgery >300 minutes (p < 0.001).
Conclusions Knowledge of these predictors may help anesthesiologists anticipate major blood loss during brain tumor surgery and be prepared to mitigate these complications to improve patient outcome.
Keywords
blood loss
brain tumor
neurological outcome
neurosurgery
perioperative complications

Introduction
Blood loss during neurosurgery varies in magnitude from minimal to massive. Excessive blood loss is strongly associated with in-hospital morbidity and mortality.1 Complications of transfusion translate into higher rates of sepsis, longer duration of hospital and intensive care unit (ICU) stay, and overall increased patient mortality.2 3 4 5 6 7 Several studies have identified complications associated with bleeding in patients with trauma, obstetric hemorrhage, cardiac surgery, liver transplantation, and oncological surgery.8 9 10 11 12 13 14 However, studies addressing these complications during intracranial tumor surgery are not available. Hence, we planned this study to correlate the amount of intraoperative bleeding with perioperative complications and neurological outcome in patients undergoing brain tumor surgery.
Materials and Methods
After obtaining approval from the Institutional Ethics Committee and permission to access the patients’ records, data of all adult patients between 18 and 60 years, who underwent elective surgery for brain tumor removal over a period of 1 year, were collected by reviewing the patients’ medical records and intraoperative anesthesia charts.
Preoperative patient data, including age, sex, body weight, associated systemic illness, American Society of Anesthesiologists (ASA) physical status, type and site of lesion, the number of previous surgeries for the pathology, preoperative cardiorespiratory status, and preoperative baseline investigations, were collected. Estimated blood volume (EBV) of the individual patient was calculated on the basis of his or her gender (men: 70 mL/kg; women: 65 mL/kg).
Intraoperative anesthesia record and surgical notes were reviewed to collect data regarding type of anesthesia technique, surgical position, surgical procedure, hemodynamic stability, amount of blood loss, amount and type of intravenous (IV) fluid administered, amount of blood and blood components transfused, the use of vasopressors, the use of cell saver, and duration of surgery and anesthesia. Intraoperative complications such as hemodynamic instability, hypothermia, derangements in blood gases and acid-base status, dyselectrolytemia, arrhythmias, coagulation abnormality if any, and details of their management were noted. After completion of the surgery, it was also recorded whether the patient was extubated immediately or was mechanically ventilated.
Patients medical records were reviewed to note the development of postoperative complications within the first 48 hours related to blood loss and transfusion, such as anemia (hemoglobin <8 g%), leukocytosis (total leukocyte count >11,000/mm3), thrombocytopenia (platelet count <100,000/ mm3), fever, coagulation abnormality, deranged hepatic/renal parameters, and further blood and component transfusion. Other complications such as neurological deficits, cardiovascular complications, pulmonary complications, infections (pulmonary, bloodstream, wound, meningitis, and sepsis), renal failure, electrolyte imbalance, and hemodynamic instability requiring inotrope/vasopressor were also recorded. Hematoma in the postoperative computed tomographic scan, need for reexploration for hematoma evacuation, need for tracheostomy, the number of days of mechanical ventilation, and days of ICU and hospital stay were also noted. Prolonged mechanical ventilation was defined as duration of mechanical ventilation >48 hours. Similarly, prolonged ICU stay was taken as ICU stay >2 days and prolonged hospital stay was considered as hospital stay >7 days. Patient condition at the time of discharge was noted to assign Glasgow Outcome Scale (GOS) grade to assess neurological outcome. GOS grade IV and V were considered “good outcome,” whereas GOS Grade I, II, and III were included in “poor outcome.”
All the patients were then categorized into four groups on the basis of their estimated intraoperative blood loss as follows:
-
Group A: <20% blood volume loss
-
Group B: 20 to 50% blood volume loss
-
Group C: >50 to 100% blood volume loss
-
Group D: blood loss exceeding estimated total blood volume
Occurrence of various perioperative complications was then correlated with the patient groups to identify if there was any association with the amount of intraoperative blood loss.
The primary objective of this study was to study the effects of intraoperative blood loss on perioperative complications and neurological outcome in adult patients undergoing elective brain tumor surgery. The secondary objectives were to identify various risk factors predicting intraoperative blood loss in these patients.
Statistical Analysis
The statistical analysis was performed using STATA 12.1 (College Stations, Texas, United States). Data are presented as number (%)/mean ± standard deviation/median (range) as appropriate. For univariate analysis, we used the chi-squared test and the Fisher’s exact test (when one or more expected frequencies were <5) for categorical variables and the Student’s t-test for continuous variables. Univariate analysis followed by multiple logistic regression analysis was done to identify risk factors and independent predictors for the occurrence of blood loss >20%. The results are reported as odds ratio (OR) and 95% confidence interval (CI). p-Value < 0.05 was considered statistically significant.
Results
During the study period, 456 patients who underwent elective craniotomy for brain tumor excision qualified for analysis as per the inclusion criteria, and their data were analyzed. After categorization into four groups based on the intraoperative estimated blood volume loss, there were 250 (54.8%) patients in Group A, 154 (33.7%) patients in Group B, 41 (8.9%) patients in Group C, and 11 (2.4%) patients in Group D.
Mean age of our study patients was 37.4 ± 11.5 years. Most of the patients were in the third and fourth decades of life (Fig. 1). There was almost equal distribution of men and women (246 men [53.9%] vs. 210 women [46.1%]) (Table 1). The majority of the patients belonged to ASA physical status I (76%) (Table 1). Hypertension (10.9%) was the most common comorbidity followed by diabetes mellitus and hypothyroidism; multiple comorbidities were seen in 14 patients.

-
Fig. 1 Age-wise distribution of patients in the study groups.
Fig. 1 Age-wise distribution of patients in the study groups.
|
Variable |
Group A (n = 250) |
Group B (n = 154) |
Group C (n = 41) |
Group D (n = 11) |
Total (n = 456) |
|---|---|---|---|---|---|
|
Abbreviations: ASA, American Society of Anesthesiologist; DM, diabetes mellitus; HTN, hypertension; SD, standard deviation. Note: All values are expressed as mean ± SD or n (%). |
|||||
|
Age (M ± SD), y |
37.5 ± 11.6 |
37.8 ± 11.4 |
36.4 ± 12.1 |
34.2 ± 8.1 |
37.4 ± 11.5 |
|
Male-to-female ratio |
156:94 |
67:87 |
21:20 |
2:9 |
246:210 |
|
Weight, kg |
62.5 ± 12.8 |
57.7 ± 11.8 |
51.7 ± 9.9 |
47.7 ± 11.5 |
59.6 ± 12.8 |
|
Comorbidities |
|||||
|
None |
184 (73.6) |
121 (78.57) |
32 (78.05) |
11 (100) |
348 (76.32) |
|
HTN |
34 (13.6) |
10 (6.49) |
2 (4.88) |
0 |
46 (10.09) |
|
DM |
8 (3.2) |
6 (3.9) |
2 (4.88) |
0 |
16 (3.51) |
|
Hypothyroidism |
6 (2.4) |
1 (0.65) |
2 (4.88) |
0 |
9 (1.97) |
|
Cardiac disease |
0 |
1 (0.65) |
0 |
0 |
1 (0.22) |
|
Psychiatric disease |
3 (1.2) |
0 |
0 |
0 |
3 (0.66) |
|
Others |
8 (3.2) |
10 (6.49) |
1 (2.44) |
0 |
19 (4.17) |
|
Multiple |
7 (2.8) |
5 (3.25) |
2 (4.88) |
0 |
14 (3.07) |
|
ASA physical status grade |
|||||
|
1 |
184 (73.6) |
120 (77.92) |
32 (78.05) |
11 (100) |
347 (76.1) |
|
2 |
64 (25.6) |
32 (20.78) |
9 (21.95) |
0 |
105 (23.03) |
|
3 |
2 (0.8) |
2(1.3) |
0 |
0 |
4 (0.88) |
Most patients underwent surgery for excision of primary tumors (98.5%). The tumors were commonly supratentorial (46.9%) in location (Table 2). Histopathologically, about one-third of the patients had glioma (31.5%), followed by meningioma (27.6%) and schwannoma (16%). Eighty-four patients (18.4%) underwent redo surgeries. About 30% patients had large (>5 cm size) and highly vascular tumors. A little more than three-fourths of our patients had mass effect preoperatively, while only 11.8% and 19.3% patients, respectively, had midline shift >5 mm and hydrocephalus before surgery.
|
Variable |
Group A (n = 250), n (%) |
Group B (n = 154), n (%) |
Group C (n = 41), n (%) |
Group D (n = 11), n (%) |
Total (n = 456), n (%) |
p-Value |
|---|---|---|---|---|---|---|
|
Note: All values are number of patients (%). |
||||||
|
Tumor location |
||||||
|
Supratentorial |
116 (46.4) |
72 (46.75) |
22 (53.66) |
4 (36.36) |
214 (46.93) |
0.815 |
|
Posterior fossa |
28 (11.2) |
15 (9.74) |
3 (7.32) |
3 (27.27) |
49 (10.75) |
|
|
Cerebellopontine angle |
35 (14) |
21 (13.64) |
6 (14.63) |
3 (27.27) |
65 (14.25) |
|
|
Skull base |
56 (22.4) |
38 (24.68) |
8 (19.51) |
1 (9.09) |
103 (22.59) |
|
|
Intraventricular |
15 (6) |
8 (5.19) |
2 (4.88) |
0 |
25 (5.48) |
|
|
Tumor pathology |
||||||
|
Low-grade glioma |
69 (27.6) |
27 (17.53) |
4 (9.76) |
0 |
100 (21.93) |
0.002 |
|
High-grade glioma |
19 (7.6) |
17 (11.04) |
7 (17.07) |
1 (9.09) |
44 (9.65) |
|
|
Meningioma |
50 (20) |
54 (35.06) |
18 (43.9) |
4 (36.36) |
126 (27.63) |
|
|
Hemangioblastoma |
8 (3.2) |
5 (3.25) |
3 (7.32) |
1 (9.09) |
17 (3.73) |
|
|
Schwannoma |
36 (14.4) |
27 (17.53) |
6 (14.63) |
4 (36.36) |
73 (16.01) |
|
|
Pituitary adenoma |
8 (3.2) |
5 (3.25) |
0 |
0 |
13 (2.85) |
|
|
Craniopharyngioma |
9 (3.6) |
2 (1.3) |
0 |
0 |
11 (2.41) |
|
|
Epidermoid |
22 (8.8) |
2 (1.3) |
0 |
0 |
24 (5.26) |
|
|
Medulloblastoma |
5 (2) |
2 (1.3) |
1 (2.44) |
0 |
8 (1.75) |
|
|
Others |
24 (9.6) |
13 (8.44) |
2 (4.88) |
1 (9.09) |
40 (8.77) |
|
|
Tumor size, cm |
||||||
|
<5 |
200 (80) |
96 (62.3) |
23 (56.1) |
1 (9.1) |
320 (70.2) |
<0.001 |
|
>5 |
50 (20) |
58 (37.7) |
18 (43.9) |
10 (90.9) |
136 (29.8) |
<0.001 |
|
Other characteristics |
||||||
|
Metastatic tumors |
5 (2) |
1 (0.7) |
1 (2.4) |
0 |
7(1.5) |
0.505 |
|
Redo surgeries |
45 (18) |
28 (18.2) |
11 (26.8) |
0 |
84 (18.4) |
0.229 |
|
Mass effect |
178 (71.2) |
125 (81.2) |
37 (90.2) |
10 (90.9) |
350 (76.8) |
0.009 |
|
Midline shift |
21 (8.4) |
23 (14.9) |
8 (19.5) |
2 (18.2) |
54 (11.8) |
0.044 |
|
Hydrocephalus |
44 (17.6) |
30 (19.5) |
11 (26.8) |
3 (27.3) |
88 (19.3) |
0.427 |
|
Highly vascular tumors |
42 (16.8) |
57 (37) |
23 (56.1) |
6 (54.5) |
128 (28.1) |
<0.001 |
Nearly, all patients (98.5%) underwent craniotomy under general anesthesia. There were only a few (1.5%) patients who underwent craniotomy under monitored anesthesia care for excision of tumor involving eloquent areas (Table 3). Most patients underwent simple craniotomy (58.5%) in the supine position (67.1%). The mean durations of surgery and anesthesia were 331.3 ± 118.2 minutes (65–800) and 436.3 ± 126.1 minutes (95–870), respectively (Table 5).
|
Variable |
Group A (n = 250), n (%) |
Group B (n = 154), n (%) |
Group C (n = 41), n (%) |
Group D (n = 11), n (%) |
Total (n = 456), n (%) |
p-Value |
|---|---|---|---|---|---|---|
|
Abbreviations: IV, intravenous; MAC, monitored anesthesia care. Note: All values are expressed as number of patients (%). |
||||||
|
Anesthetic technique |
||||||
|
Inhalational |
229 (91.6) |
148 (96.1) |
37 (90.24) |
11 (100) |
425 (93.2) |
0.301 |
|
Total IV |
2 (0.8) |
0 |
0 |
0 |
2 (0.44) |
|
|
IV plus inhalational |
12 (4.8) |
6 (3.9) |
4 (9.76) |
0 |
22 (4.82) |
|
|
MAC |
7(2.8) |
0 |
0 |
0 |
7 (1.54) |
|
|
Surgical position |
||||||
|
Supine |
173 (69.2) |
102 (66.23) |
27 (65.85) |
4 (36.36) |
306 (67.11) |
0.042 |
|
Lateral |
36 (14.4) |
27 (17.53) |
4 (9.76) |
6 (54.55) |
73 (16.01) |
|
|
Prone |
30 (12) |
17 (11.04) |
10 (24.39) |
1 (9.09) |
58 (12.72) |
|
|
Sitting |
11 (4.4) |
8 (5.19) |
0 |
0 |
19 (4.17) |
|
|
Surgical approach |
||||||
|
Simple craniotomy |
158 (63.2) |
79 (51.3) |
26 (63.41) |
4 (36.36) |
267 (58.55) |
0.017 |
|
Extended craniotomy |
25 (10) |
31 (20.13) |
8 (19.51) |
3 (27.27) |
67 (14.69) |
|
|
Posterior fossa craniotomy |
67 (26.8) |
44 (28.57) |
7 (17.07) |
4 (36.36) |
122 (26.75) |
|
The average blood volume loss was 11 ± 5.3% in Group A, 29.8% ± 7.9% in Group B, 68.3 ± 13.5% in Group C, and 129.1 ± 23.9% in Group D. The intergroup comparison showed that the blood loss between the various groups was significantly different (p < 0.001).
Amounts of crystalloids/colloids administered and urine output were higher through Groups A to D (Table 4); amounts of packed red blood cells (PRBCs), fresh-frozen plasma (FFP), and platelet concentrate (PC) transfused (p < 0.001) also followed a similar trend. Durations of surgery and anesthesia also increased through Groups A to D (Table 5).
|
Variable |
Group A (n = 250) |
Group B (n = 154) |
Group C (n = 41) |
Group D (n = 11) |
Total (n = 456) |
p-Value |
|---|---|---|---|---|---|---|
|
Abbreviations: FFP, fresh frozen plasma; PC, platelet concentrate; PRP, platelet-rich plasma; RBC, red blood cell; SD, standard deviation. Note: All values are expressed as mean ± SD or n (%). |
||||||
|
Blood loss, mL |
447 ± 226 |
1,099 ± 360 |
2,295 ± 634 |
3,854 ± 1,179 |
915 ± 806 |
|
|
Percentage estimated blood volume |
11 ± 5.3 |
29.8 ± 7.9 |
68.3 ± 13.5 |
129.1 ± 23.9 |
25.3 ± 24.7 |
|
|
RBC transfusion |
32 (12.8) |
111 (72.08) |
38 (92.68) |
11 (100) |
192 (42.11) |
<0.001 |
|
RBC (units) |
1.6 ± 0.7 (n = 32) |
2.1 ± 0.9 (n = 111) |
4 ± 1.5 (n = 38) |
6.2 ± 2.3 (n = 11) |
2.6 ± 1.6 (n = 192) |
|
|
Cell salvage |
4(1.6) |
18 (11.69) |
15 (36.59) |
3 (27.27) |
40 (8.77) |
<0.001 |
|
Autologous, mL |
377 ± 220 (n= 4) |
439 ± 291 (n = 18) |
788 ± 492 (n = 15) |
1,123 ± 576 (n= 3) |
615 ± 443 (n= 40) |
|
|
FFP transfusion |
3 (1.2) |
26 (16.88) |
26 (63.41) |
11 (100) |
66 (14.47) |
<0.001 |
|
FFP (units) |
4.7 ± 1.5 (n = 3) |
3.3 ± 1.2 (n = 26) |
3.9 ± 0.9 (n = 26) |
4.5 ± 2.3 (n = 11) |
3.8 ± 2.3 (n = 66) |
|
|
PC/PRP transfusion |
3 (1.2) |
16 (10.39) |
20 (48.78) |
10 (90.91) |
49 (10.75) |
<0.001 |
|
PRP (units) |
2.3 ± 1.5 (n = 3) |
2.7 ± 1.1 (n = 16) |
3.3 ± 1.1 (n = 20) |
4.4 ± 1.3 (n = 10) |
3.3 ± 1.3 (n = 49) |
|
|
Variable |
Group A (n = 250) |
Group B (n = 154) |
Group C (n = 41) |
Group D (n = 11) |
Total (n = 456) |
p-Value |
|---|---|---|---|---|---|---|
|
Note: All values are expressed as mean ± SD or n (%). |
||||||
|
Duration of surgery, min |
282.6 ± 91.6 |
374.9 ± 110.7 |
429.7 ± 133.8 |
461.8 ± 144.1 |
331.3 ± 118.2 |
|
|
Duration of anesthesia, min |
384.7 ± 103.1 |
483.7 ± 112.8 |
532.9 ± 137.2 |
583.2 ± 162 |
436.3 ± 126.1 |
|
|
Crystalloids, mL |
3,498.4 ± 969.9 |
4,310.1 ± 1,163.9 |
5,195.1 ± 1,122.9 |
7,090.9 ± 3,088.8 |
4,011.7 ± 1,349.5 |
|
|
Colloids, mL |
647.4 ± 255.8 (n = 171) |
856.9 ± 359.5 (n = 151) |
1,219.5 ± 388.1 (n = 41) |
1,400 ± 614.6 (n = 10) |
815.3 ± 385 (n = 373) |
|
|
Urine output, mL |
1,571.2 ± 798.1 |
1,844.9 ± 901.5 |
2,270.7 ± 1,205.1 |
3,136.4 ± 1,434.9 |
1,764.3 ± 941.3 |
|
|
Reversal |
191 (76.4) |
62 (40.26) |
5 (12.2) |
0 |
258 (56.58) |
<0.001 |
|
Extubation |
184 (73.6) |
57 (37.01) |
5 (12.2) |
0 |
246 (53.95) |
<0.001 |
|
Ventilation |
67 (26.8) |
97 (62.99) |
36 (87.8) |
11 (100) |
211 (46.27) |
<0.001 |
The occurrence of hemodynamic instability requiring the use of vasopressors/inotropes and other intraoperative complications such as hypothermia, acidosis, and dyselectrolytemia were significantly more among patients in the groups that had greater blood loss (Table 6).
|
Variable |
Group A (n = 250), n (%) |
Group B (n = 154), n (%) |
Group C (n = 41), n (%) |
Group D (n = 11), n (%) |
Total (n = 456), n (%) |
p-Value |
|---|---|---|---|---|---|---|
|
Note: All values are number of patients (%). |
||||||
|
Hemodynamic instability |
1 (0.4) |
2 (1.3) |
8 (19.5) |
6 (54.5) |
17 (3.7) |
<0.001 |
|
Inotrope/vasopressor use |
1 (0.4) |
1 (0.7) |
0 |
6 (54.5) |
8 (1.7) |
<0.001 |
|
Hypothermia |
0 |
0 |
12 (29.3) |
9(81.8) |
21 (4.6) |
<0.001 |
|
Dyselectrolytemia |
0 |
0 |
0 |
1 (9.1) |
1 (0.2) |
0.024 |
|
Acidosis |
0 |
0 |
2 (4.9) |
0 |
2 (0.4) |
0.013 |
|
Difficult hemostasis |
1 (0.4) |
0 |
1 (2.4) |
0 |
2 (0.4) |
0.215 |
Almost three-fourth of the patients were extubated at the end of surgery in Group A, and the number progressively declined through Group A to Group D. A reverse trend was seen for continuation of mechanical ventilation in the postoperative period among the study groups (Table 5). In almost half of the patients who were electively ventilated at the end of surgery, the reason was either prolonged surgery or surgical concern regarding hemostasis or raised intracranial pressure (Table 7). However, in Group C and Group D, the most common reason for postoperative ventilation was excessive bleeding.
|
Reason for ventilation |
Group A (n = 250), n (%) |
Group B (n = 154), n (%) |
Group C (n = 41), n (%) |
Group D (n = 11), n (%) |
Total (n = 456), n (%) |
p-Value |
|---|---|---|---|---|---|---|
|
Abbreviation: LCN, lower cranial nerve. Note: All values are number of patients (%). |
||||||
|
Preoperative LCN palsy |
5 (2) |
11 (7.14) |
1 (2.44) |
0 |
17 (3.73) |
<0.001 |
|
Brainstem handling |
16 (6.4) |
6 (3.9) |
0 |
2 (18.18) |
24 (5.26) |
|
|
Bleeding |
0 |
2 (1.3) |
19 (46.34) |
9(81.82) |
30 (6.58) |
|
|
Intraoperative brain bulge |
3 (1.2) |
2 (1.3) |
0 |
0 |
5 (1.1) |
|
|
Residual tumor |
3 (1.2) |
13 (8.44) |
0 |
0 |
16 (3.51) |
|
|
Prolonged surgery |
9 (3.6) |
29 (18.83) |
1 1 (26.83) |
0 |
49 (10.75) |
|
|
Not obeying commands |
8 (3.2) |
5 (3.25) |
0 |
0 |
13 (2.85) |
|
|
Surgical factors |
23 (9.2) |
29 (18.83) |
5 (12.2) |
0 |
57 (12.5) |
|
During the postoperative period, fever, thrombocytopenia, coagulopathy, pulmonary infections, prolonged ICU stay (>2 days), and requirement of tracheostomy occurred with significantly higher frequency in patients of Group A through D (Table 8). Development of dyselectrolytemia, hematoma, and requirement of surgical reexploration, blood/component transfusion, and prolonged mechanical ventilation were significantly higher in patients with greater intraoperative blood loss. In patients with postoperative hematoma, operative cavity was the most frequent location (Table 9). The overall median duration of mechanical ventilation (Table 10) was 17 hours (2–624 hours). The median duration of ICU stay was 1.5 days (2–864 hours), and the median hospital stay was 8 days (4–112 days). Chances of poor neurological outcome were significantly higher in patients with greater intraoperative blood loss (p = 0.01).
|
Variable |
Group A (n = 250), n (%) |
Group B (n = 154), n (%) |
Group C (n = 41), n (%) |
Group D (n = 11), n (%) |
Total (n = 456), n (%) |
p-Value |
|---|---|---|---|---|---|---|
|
Abbreviations: Hb, hemoglobin; ICU, intensive care unit; TLC, total leukocyte count. Note: All values are number of patients (%). |
||||||
|
Anemia (Hb < 8 g %) |
5 (2) |
5 (3.3) |
4(9.8) |
0 |
14 (3.1) |
0.091 |
|
Thrombocytopenia (platelet count <100,000/mm3) |
5 (2) |
15 (9.7) |
13 (31.7) |
6 (54.5) |
39 (8.5) |
<0.001 |
|
Leukocytosis (TLC >1 1,000/mm3) |
149 (59.6) |
98 (63.6) |
23 (56.1) |
7 (63.6) |
277 (60.7) |
0.781 |
|
Fever |
58 (23.2) |
66 (42.9) |
21 (51.2) |
10 (90.9) |
155 (33.9) |
<0.001 |
|
Dyselectrolytemia |
4(1.6) |
10 (6.5) |
5 (12.2) |
1 (9.1) |
20 (4.4) |
0.003 |
|
Deranged renal function tests |
1 (0.4) |
1 (0.6) |
0 |
0 |
2 (0.4) |
1.000 |
|
Deranged liver function tests |
0 |
0 |
1 (2.4) |
0 |
1 (0.2) |
0.114 |
|
Coagulopathy |
2 (0.8) |
3 (1.9) |
6 (14.6) |
2 (18.2) |
13 (2.8) |
<0.001 |
|
Hemodynamic instability |
3 (1.2) |
1 (0.7) |
1 (2.4) |
0 |
5 (1.1) |
0.544 |
|
Inotrope/vasopressor use |
3 (1.2) |
1 (0.7) |
1 (2.4) |
0 |
5 (1.1) |
0.544 |
|
Transfusions |
37 (14.8) |
56 (36.4) |
30 (73.2) |
7 (63.6) |
130 (28.5) |
<0.001 |
|
Multiorgan dysfunction |
2 (0.8) |
4(2.6) |
1 (2.4) |
0 |
7 (1.5) |
0.378 |
|
Pulmonary infection |
2 (0.8) |
9 (5.8) |
2 (4.9) |
1 (9.1) |
14 (3.1) |
0.006 |
|
Sepsis |
0 |
3 (1.95) |
0 |
0 |
3 (0.66) |
0.161 |
|
Urinary tract infection |
1 (0.4) |
1 (0.65) |
0 |
0 |
2 (0.44) |
1.000 |
|
Bloodstream infection |
0 |
1 (0.65) |
1 (2.44) |
0 |
2 (0.44) |
0.116 |
|
Wound infection |
0 |
2 (1.3) |
0 |
0 |
2 (0.44) |
0.329 |
|
Reexploration for hematoma |
6 (2.4) |
4(2.6) |
5 (12.2) |
1 (9.09) |
16 (3.51) |
0.018 |
|
Hematoma |
29 (11.6) |
28 (18.18) |
12 (29.27) |
3 (27.27) |
72 (15.79) |
0.011 |
|
Tracheostomy |
5 (2) |
14 (9.09) |
4 (9.76) |
3 (27.27) |
26 (5.7) |
<0.001 |
|
Prolonged ventilation |
13 (5.2) |
16 (10.4) |
9(21.9) |
2 (18.2) |
40 (8.7) |
<0.001 |
|
Prolonged ICU stay |
13 (5.2) |
23 (14.9) |
8 (19.5) |
4 (36.4) |
48 (10.5) |
<0.001 |
|
Prolonged hospital stay |
112 (44.8) |
95 (61.7) |
32 (78) |
9(81.8) |
248 (54.4) |
0.054 |
|
Poor neurological outcome |
15 (6) |
17 (11) |
8 (19.5) |
2 (18.2) |
42 (9.2) |
0.013 |
|
Type of hematoma |
Group A (n = 250), n (%) |
Group B (n = 154), n (%) |
Group C (n = 41), n (%) |
Group D (n = 11), n (%) |
Total (n = 456), n (%) |
p-Value |
|---|---|---|---|---|---|---|
|
Note: All values are number of patients (%). |
||||||
|
Extradural |
6 (2.4) |
4 (2.6) |
2 (4.88) |
1 (9.09) |
13 (2.85) |
0.106 |
|
Subdural |
0 |
0 |
1 (2.44) |
0 |
1 (0.22) |
|
|
Intracerebral |
1 (0.4) |
2 (1.3) |
1 (2.44) |
1 (9.09) |
5 (1.1) |
|
|
Subarachnoid |
1 (0.4) |
0 |
0 |
0 |
1 (0.22) |
|
|
Intraventricular |
4(1.6) |
6 (3.9) |
2 (4.88) |
0 |
12 (2.63) |
|
|
Tumor cavity |
17 (6.8) |
15 (9.74) |
5 (12.2) |
1 (9.09) |
38 (8.33) |
|
|
Multiple |
2 (0.8) |
1 (0.65) |
0 |
0 |
3 (0.66) |
|
|
Variable |
Group A (n = 250) |
Group B (n = 154) |
Group C (n = 41) |
Group D (n = 11) |
Total (n = 456) |
|
|---|---|---|---|---|---|---|
|
Abbreviations: ICU, intensive care unit; MV, mechanical ventilation. Note: All values are expressed as mean ± SD. |
||||||
|
Duration of MV, d |
1.4 ± 2.4 (n = 67) |
2.3 ± 4.7 (n = 97) |
3 ± 5.4 (n = 36) |
1.4 ± 1.7 (n = 11) |
2.1 ± 4.2 (n = 211) |
|
|
ICU stay, d |
2 ± 2.7 |
3.7 ± 5.3 |
4.2 ± 5.1 |
5.1 ± 3.5 |
2.9 ± 4.1 |
|
|
Hospital stay, d |
9.4 ± 7 |
13.6 ± 15.2 |
14.9 ± 13.4 |
15.3 ± 7.1 |
11.5 ± 11.2 |
|
On univariate analysis, several demographics and preoperative and intraoperative variables were identified as risk factors for intraoperative bleeding. These included female gender (p < 0.001), presence of hypertension (p = 0.008), tumor size >5 cm (p < 0.001), tumor pathology like high-grade glioma (p = 0.004) and meningioma (p < 0.001), presence of preoperative mass effect (p = 0.002), preoperative midline shift >5 mm (p = 0.014), highly vascular tumors as seen on preoperative imaging (p < 0.001), extended craniotomy approach (p = 0.002), intraoperative use of colloids >1,000 mL (p < 0.001), intraoperative brain bulge (p = 0.03), intraoperative appearance as highly vascular tumor (p < 0.001), and duration of surgery >300 minutes (p < 0.001) (Table 11).
|
Variable |
OR |
95% CI |
p-Value |
|||
|---|---|---|---|---|---|---|
|
Abbreviations: CI, confidence interval; HTN, hypertension; HGG, high-grade glioma; OR, odds ratio. |
||||||
|
Female gender |
2.14 |
1.468–3.115 |
0.0001 |
|||
|
HTN |
0.39 |
0.198–0.78 |
0.008 |
|||
|
Tumor size > 5 cm |
2.87 |
1.892–4.344 |
<0.001 |
|||
|
HGG |
2.93 |
1.409–6.088 |
0.004 |
|||
|
Meningioma |
3.38 |
1.944–5.888 |
<0.001 |
|||
|
Preoperative mass effect |
2.05 |
1.293–3.237 |
0.0018 |
|||
|
Preoperative midline shift |
2.08 |
1.162–3.721 |
0.0123 |
|||
|
Vascular tumor (imaging) |
3.8 |
1.794–8.054 |
<0.001 |
|||
|
Extended craniotomy approach |
2.44 |
1.402–4.229 |
0.002 |
|||
|
Colloids >1,000 mL |
23.33 |
8.371–65.019 |
<0.001 |
|||
|
Intraoperative brain bulge |
1.75 |
1.055–2.918 |
0.03 |
|||
|
High vascularity (appearance) |
13.34 |
6.282–28.315 |
<0.001 |
|||
|
Surgery duration > 300 min |
1.01 |
1.007–1.012 |
<0.001 |
|||
Subsequently, multivariate logistic regression analysis was performed to find out significant risk factors for intraoperative bleeding (Table 12). Female gender (p = 0.002), presence of hypertension (p = 0.017), tumor size >5 cm (p = 0.008), preoperative and intraoperative appearance of highly vascular tumors (p = 0.041 and p = 0.003, respectively), extended craniotomy approach (p = 0.009), intraoperative use of colloids > 1,000 mL (p < 0.001), and duration of surgery >300 minutes (p < 0.001) were found to be the most predictive variables for intraoperative blood loss (Table 11). However, tumor pathology such as meningioma (OR: 2.34; CI: 1.5–3.5; p = 0.065) and tumor location at skull base (OR: 1.02; CI: 0.6–1.6; p = 0.063) also demonstrated weak significance (Table 12).
|
Variable |
OR |
95% CI |
p-Value |
|||
|---|---|---|---|---|---|---|
|
Abbreviations: CI, confidence interval; HTN, hypertension; OR, odds ratio. |
||||||
|
Female gender |
2.44 |
1.37–4.35 |
0.002 |
|||
|
HTN |
0.33 |
0.13–0.82 |
0.017 |
|||
|
Tumor size >5 cm |
2.3 |
1.24–4.28 |
0.008 |
|||
|
Vascular tumor (imaging) |
2.31 |
1.32–4.05 |
0.003 |
|||
|
Extended craniotomy approach |
0.63 |
0.44–0.89 |
0.009 |
|||
|
Colloids >1,000 mL |
27.32 |
6.68–111.68 |
<0.001 |
|||
|
High vascularity (appearance) |
2.09 |
1.29–3.37 |
0.003 |
|||
|
Surgery duration >300 min |
1.01 |
1–1.01 |
<0.001 |
|||
|
Pathology–meningioma |
0.51 |
0.24–1.04 |
0.065 |
|||
|
Location–skull base |
0.53 |
0.26–1.04 |
0.065 |
|||
The majority of patients had good neurological recovery (71.3%). Around 19% patients had moderate disability and 5.9% had severe disability. Only two patients (0.4%) were discharged in persistent vegetative state. The mortality rate in our study population was 2.8% (Fig. 2).
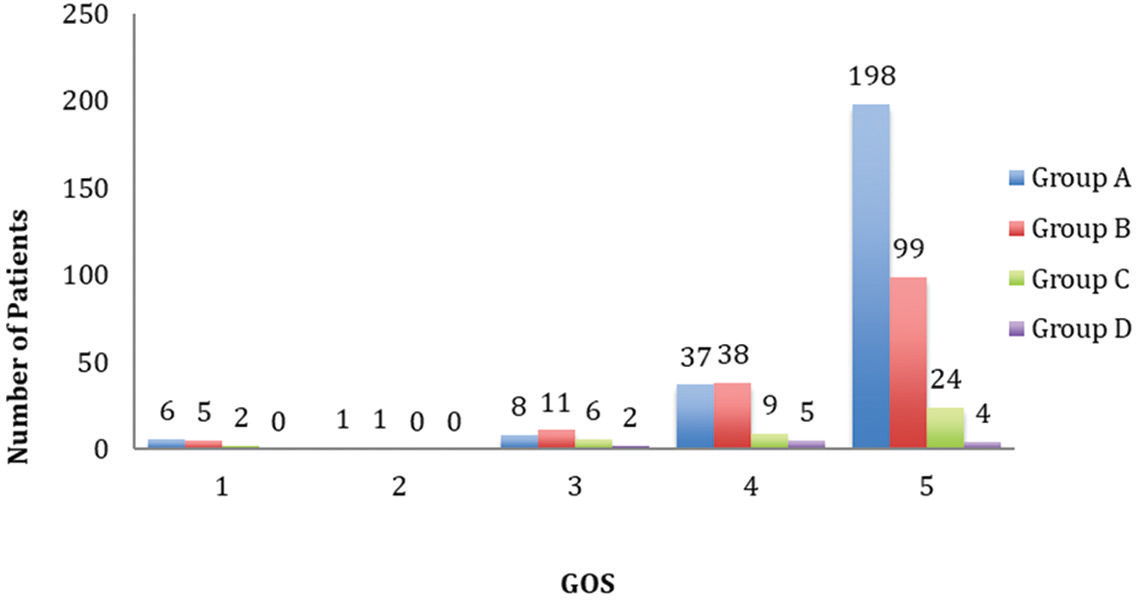
-
Fig. 2 Glasgow Outcome Scale (GOS) (1 = death, 2 = persistent vegetative state, 3 = severe disability, 4 = moderate disability, 5 = good recovery).
Fig. 2 Glasgow Outcome Scale (GOS) (1 = death, 2 = persistent vegetative state, 3 = severe disability, 4 = moderate disability, 5 = good recovery).
Discussion
In this retrospective study, we found that the patients who had >20% estimated blood volume loss had greater incidence of complications, and the rate was higher with increasing blood loss. Blood transfusion during neurosurgery was found to strongly correlate with postoperative complications in a large retrospective study by Rolston et al.15
Only 42.1% of patients required blood or blood product transfusion in our study, which was slightly less compared with the audit by Bhatnagar et al,16 where they found that 48% of their patients with intracranial tumors required transfusion. In our study, 32 (12.8%) patients who had <20% estimated blood volume loss also received blood transfusion; the reason of transfusion was not mentioned in all anesthesia records but might be due to low baseline hemoglobin, presence of cardiorespiratory comorbidity, rapidity of blood loss, or alarming clinical signs.
Intraoperative complications such as hemodynamic instability requiring inotrope/vasopressor support, hypothermia, and need for elective ventilation postsurgery were more frequent in patients who sustained >50% estimated blood volume loss. Patients who had >20% estimated blood volume loss required infusion of more crystalloids and colloids intraoperatively. Colloid infusion more than 1 L was found more commonly in Groups C and D. Similarly, the requirement for blood components such as FFP and PC were also higher in these patients. Piastra et al found that infants who had blood loss exceeding their estimated total blood volume during excision of brain tumor required significantly more intraoperative cardiovascular support.13 In addition, they also had significantly higher ICU length of stay and postoperative mechanical ventilation requirement.
In our study, anemia in the postoperative period was slightly more in patients who had >20% estimated blood volume loss (4.4 vs. 2%). However, this difference was not statistically significant. This probably shows adequacy of transfusion efforts during the intraoperative period. Thrombocytopenia was more common in patients who had >20% estimated blood volume loss, almost varying linearly with the amount of blood lost. This may be due to the dilutional effect due to infusion of IV fluids, PRBCs, and FFP (poor in platelets).
Postoperatively, fever was more common in patients who had more blood loss, which could be either reactionary to blood transfusion or an early indicator of onset of infection, both of which were more common in patients who had more severe intraoperative bleeding.
Postoperative infections were also positively associated with blood loss and transfusion with most of the infections (pulmonary, bloodstream, wound/surgical site, sepsis, etc.) more frequent in patients who had major blood loss and blood transfusion. Huber-Wagner et al17 and Working Group on Polytrauma of the German Trauma Society prospectively studied massive blood transfusion and outcome in 1,062 polytrauma patients and found that ~15% of polytrauma patients who received massive blood transfusion showed risk of organ failure, sepsis, and death correlating with increasing transfusion amount. In our study, risk of postoperative pulmonary infection strongly correlated with intraoperative blood loss and blood/compo-nent transfusion (OR: 24; CI: 1.76–327.3; p = 0.017).
The increased incidence of perioperative complications in patients who had >20% estimated blood volume loss resulted in increased morbidity reflected by prolonged duration of mechanical ventilation, ICU stay, and hospital stay in these patients. Bochicchio et al18 found that in trauma patients admitted to ICU, blood product transfusion was associated with a significantly greater infection rate, hospital and ICU stay, ventilator days, and mortality with a dose-dependent correlation.
On regression analysis, several factors were found to positively correlate as risks for intraoperative bleeding. Although all other factors are convincing for their presence, observation of female gender as a significant predictor of intraoperative blood loss is surprising. We did not find any study with similar finding in the literature; therefore, it needs to be further confirmed in larger studies.
Massive intraoperative blood loss has been found to increase the risk of perioperative death by up to eightfold in some studies.1 In our study, we found certain predictors of blood loss, of which female gender, tumor size >5 cm, high vascularity of tumor assessed on the basis of preoperative imaging as well as intraoperative appearance, colloid transfusion >1 L, and surgery duration >300 minutes were most notable.
There are certain limitations of this study, including those inherent to all retrospective study designs. Second, all our patients were adults. Third, we included only patients undergoing elective neurosurgery.
Conclusions
Intracranial tumor excision can be associated with major blood loss and require transfusion of large volumes of blood and blood products. This study has identified various factors for intraoperative blood loss during brain tumor surgery. By knowing these predictors, the anesthesiologist can anticipate major blood loss and be prepared to avoid intraoperative hemodynamic instabilities, hypothermia, and acidosis, and make judicious use of blood and blood products, which may go a long way in improving patient outcome.
Conflict of Interest
None declared.
Funding None.
References
- The independent association of massive blood loss with mortality in cardiac surgery. Transfusion. 2004;44(10):1453-1462.
- [Google Scholar]
- Deleterious clinical effects of transfusion immunomodulation: proven beyond a reasonable doubt. Transfusion. 2005;45(2):33S-39S. (suppl) discussion 39S–40S
- [Google Scholar]
- The continuing risk of transfusion-transmitted infections. N Engl J Med. 2006;355(13):1303-1305.
- [Google Scholar]
- A clinical and immunologic study of blood transfusion and postoperative bacterial infection in spinal surgery. Transfusion. 1992;32(6):517-524.
- [Google Scholar]
- Allogeneic blood transfusion increases the risk of postoperative bacterial infection: a meta-analysis. J Trauma. 2003;54(5):908-914.
- [Google Scholar]
- Effects of intraoperative blood transfusion on postoperative complications and survival after orthotopic liver transplantation. Hepatogastroenterology. 1998;45(22):1026-1033.
- [Google Scholar]
- Infection, thrombosis, and oncologic outcome after interval debulking surgery: does perioperative blood transfusion matter. Gynecol Oncol. 2019;153(1):63-67.
- [Google Scholar]
- Methods to decrease blood loss and transfusion requirements for liver transplantation. Cochrane Database Syst Rev (12):CD009052.
- [Google Scholar]
- Updates in the management of severe coagulopathy in trauma patients. Intensive Care Med. 2002;28(02):S241-S247.
- [Google Scholar]
- Perioperative factors and outcome associated with massive blood loss during major liver resections. HPB (Oxford). 2004;6(3):181-185.
- [Google Scholar]
- Adverse blood transfusion outcomes: establishing causation. Transfus Med Rev. 2011;25(2):89-101.
- [Google Scholar]
- More on transfusion and adverse outcome: it’s time to change. Anesthesiology. 2011;114(2):234-236.
- [Google Scholar]
- Blood loss and shortterm outcome of infants undergoing brain tumour removal. J Neurooncol. 2008;90(2):191-200.
- [Google Scholar]
- The impact of perioperative packed red blood cell transfusion on survival in epithelial ovarian cancer. Int J Gynecol Cancer. 2013;23(9):1612-1619.
- [Google Scholar]
- Frequency and predictors of complications in neurological surgery: national trends from 2006 to 2011. J Neurosurg. 2014;120(3):736-745.
- [Google Scholar]
- An audit of blood transfusion in elective neurosurgery. Indian J Anaesth. 2007;51:200-204.
- [Google Scholar]
- Working Group on Polytrauma of German Trauma Society (DGU). Massive blood transfusion and outcome in 1062 polytrauma patients: a prospective study based on the Trauma Registry of the German Trauma Society. Vox Sang. 2007;92(1):69-78.
- [Google Scholar]
- Outcome analysis of blood product transfusion in trauma patients: a prospective, risk-adjusted study. World J Surg. 2008;32(10):2185-2189.
- [Google Scholar]


