
Translate this page into:
Computed Tomography Evaluation of Craniovertebral Junction in Asymptomatic Central Rural Indian Population
Atul Manohar Dhok, MD Department of Radiology, Mahatma Gandhi Institute of Medical Sciences Sevagram, Maharashtra India dratuldhok@gmail.com
This article was originally published by Thieme Medical and Scientific Publishers Private Ltd. and was migrated to Scientific Scholar after the change of Publisher.
Abstract
Abstract
Objectives Craniovertebral junction (CVJ) is a unique, mobile and complicated component of our spine which necessitates specific study pertaining to its structure as well as pathologies. This study aims to report the normative data detailing the CVJ anatomy among the rural population of Central India which would help us in understanding the joint dynamics.
Materials and Methods A retrospective observational study was undertaken in the Department of Neurosurgery and Radiology, Mahatma Gandhi Institute of Medical Sciences, Sewagram, Maharashtra, from December 2018 to May 2019. A total of 255 head injury patients with a normal CT brain cervical spine were included in this study. Anterior and posterior atlantodental interval (AADI/PADI), clivus length (CL), foramen magnum diameter (FMD), Boogard’s and basal angle (BOO & BA) were measured and analyzed.
Statistical Analysis Statistical analysis was done using Microsoft Excel 2016. A web-based, open source application known as OpenEpi.com (version 3.01) was used for applying unpaired t-test.
Results This study had a mean age of 42.9 years. The difference in mean value of AADI between male and female population was not found to be statistically significant, while in case of PADI, CL, FMD, BOO and BA, it was found to be significant (p < 0.05). On comparison of cases with age ≤ 20 years and > 20 years, we found the difference in values of ADI, CL and FMD to be statistically significant (p < 0.05).
Conclusion Although there are some similarities, namely, AADI measurements as compared with other studies, there are differences in cutoff values of other parameters. Being a major draining reference center for rural population in India, this data can be extrapolated to a similar population for reference.
Keywords
atlantodental interval
basal angle
Boogard’s angle
clivus length
craniovertebral junction
foramen magnum diameter

Introduction
Craniovertebral junction (CVJ) is the most complex structure of human spine, which harbors and protects vital neural and vascular structures in addition to providing mobility greater than any other spine segment.1 Any deformity of this segment subjected to correction is complicated, and detailed knowledge of this area is mandatory prior to any intervention. Majority of literature is focused on techniques to correct the deformity, and there exists paucity regarding the normal anatomy. Most of the normative data published are based on studies conducted by Western authors. With recent advances in fusion techniques for CVJ junction, the knowledge of normal anatomy for specific population cannot be underestimated.
Vidharbha region, where our study was conducted, has a large population suffering from malnourishment. More than half of illiterate females from this region suffer from being underweight and stunted.2 Farming and hard labor form the bulk of the occupation here, which they practice from as early as childhood. Apart from the congenital causes for atlantoaxial instability (AAI), protein–calorie malnutrition, deficiency in specific vitamins, and poor delivery practices can play a role in the process of initiation of AAI.3 Carrying of heavy load on head for a long time can accelerate spine and CVJ degeneration and put the individual at risk of AAI.3 4
The normative data of this rural population can be of utmost importance. This study was aimed at analyzing the data of rural population of central India. Six parameters were studied in detail including anterior atlantodental interval (AADI), posterior atlantodental interval (PADI), clivus length (CL), foramen magnum diameter (FMD), basal angle (BA), and Boogard’s angle (BOO).
Materials and Methods
This was an observational retrospective analysis conducted at the Department of Neurosurgery and Department of Radiology of Mahatma Gandhi Institute of Medical Sciences, Sewagram, from December 2018 to May 2019. Permission from the Institutional Ethical Committee was taken. Since medical ethics does not permit exposure of individual to radiation without clinical symptoms, we conducted this study on patients who came to our department with head injury and were advised imaging for further evaluation. This study includes all the head injury patients who were advised CT brain and cervical spine but reported normal CT cervical spine. Patients having prior history of autoimmune disease, neurological deficit, and any cervical spine pathology on CT cervical spine were not included in the study.
A total of 255 patients were included. CT brain of all the patients was performed in a Wipro-GE multi-slice CT scanner. All images were retrieved from picture archiving and communication system (PACS). Axial sections were obtained at 0.5 mm slice thickness and analyzed in “bone window” setting. The following measurements were taken with in-built linear callipers by consultant radiologist.
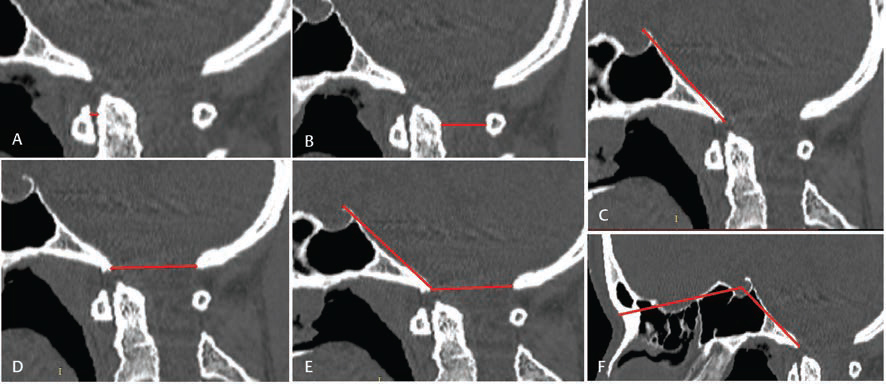
AAI: Horizontal distance from the posterior margin of anterior atlas arch and anterior margin of odontoid process of axis. This measurement was taken in midline sagittal cuts of CT scan (Fig. 1A). It was similar to Hinck’s measurement.5
-
Fig. 1 CT measurements of the following parameters: (A) AADI, (B) PADI, (C) CL, (D) FMD, (E) BOO, (F) BA. AADI, anterior atlantodental interval; BA, basal angle; BOO, Boogard’s angle; CL, clivus length; FMD, foramen magnum diameter; PADI, posterior atlantodental interval.
Fig. 1 CT measurements of the following parameters: (A) AADI, (B) PADI, (C) CL, (D) FMD, (E) BOO, (F) BA. AADI, anterior atlantodental interval; BA, basal angle; BOO, Boogard’s angle; CL, clivus length; FMD, foramen magnum diameter; PADI, posterior atlantodental interval.
PADI: Horizontal distance from the anterior margin of posterior atlas arch to the posterior margin of odontoid process of axis in midline sagittal section (Fig. 1B), which is similar to the definition by Boden.6
CL: Distance between top of dorsum sella to the basion in midline sagittal section of CT image (Fig. 1C).
FMD: Distance between the anterior margin and posterior margin of foramen magnum in a midline sagittal section of CT image (Fig. 1D).
BOO: Angle between the top of the dorsum sellae, basion, and opisthion (Fig. 1E).7
Angle formed by intersection of the line joining the nasion with the center of sellar floor and the line joining the anterior margin of the foramen magnum with the center of floor of sella (Fig. 1F). McGregor8 and Poppel et al9 outlined a similar technique.
Statistical analysis was done using Microsoft Excel 2016. A web-based, open source application known as OpenEpi.com (version 3.01)10 was used for applying unpaired t-test.
Results
This study consisted of 255 cases, which included 175 male and 80 female patients. The age of the study population varied from 2 to 95 years with mean age of 42.9 years. A total of 225 patients were more than 20 years of age, whereas 30 patients were less than or equal to 20 years of age. Table 1 shows the mean and standard deviation of various parameters included in the study, while Table 2 shows comparison of data between male and female. The difference in mean value of AADI between male and female was not significant, while in case of PADI, CL, FMD, BA and BOO, it was found to be statistically significant (p < 0.05) (Table 2). On comparison of cases with age ≤ 20 years and > 20 years, we found the values of AADI, CL, and FMD to be statistically significant (p < 0.05) (Table 3).
|
Mean |
SD |
|
|---|---|---|
|
Abbreviations: AADI, anterior atlantodental interval; BA, basal angle; BOO, Boogard’s angle; CL, clivus length; FMD, foramen magnum diameter; PADI, posterior atlantodental interval; SD, standard deviation. |
||
|
AADI |
1.3 |
0.43 |
|
PADI |
16.77 |
2.08 |
|
CL |
44.91 |
4.34 |
|
FMD |
34.03 |
2.54 |
|
BA |
130.24 |
4.4 |
|
BOO |
129.14 |
6.35 |
|
Male (n = 175) |
Female (n = 80) |
p-Value |
|
|---|---|---|---|
|
Abbreviations: AADI, anterior atlantodental interval; BA, basal angle; BOO, Boogard’s angle; CL, clivus length; FMD, foramen magnum diameter; PADI, posterior atlantodental interval. |
|||
|
AADI |
1.32 |
1.25 |
0.2279 |
|
PADI |
17.03 |
16.2 |
0.0016 |
|
CL |
46.13 |
42.24 |
< 0.0000001 |
|
FMD |
34.63 |
32.73 |
< 0.0000001 |
|
BA |
129.7 |
131.4 |
0.006819 |
|
BOO |
128.4 |
130.8 |
0.004955 |
|
Age ≤ 20 y Mean ± SD (n = 30) |
Age > 20 y Mean ± SD (n = 225) |
p-Value |
|
|---|---|---|---|
|
Abbreviations: AADI, anterior atlantodental interval; BA, basal angle; BOO, Boogard’s angle; CL, clivus length; FMD, foramen magnum diameter; PADI, posterior atlantodental interval; SD, standard deviation. |
|||
|
AADI |
1.89 ± 0.456003 |
1.22 ± 0.36041 |
< 0.0000001 |
|
PADI |
16.18 ± 2.068663 |
16.85 ± 2.078014 |
0.1043 |
|
CL |
39.85 ± 5.515604 |
45.58 ± 3.676659 |
< 0.0000001 |
|
FMD |
32.71 ± 3.057262 |
34.21 ± 2.413136 |
0.0143 |
|
BA |
131.18 ± 3.672019 |
130.12 ± 4.484117 |
0.1563 |
|
BOO |
131.16 ± 6.088003 |
128.87 ± 6.345031 |
0.0617 |
There was not a single value of AADI > 2.5 mm in age group > 20 years. For age more than 20 years, 214 out of 225 cases (95 percent) reported value of AADI less than 2 mm. While for younger age ≤ 20 years, 29 out of 30 cases (96 percent) had value of AADI less than 2.6 mm. Based on this observation, we derived the cutoff limit for AADI in age more than 20 years to be 2 mm. For age ≤ 20 years, the cutoff limit was a little higher and should be considered somewhere around 2.6 mm (Table 3).
Value of PADI ranged from 12.10 mm to 26.20 mm with mean PADI of 16.77 mm and standard deviation (SD) of 2.08. A total of 242 out of 255 cases (≈ 95 percent) had values of PADI ≥ 13.5 mm. We thus inferred the cutoff value for PADI to be 13.5 mm. Difference between male and female values of PADI was found to be statistically significant.
The mean CL was 44.91 mm with SD of 4.34 mm. Difference between CL of male and female was found to be statistically significant.
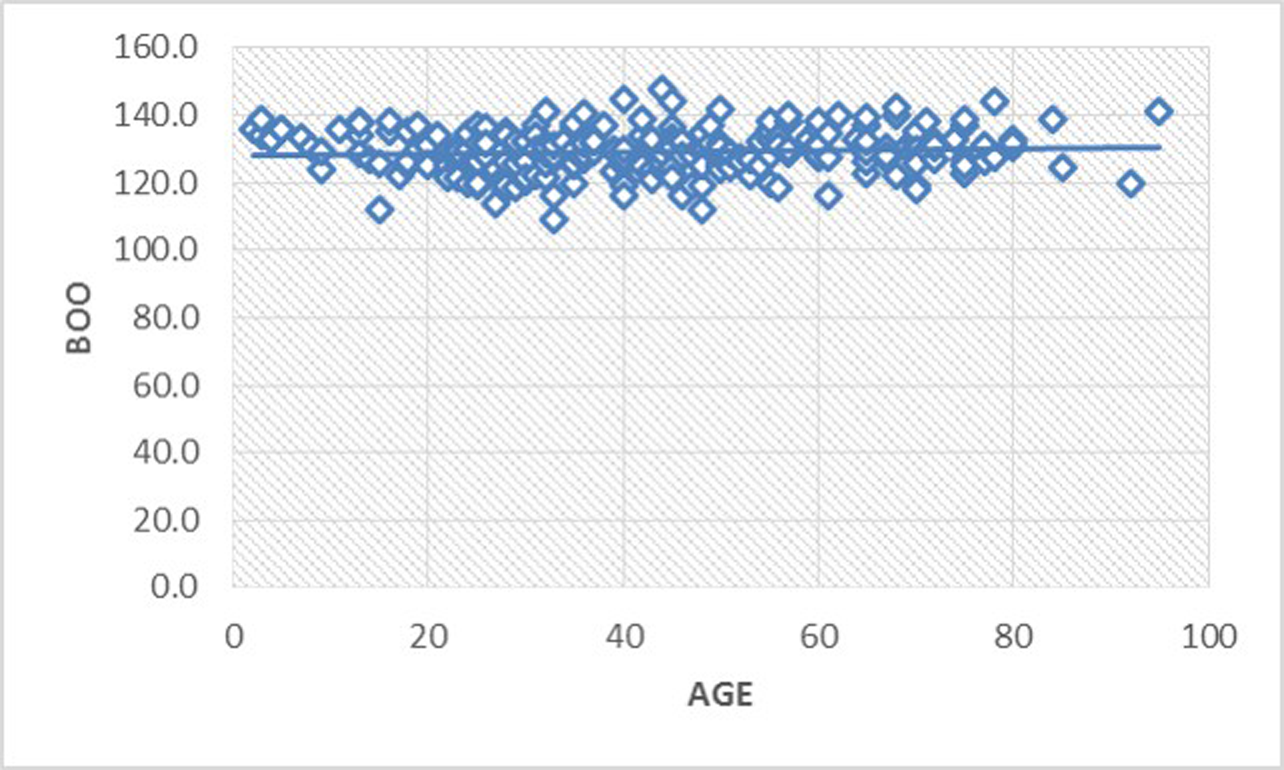
We found mean BOO as 129.14 degree with SD of 6.35 degree. The variance between male and female values was statistically significant. The upper cutoff limit (mean + 2SD) for BOO in our study was 141.84 degree.
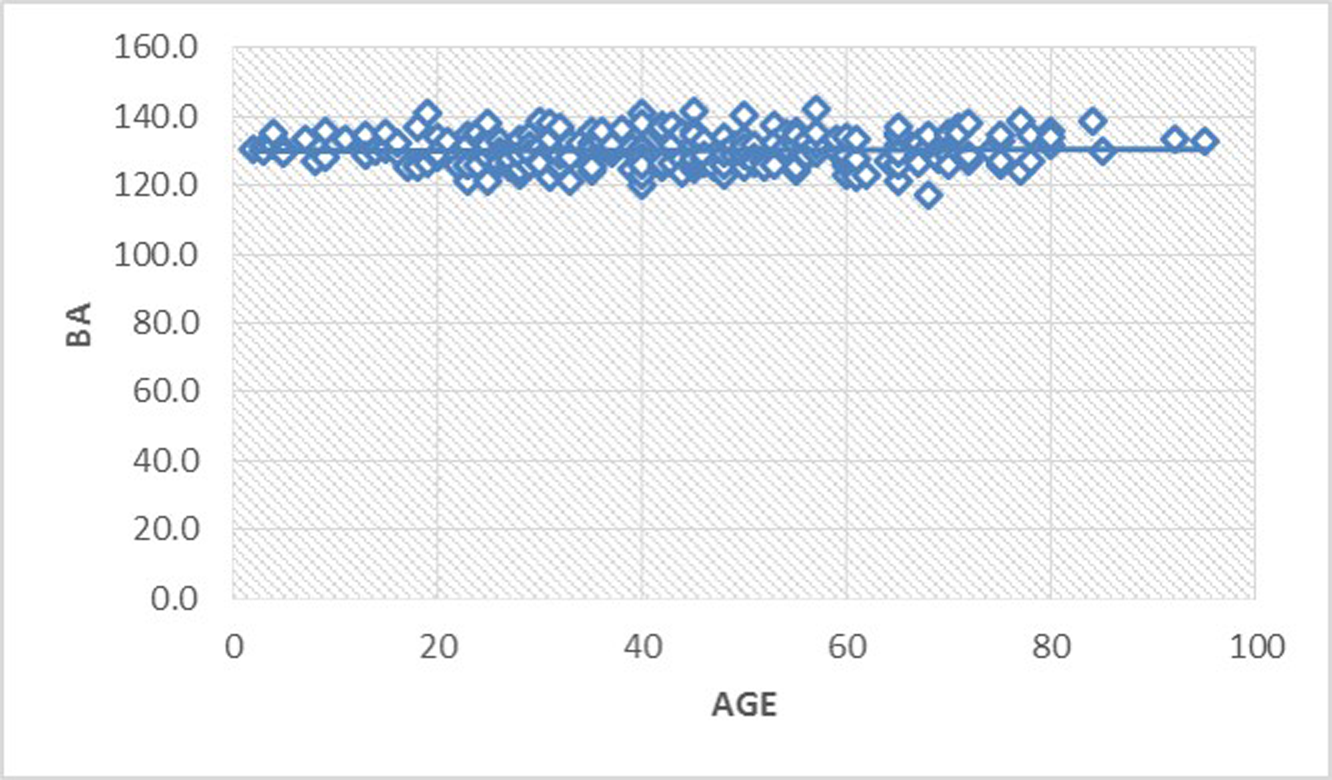
The mean BA in our study was 130.24 degree (SD = 4.4).
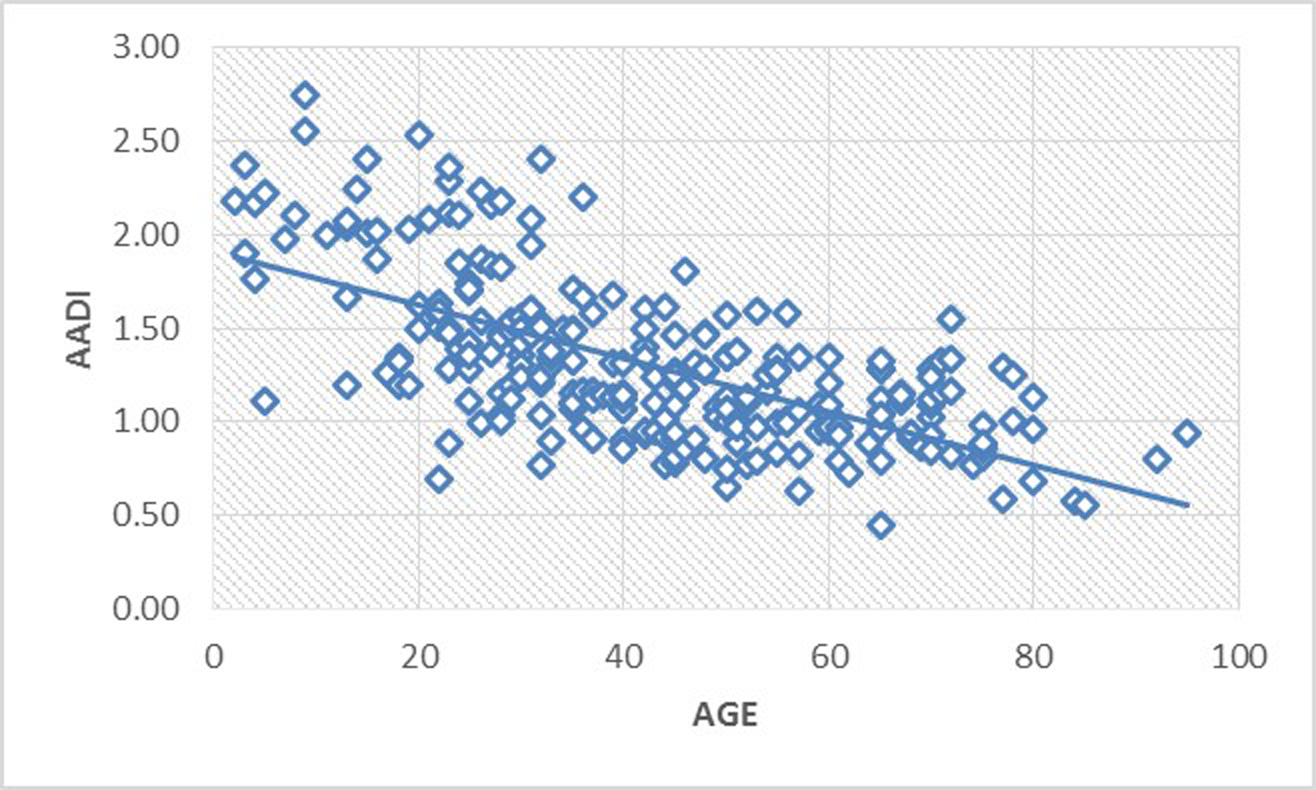
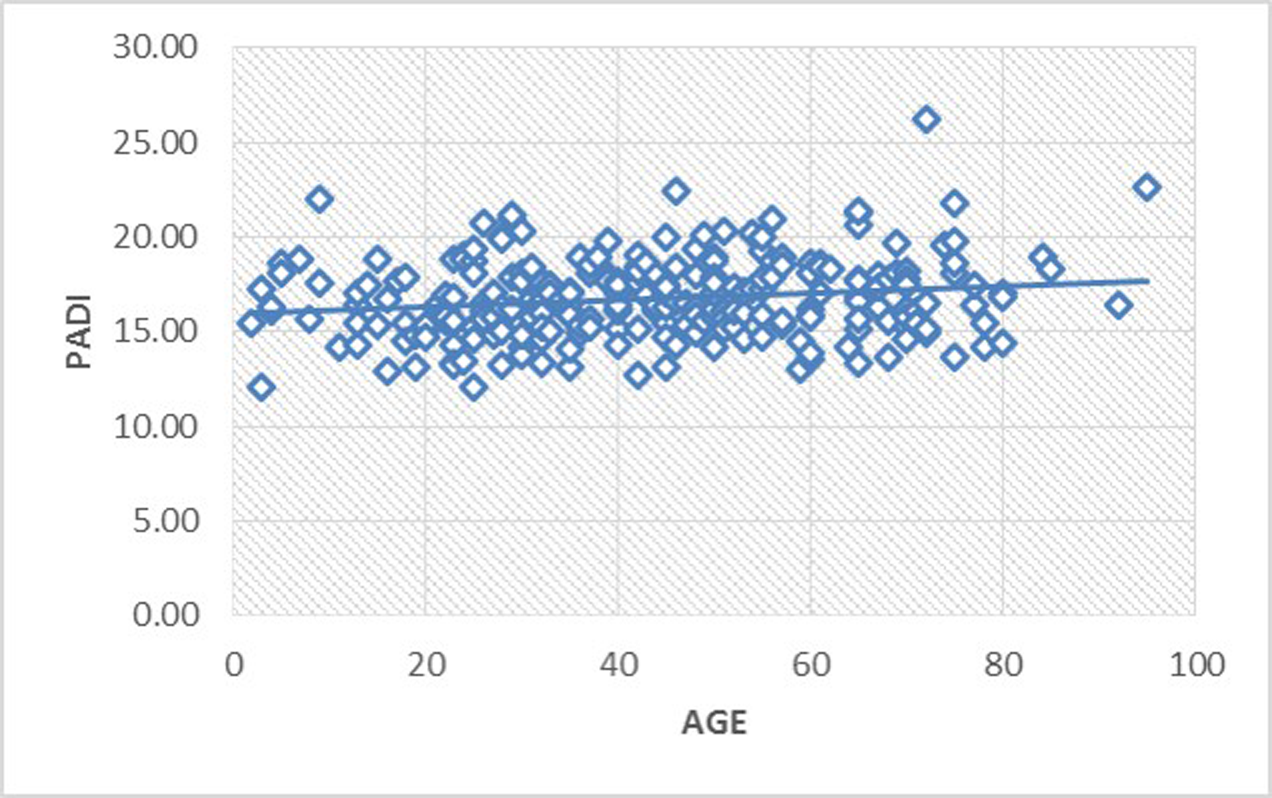
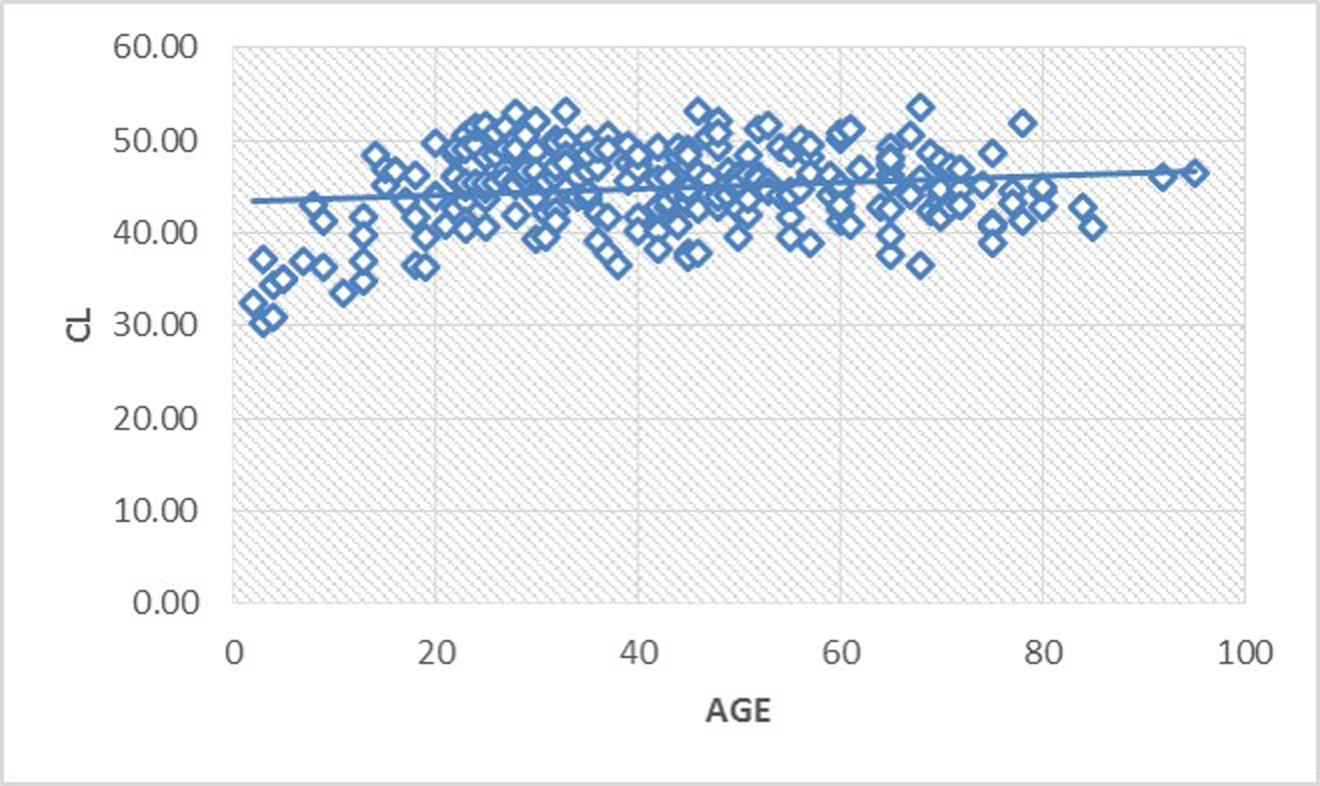
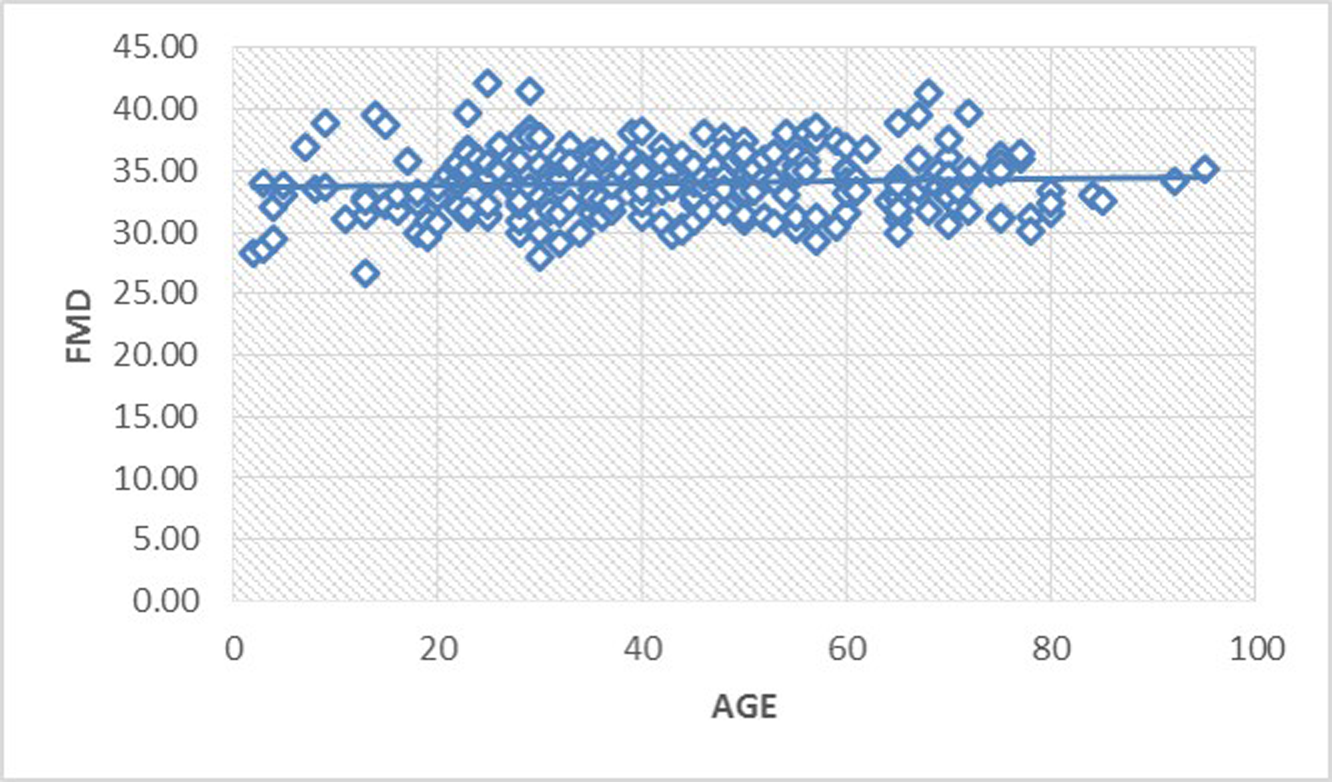
Fig. 2 3 4 5 6 7 show the scatter graph for all six parameters against the age of cases. It is evident that the value of AADI decreases as age advances. While CL increases till adolescent age and is constant thereafter, rest of the four parameters are almost constant throughout the age.
-
Fig. 2 Scatter diagram illustrating the relationship of AADI with age. Value of AADI decreases as age advances. AADI, anterior atlantodental interval.
Fig. 2 Scatter diagram illustrating the relationship of AADI with age. Value of AADI decreases as age advances. AADI, anterior atlantodental interval.
-
Fig. 3 Scatter diagram illustrating the almost constant relationship of PADI with age. PADI, posterior atlantodental interval.
Fig. 3 Scatter diagram illustrating the almost constant relationship of PADI with age. PADI, posterior atlantodental interval.
-
Fig. 4 Scatter diagram illustrating increasing CL till adolescent age followed by a constant plateau thereafter. CL, clivus length.
Fig. 4 Scatter diagram illustrating increasing CL till adolescent age followed by a constant plateau thereafter. CL, clivus length.
-
Fig. 5 Scatter diagram illustrating the almost constant relationship of FMD with age. FMD, foramen magnum diameter.
Fig. 5 Scatter diagram illustrating the almost constant relationship of FMD with age. FMD, foramen magnum diameter.
-
Fig. 6 Scatter diagram illustrating the almost constant relationship of BA with age. BA, basal angle.
Fig. 6 Scatter diagram illustrating the almost constant relationship of BA with age. BA, basal angle.
-
Fig. 7 Scatter diagram illustrating the almost constant relationship of BOO with age. BOO, Boogard’s angle.
Fig. 7 Scatter diagram illustrating the almost constant relationship of BOO with age. BOO, Boogard’s angle.
Discussion
The stability of atlantodental space is maintained by many ligaments, namely, atlantodental ligament, transverse ligament of atlas, and alar ligaments. Thus, increase in the ADI is an indirect measurement of instability around the C1–C2 vertebra, although it does not necessarily imply neurological deficit. Most often, increased ADI is due to injury to the transverse ligament of atlas. In our study, we found the mean AADI as 1.3 mm with SD of 0.43 which was similar to the findings of Rojas et al11 (mean AADI = 1.3 mm, SD = 0.37), Kibo Yoon et al12 (mean AADI = 1.4, SD = 0.3) and Dash et al13 (mean AADI = 1.12, SD = 0.66). In review of literature, a Chinese study on 700 patients reported mean AADI of 1.77 mm with SD of 0.39 mm.14 The discrepancy in the values could be due to the demographic variation. The difference in the male and female values of AADI were statistically insignificant, which is in agreement with other studies.11 14
We also found AADI levels to reduce as age advances, which was consistent with findings reported by Liu K et al14 and Osmotherly PG15 et al. Pediatric age group (less than 18 years) has been reported to have a mean ADI of 2.25 mm (SD = 0.24 mm),16 while we have found the mean AADI to be 1.89 mm (SD = 0.456 mm) in cases less than 20 years of age (Table 3).
We conclude that for rural population, the value of AADI >2.16 mm (mean + 2SD) (Table 1) should be considered as an indirect means of transverse ligament rupture and a setting of limited resources, similar to our institution, should look at the possibility of C1–C2 fixation surgery. Also, for higher values of ADI, one should think of the possibility of higher sagittal angulation of C2 pedicle screw placement.
Boden et al6 reported that the value of PADI less than 14 mm was associated with neurological deficits in 97 percent of the cases. This value was significantly greater than our value of PADI. The difference in the value of PADI could be because our study was conducted on multidetector computed tomography (MDCT), while Bodens’ study was based on plain. X-ray. Kibo Yoon et al12 on MDCT reported the mean PADI values to be 18 mm and SD of 2.1 with range between 13.0 to 23.7 mm. In our study, we have found the cutoff limit of PADI associated with significant neural compromise as 13.5 mm. The authors suggest that for cases where PADI is < 13.5 mm and significant neural compression exists on MRI, decompression of spinal canal in the form of adequate removal of part of C1 arch should be considered. Also, PADI values in the current paper shows lower values in females, which may predispose them to neuro deficits earlier than men.
CL value of 44.91 mm was comparable to the study conducted by Heiss et al (mean = 43.2 mm, SD = 3.5 mm)17 and Batista et al18 (mean = 44.7 mm, SD = 3.5 mm). Dufton et al19 and Heiss et al17 have found CL to be shorter in patients with type I Chiari malformation as compared with normal subjects. Similarly, it was observed that there was a negative correlation between CL and tonsillar herniation.
The mean FMD was 34.03 with SD of 2.54, which correlates with the study conducted by Batista et al13 (mean = 33.9 mm, SD = 2.7 mm) and Dash et al (mean = 36.29 mm, SD = 2.35 mm).18
A study conducted by Botelho et al has found an almost similar BOO with mean value of 126 degree (SD = 9.4 degree).7 Alkoc et al also reported the mean value of BOO as 136.9 degree for the normal control group.20 Based on our study, we conclude that diagnosis of platybasia should be made if BOO is > 141.84 degree.
Botelho et al,7 Dash13 et al, and Konigsberg et al21 reported mean values of BA as 119, 121.65, and 129 degrees, respectively. Bothelo7 and Dash13 measured BA as angle formed by the line between the nasion to dorsum sellae, intersecting the line from the basion to the dorsum sellae. In our study, we measured the BA along the center of pituitary fossa. McGregor,8 Poppel,9 Konigsberg,21 and Brailsford22 also evaluated BA similarly in their studies (Table 4). Botelho et al7 reported that the diagnosis of platybasia should be made when BA is above 133 degrees. Smoker et al23 advocated that BA must be < 140° and diagnosis of platybasia should be made for angles above 140°. In our study, we found the upper cutoff limit of BA for male to be 138 (mean = 129.7, SD = 4.139) and female to be 140.9 (mean = 131.4, SD = 4.774).
|
Author |
Technique |
Mean |
Maximum |
Minimum |
|---|---|---|---|---|
|
Abbreviations: AADI, anterior atlantodental interval; BA, basal angle; BOO, Boogard’s angle; CL, clivus length; FMD, foramen magnum diameter; PADI, posterior atlantodental interval. |
||||
|
McGreger8 |
Radiography |
134 |
148 |
121 |
|
Brailsford22 |
Radiography |
135 |
149 |
121 |
|
Poppel et al9 |
Radiography |
137 |
152 |
123 |
|
Koenigsberg at al21 |
MR imaging |
129 |
143 |
113 |
|
This study |
CT imaging |
130.24 |
142 |
117 |
Although there have been differences reported in gender-based values of ADI, FMD and BA, they have not been found to be statistically significant,13 unlike our findings. We found smaller PADI, FMD, and BA in females as compared with males.
Conclusion
There are variations in the normative data about CVJ parameters all around the world. Females have lower FMD, lower PADI, and higher values for platybasia angle than men. Since, our center represents a major draining tertiary rural setup in central India, these study interpretations could be extrapolated to the rest of surrounding population of India for future references.
Conflict of Interest
None declared.
Funding None.
References
- Craniovertebral junction instability: a review of facts about facets. Asian Spine J. 2015;9(4):636-644.
- [Google Scholar]
- National Family Health Survey (NFHS-3) Vol Volume I. Mumbai: IIPS; 2007. 2005–06: India:
- [Google Scholar]
- Instability and basilar invagination. J Craniovertebr Junction Spine. 2012;3(1):1-2.
- [Google Scholar]
- Principles and Practice of Pediatric Neurosurgery. (2nd ed). New York: Thieme; 2008. p. :396 p.
- [Google Scholar]
- Measurement of the atlanto-dental interval in the adult. Am J Roentgenol Radium Ther Nucl Med. 1960;84:945-951.
- [Google Scholar]
- Rheumatoid arthritis of the cervical spine. A long-term analysis with predictors of paralysis and recovery. J Bone Joint Surg Am. 1993;75(9):1282-1297.
- [Google Scholar]
- Angular craniometry in craniocervical junction malformation. Neurosurg Rev. 2013;36(4):603-610, discussion 610.
- [Google Scholar]
- The significance of certain measurements of the skull in the diagnosis of basilar impression. Br J Radiol. 1948;21(244):171-181.
- [Google Scholar]
- Basilar impression and platybasia in Paget’s disease. Radiology. 1953;61(4):639-644.
- [Google Scholar]
- Dean AG, Sullivan KM, Soe MM. OpenEpi: Open Source Epidemiologic Statistics for Public Health. Available at: www.OpenEpi.com. Accessed February 1, 2020
- Reassessment of the craniocervical junction: normal values on CT. AJNR Am J Neuroradiol. 2007;28(9):1819-1823.
- [Google Scholar]
- Anterior atlantodental and posterior atlantodental intervals on plain radiography, multidetector CT, and MRI. J Korean Soc Radiol. 2015;72(1):57-64.
- [Google Scholar]
- Craniovertebral junction evaluation by computed tomography in asymptomatic individuals in the Indian population. Neurol India. 2018;66(3):797-803.
- [Google Scholar]
- Reference ranges for atlantodental interval in adults and its variation with age and gender in a large series of subjects on multidetector computed tomography. Acta Radiol. 2015;56(4):465-470.
- [Google Scholar]
- The influence of age, sex, and posture on the measurement of atlantodental interval in a normal population. J Manipulative Physiol Ther. 2013;36(4):226-231.
- [Google Scholar]
- Estimation of normal computed tomography measurements for the upper cervical spine in the pediatric age group. J Neurosurg Pediatr. 2014;14(4):425-433.
- [Google Scholar]
- Normalization of hindbrain morphology after decompression of Chiari malformation Type I. J Neurosurg. 2012;117(5):942-946.
- [Google Scholar]
- Computed tomography evaluation of the normal craniocervical junction craniometry in 100 asymptomatic patients. Neurosurg Focus. 2015;38(4):E5.
- [Google Scholar]
- Posterior fossa measurements in patients with and without Chiari I malformation. Can J Neurol Sci. 2011;38(3):452-455.
- [Google Scholar]
- Stereological and morphometric analysis of MRI Chiari malformation type-1. J Korean Neurosurg Soc. 2015;58(5):454-461.
- [Google Scholar]
- Craniovertebral junction: normal anatomy, craniometry, and congenital anomalies. Radiographics. 1994;14(2):255-277.
- [Google Scholar]


