
Translate this page into:
An Exploratory Analysis of the Internal Structure of Test Through a Multimethods Exploratory Approach of the ASQ:SE in Brazil

Luis Anunciação, PhD Department of Psychology, Pontifical Catholic University of Rio de Janeiro Rio de Janeiro, Brazil 22451-900 luisfca@puc-rio.br
This article was originally published by Thieme Medical and Scientific Publishers Pvt. Ltd. and was migrated to Scientific Scholar after the change of Publisher.
Abstract
Abstract
Background A wide range of exploratory methods is available in psychometrics as means of gathering insight on existing data and on the process of establishing the number and nature of an internal structure factor of a test. Exploratory factor analysis (EFA) and principal component analysis (PCA) remain well-established techniques despite their different theoretical perspectives. Network analysis (NA) has recently gained popularity together with such algorithms as the Next Eigenvalue Sufficiency Test. These analyses link statistics and psychology, but their results tend to vary, leading to an open methodological debate on statistical assumptions of psychometric analyses and the extent to which results that are generated with these analyses align with the theoretical basis that underlies an instrument. The current study uses a previously published data set from the Ages & Stages Questionnaires: Social-Emotional to explore, show, and discuss several exploratory analyses of its internal structure. To a lesser degree, this study furthers the ongoing debate on the interface between theoretical and methodological perspectives in psychometrics.
Methods From a sample of 22,331 sixty-month-old children, 500 participants were randomly selected. Pearson and polychoric correlation matrices were compared and used as inputs in the psychometric analyses. The number of factors was determined via well-known rules of thumb, including the parallel analysis and the Hull method. Multidimensional solutions were rotated via oblique methods. R and Factor software were used, the codes for which are publicly available at https://luisfca.shinyapps.io/psychometrics_asq_se/.
Results Solutions from one to eight dimensions were suggested. Polychoric correlation overcame Pearson correlation, but nonconvergence issues were detected. The Hull method achieved a unidimensional structure. PCA and EFA achieved similar results. Conversely, six clusters were suggested via NA.
Conclusion The statistical outcomes for determining the factor structure of an assessment diverged, varying from one to eight domains, which allowed for different interpretations of the results. Methodological implications are further discussed.
Keywords
psychometrics
statistics
multivariate analysis
Ages & Stages Questionnaires
internal structure.

Introduction
In one of his seminal papers, John Tukey said, “Far better an approximate answer to the right question, which is often vague, than an exact answer to the wrong question, which can always be made precise (p. 13).”1 With this statement, Tukey rooted his perception of statistics while statisticians were becoming overreliant on mathematical formalization at the cost of practical aspects of data analysis. Tukey further mentioned the gap between statistical models and reality and that several statistical tests tend to achieve dissimilar results even when they utilize the same data set as their respective source of analyses.2
Particularities aside, Tukey's quotation can be adequately applied to theoretical and analytical processes that are used to explore the internal structure of a psychological test. Today, partially through technological revolution, an almost infinite number of statistical methods can be used as exploratory analyses with varying results. Consequently, the decision-making process of the dimensionality of a tool can be moot, hanging between a statistically defensible solution and sometimes theoretically substantive coherence. Some authors even argue that this is an expected product of weak theories in psychology,3 mentioning that “statistical solutions to the replication crisis will only help ensure solid stones; they don't help us build the house.”4
Currently, there is agreement that psychometrics and statistics are at the core of the scientific method in psychology.5 Within this relationship, some even consider that psychometrics concepts are the front-end part (e.g., the definition of reliability) of the back-end calculations (e.g., the correlation matrix used to support the reliability definition) performed by data analysis and statistics. However, regardless of this relationship, the goal of psychometricians and statisticians when analyzing a particular empirically obtained data set may gradually vary.3
When analyzing the internal structure of an instrument, psychometricians aim to make calculations that enable a result's interpretation from the theoretical perspective based on the cognitive or affective processes assumed to have driven the observed responses. As suggested by Fabrigar et al, “a model that fails to produce a rotated solution that is interpretable and theoretically sensible has little value (p. 281).”6 In other words, empirical results should unveil a substantive theoretical framework.7 8 9 10
In turn, statisticians tend to be versatile and trained for a wide range of objects. Nonetheless, this extensive knowledge might be associated with only peripheral or incipient familiarity with field-based analyses, including the modeling of psychological data.11 Thus, in contrast to psychometricians, statisticians are expected to first apply a cautious view toward the development of data analysis to achieve results that will be shielded from criticism, even if some of the procedures that are employed eventually overshadow the psychological phenomena that once motivated the analyses.12 These two perspectives can lead to disputes, and statisticians and psychometricians can become entangled in an eternal tug of war about how to conduct the analytical process. The relationship between statistics and science is well documented in the literature.5 13 14
We, thus, explore the above scenario in this study through a data set composed of a large number of children assessed by the Ages & Stages Questionnaires: Social-Emotional (ASQ:SE).15 The current goal is to present and discuss several alternative solutions to the internal structure of the ASQ:SE. The exploratory methods used to check ASQ:SE dimensionality include: exploratory factor analysis (EFA), principal component analysis (PCA), and exploratory graph analysis (EGA). This study also makes use of both R and Factor as analytical software as well as several computer-based algorithms and stopping rules of dimensionality analyses. Theoretical interpretations are discussed to a lesser degree.
Methods
Study Population
The present study received ethical approval from the Ethical Committee of Pontifical Catholic University of Rio de Janeiro, Brazil (Public notice no. 0367/2011). The sample for the present study was drawn from larger census data. The present study conducted a secondary data analysis. The ASQ:SE project gathered data between 2010 and 2012 in Brazil at the time of a large-scale developmental assessment of children from 6 months to 5 years of age. Additional information on the goals of each section of this project can be found elsewhere.15
Participants
The original sample consisted of a census research including 22,331 sixty-month-old children enrolled in all 468 public daycare centers and preschools of the city of Rio de Janeiro. For the present study, the sample size was determined based on previous evidence of the effect of model size on practical fit indices of structural equation models.16 These findings suggest that the sample size of 500 participants is adequate to obtain an accurate confirmatory fit index, Tucker–Lewis index, and root mean square error of approximation in correctly specified models.
Therefore, a total of 500 children were randomly selected for the analyses. The randomness process was initiated in the fairsubset R package,17 with the seed defined at 15 and RNGversion set at 3.6. This subsample comprised 276 males (55.2%) and 224 females (44.8%).
Measures
Ages and Stages Social-Emotional Questionnaire in 5-Year-Old Children
The ASQ:SE was developed as a low-cost and psychometrically sound screening tool that accurately reflects a range of emotional and social behavioral competencies in infants, toddlers, and preschool age children. These behavioral areas include self-regulation, compliance, communication, adaptive functioning, autonomy, affect, and interaction with peers.18 All responses use a gradual format. The responses consist of “Most of the time” (0 points), “Sometimes” (5 points), and “Rarely or never” (10 points).
This tool has been used in different cultures and contexts.19 Previous cross-country studies that have used EFA and confirmatory factor analysis, as well as item response theory have concluded that the variability of ASQ:SE observed variables can be adequately explained in two dimensions namely a social and an emotional one.15 20 21 The ASQ:SE has been widely recognized as a useful screening tool for practitioners, clinicians, and families to identify children who may be facing a challenging environment or may be at risk of developmental delays.19
In this study, the ASQ:SE 60-month-old children were selected for the sample, as social and emotional skills are most easily discriminable in the age of 5, as pointed out by the specific literature.22 23 The behavioral competences explored relate to whether the child is interested in things such as toys, people, and/or food; is experiencing tantrums; can calm down after periods of exciting activities; and can look when someone talks to him/her. Responses, in turn, are analyzed in a gradual scale, in which higher scores suggest greater difficulty in child development.
Cronbach's α for this interval was 0.86 (95% confidence interval [CI]: 0.85–0.88), with an average interitem correlation of 0.17 (95% CI: 0.15–0.19). This age interval is composed of 32 items, in which respondents choose one option that best aligns with a target behavior of the child.
The mean score for these participants was 41 (standard deviation = 36.4, range: 0–205). This result was below the cutoff score, suggesting the participants were not at risk of developmental delays. No difference was found between this score and the score that was obtained with the full data set (t 22829 = −0.982, p = 0.326).
Statistical Analysis
All analyses were conducted within a random subset of the main data set in which 500 participants were included. No missing cases, inconsistencies, or outliers were found. The ASQ:SE responses to all items were modified as recommended by the statistical literature: 0 was transformed to 1, 5 was transformed to 2, and 10 was transformed to 3. Polychoric and Pearson correlations were computed and compared. Because of the ordinal level of the items, the polychoric correlation was mainly used as an input in the psychometric analyses together with an arbitrarily set of subjects and the entire sample. Smoothing methods were used to deal with convergence issues.24 25 26
Different methods to identify the number of factors or components that should be retained were explored via scree plot through parallel analysis (PA), the Hull method, the elbow rule, the Kaiser rule, Next Eigenvalue Sufficiency Test (NEST),27 and EGA. PCA was also employed. Although this is not a common factor model or latent trait analysis as psychometricians understand it to be, this method is frequently used in psychometric analysis and methodological papers.
The first methods rely on a similar graphical structure, in which a plot with eigenvalues is presented in descending order. Eigenvalues indicate the proportion of variance that is explained by each factor or component. The results of the scree plot depend on current data, but the machinery that underlies PA serves to (1) generate a simulated data set with N observations that are randomly sampled from the variables, (2) iteratively extract eigenvalues, (3) order them from largest to smallest, and (4) compute summary statistics of these simulated results to compare them to the first results.28
The Hull method is based on a numerical convex Hull-based heuristic and can be regarded as a generalization of the scree test, in which a plot is built with the goodness-of-fit (GoF) measure versus degrees of freedom (df). These heuristics seek to identify the best balance between GoF and df in in the following fashion: (1) the range of factors are considered to be determined, (2) the GoF of a series of factor solutions is assessed, (3) df of the series of factor solutions are computed, and (4) the elbow is located in the higher boundary of the convex Hull of the Hull plot.29 The NEST is a recent algorithm that was developed for R software that imports features of comparison data into the revised PA.
Recommendations obtained through each method were performed within the polychoric and Pearson matrix solution, which enabled the comparison of the both estimates. The weighted least squares solution was defined as the default factor estimation.30 31 Promax oblique rotation was defined for multidimensional solutions. In line with underlying phenomena, oblique rotations enable factors to be correlated. Robust unweighted least squares was used with the Hull method because it is more often suggested.32 Varimax (orthogonal) rotation was performed within the PCA framework as recommended.
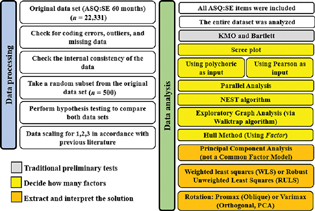
Finally, another set of analysis was performed through EGA. The results that derived from this analysis were also plotted into an easy-to-read network graph, wherein items in each dimension are color-coded, and edges are the partial correlation between two nodes given all other nodes in the network.33 The analytical flowchart in Fig. 1 displays these steps.
-
Fig. 1 Flowchart of psychometric data analysis. ASQ:SE, Ages & Stages Questionnaires: Social-Emotional; KMO, Kaiser–Meyer–Olkin; NEST, Next Eigenvalue Sufficiency Test; PCA, principal component analysis.
Fig. 1 Flowchart of psychometric data analysis. ASQ:SE, Ages & Stages Questionnaires: Social-Emotional; KMO, Kaiser–Meyer–Olkin; NEST, Next Eigenvalue Sufficiency Test; PCA, principal component analysis.
All of the analyses were performed in R 4.0.434 with tidyverse, psych (2.1.3), NEST, EGAnet (0.9.8), and Factor 10.10.03. Codes and data are freely available at https://luisfca.shinyapps.io/psychometrics_asq_se/.
Results
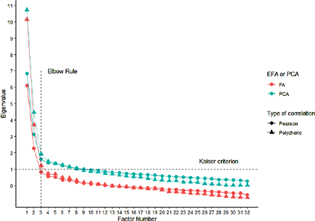
The distribution of ASQ:SE items was right-skewed, indicating deviation from normality and that the items' means were greater than the medians. Skews ranged from 0.87 to 6.04. Kurtosis ranged from −0.81 to 37.29. The Kaiser–Meyer–Olkin test result was 0.86. The Bartlett test result was 4629.517 (df = 496, p < 0.001). These first results are traditionally required as preliminarily steps of factor analysis. Fig. 2 shows the results of the scree plot. Three analytical solutions could be made: (1) elbow rule, which is based on sharp breaks in the plot, (2) Kaiser rule, which retains values with eigenvalues > 1, and (3) PA, which is based on a random data simulation and compares the scree plot of the observed data with the plot that is obtained from a random data matrix of the same size.
-
Fig. 2 Screen plot with the exploratory factor analysis (EFA) and principal component analysis (PCA) results that were obtained with polychoric and Pearson correlations.
Fig. 2 Screen plot with the exploratory factor analysis (EFA) and principal component analysis (PCA) results that were obtained with polychoric and Pearson correlations.
The scree plot shows that (1) the polychoric correlation extracted higher eigenvalues than Pearson correlation, and (2) PCA outperformed the explained variance when compared with FA, which is further discussed below. Polychoric correlations of the PCA results were 10.72, 4.46, and 1.91, respectively. The Pearson correlation results were 6.83, 3.12, and 1.6. The EFA outcomes were 10.13, 3.70, and 1.22 for polychoric correlations and 6.12, 2.26, and 0.83 for Pearson correlations.
These results allow for flexible determination of the number of factors with partial convergence to retain two or three factors. However, as suggested by the current literature, the use of polychoric correlations in ordinal variables26 and determination of the number of factors that were retained remained congruent when considering the polychoric matrix as the input.
Despite subjectivity of the elbow rule, this strategy emphasizes the retention of two factors. The Kaiser rule herein suggested the retention of three factors or eight components. The PA indicated the retention of three factors or two components when arbitrary sets were employed or eight factors and four components when all workable data were used. The NEST algorithm also recommended extracting eight factors. Table 1 shows possible solutions that were derived from these analyses, including the Pearson correlation matrix that was used as the input source.
|
Input matrix |
Stopping rule |
Extraction |
Solution |
|---|---|---|---|
|
Pearson |
Parallel analysis |
PCA |
3 components |
|
EFA |
7 factors |
||
|
Elbow rule |
PCA |
2 components |
|
|
EFA |
2 factors |
||
|
Kaiser rule |
PCA |
8 components |
|
|
EFA |
2 factors |
||
|
Hull method (Factor software) |
EFA |
1 factor |
|
|
NEST (R package) |
EFA |
8 factors |
|
|
Polychoric |
Parallel analysis |
PCA |
2 components (arbitrarily set) 4 components (all sample) |
|
EFA |
3 factors (arbitrarily set) 8 factors (all sample) |
||
|
Elbow rule |
PCA |
2 components |
|
|
EFA |
2 factors |
||
|
Kaiser rule |
EFA |
3 factors |
|
|
PCA |
8 components |
||
|
Hull method (Factor software) |
EFA |
1 factor |
Abbreviations: EFA, exploratory factor analysis; PCA, principal component analysis.
Using a different strategy, the Hull method suggested retaining one single factor. This unidimensional solution achieved a GoF of 0.936 with df of 464 (Table 2).
|
Factors |
GoF |
df |
Scree test value |
|---|---|---|---|
|
0 |
0 |
496 |
0 |
|
1 |
0.936 |
464 |
17.248a |
|
2 |
0.989 |
433 |
6.353 |
|
3 |
0.997 |
403 |
3.779 |
|
4 |
0.999 |
374 |
1.726 |
|
5 |
1 |
346 |
0 |
|
6 |
1 |
319 |
Abbreviations: df, degrees of freedom; GoF, goodness-of-fit.
These recommendations were fitted to data. Table 3 presents some of the results. The loadings (either factor or component) described the relationship between common factors and their indicators. These indices were computed using polychoric and Pearson correlations to compare both results. In turn, the cumulative proportion is an index of the extent to which the variance can be accounted for by extracted factors or components and is based on the average of the commonality.
|
Hull method |
Elbow rule |
Parallel analysis |
Principal component analysis |
Main factor |
|||||||
|---|---|---|---|---|---|---|---|---|---|---|---|
|
ASQ:SE |
F1 |
F1 |
F2 |
F1 |
F2 |
f3 |
F1 |
f2 |
1 |
2 |
3 |
|
q1-look at |
0.309 (0.2) |
0.19 (0.16) |
0.6 (0.48) |
0.21 (0.11) |
0.56 (0.46) |
0.08 (0.1) |
0.28 (0.19) |
0.67 (0.56) |
f2 |
f2 |
f2 |
|
q2-cling |
0.603 (0.39) |
0.56 (0.42) |
−0.22 (−0.16) |
0.1 (−0.15) |
−0.11 (−0.03) |
0.56 (0.59) |
0.55 (0.46) |
−0.11 (−0.1) |
f1 |
f3 |
f1 |
|
q3-be hugged |
0.564 (0.42) |
−0.17 (−0.09) |
0.66 (0.5) |
0.2 (0.27) |
0.53 (0.38) |
−0.36 (−0.31) |
−0.08 (−0.08) |
0.65 (0.55) |
f2 |
f2 |
f2 |
|
q4-play adults |
0.557 (0.4) |
−0.18 (−0.08) |
0.63 (0.43) |
−0.06 (0.01) |
0.61 (0.41) |
−0.08 (−0.07) |
−0.09 (−0.08) |
0.61 (0.47) |
f2 |
f2 |
f2 |
|
q5-calm down |
0.306 (0.25) |
0.56 (0.45) |
0.19 (0.12) |
0.32 (0.04) |
0.21 (0.19) |
0.36 (0.47) |
0.6 (0.49) |
0.32 (0.23) |
f1 |
f3 |
f1 |
|
q6-friendly |
0.605 (0.44) |
0.6 (0.38) |
−0.35 (−0.21) |
0.21 (−0.04) |
−0.27 (−0.13) |
0.46 (0.44) |
0.55 (0.41) |
−0.23 (−0.17) |
f1 |
f3 |
f1 |
|
q7-settle down |
0.244 (0.34) |
0.64 (0.59) |
0.16 (0.11) |
0.65 (0.6) |
0.08 (−0.02) |
0.08 (0.08) |
0.69 (0.6) |
0.31 (0.25) |
f1 |
f1 |
f1 |
|
q8-seem happy |
0.343 (0.19) |
−0.04 (−0.03) |
0.71 (0.53) |
−0.07 (−0.15) |
0.72 (0.59) |
0.12 (0.15) |
0.06 (0) |
0.72 (0.58) |
f2 |
f2 |
f2 |
|
q9-tantrums |
0.238 (0.27) |
0.7 (0.58) |
0.09 (0.06) |
0.31 (−0.13) |
0.15 (0.21) |
0.53 (0.78) |
0.73 (0.61) |
0.24 (0.19) |
f1 |
f3 |
f1 |
|
q10-interest |
0.245 (0.23) |
−0.12 (−0.08) |
0.85 (0.65) |
−0.08 (−0.09) |
0.85 (0.67) |
0.05 (0.04) |
0 (−0.04) |
0.84 (0.67) |
f2 |
f2 |
f2 |
|
q11-bathroom |
0.043 (0) |
0.29 (0.14) |
0.2 (0.11) |
−0.34 (−0.18) |
0.41 (0.21) |
0.77 (0.33) |
0.32 (0.16) |
0.26 (0.16) |
f1 |
f3 |
f1 |
|
q12-eating |
0.364 (0.17) |
0.55 (0.31) |
−0.09 (−0.05) |
0.19 (0.01) |
−0.01 (0) |
0.46 (0.32) |
0.54 (0.34) |
0.03 (0.01) |
f1 |
f3 |
f1 |
|
q13-stay |
0.202 (0.26) |
0.49 (0.44) |
0.36 (0.3) |
0.6 (0.42) |
0.26 (0.21) |
−0.02 (0.1) |
0.55 (0.47) |
0.49 (0.42) |
f1 |
f1 |
f1 |
|
q14-mealtime |
0.542 (0.35) |
0 (0.06) |
0.56 (0.4) |
0.02 (0.1) |
0.55 (0.37) |
0.05 (−0.01) |
0.08 (0.08) |
0.58 (0.47) |
f2 |
f2 |
f2 |
|
q15-do what |
0.108 (0.35) |
0.57 (0.55) |
0.37 (0.31) |
0.68 (0.73) |
0.26 (0.14) |
−0.02 (−0.06) |
0.64 (0.56) |
0.52 (0.45) |
f1 |
f1 |
f1 |
|
q16-active |
0.472 (0.47) |
0.78 (0.64) |
−0.26 (−0.21) |
0.63 (0.38) |
−0.3 (−0.24) |
0.22 (0.32) |
0.76 (0.65) |
−0.11 (−0.08) |
f1 |
f1 |
f1 |
|
q17-sleep |
0.543 (0.25) |
0.27 (0.17) |
0.18 (0.13) |
0.19 (0.05) |
0.18 (0.14) |
0.14 (0.14) |
0.3 (0.19) |
0.25 (0.19) |
f1 |
f1 |
f1 |
|
q18-needs |
0.313 (0.12) |
0.08 (0.03) |
0.64 (0.5) |
−0.08 (−0.13) |
0.69 (0.56) |
0.27 (0.19) |
0.17 (0.06) |
0.68 (0.55) |
f2 |
f2 |
f2 |
|
q19-feelings |
0.405 (0.29) |
−0.05 (−0.02) |
0.75 (0.63) |
−0.04 (0) |
0.75 (0.63) |
0.08 (0.03) |
0.05 (0.02) |
0.76 (0.67) |
f2 |
f2 |
f2 |
|
q20- activity |
0.197 (0.28) |
0.66 (0.61) |
0.17 (0.11) |
0.57 (0.47) |
0.13 (0.04) |
0.2 (0.22) |
0.71 (0.62) |
0.33 (0.25) |
f1 |
f1 |
f1 |
|
q21-explore |
0.544 (0.34) |
0.01 (0.03) |
0.56 (0.4) |
−0.08 (0.04) |
0.58 (0.39) |
0.16 (0.02) |
0.09 (0.05) |
0.57 (0.46) |
f2 |
f2 |
f2 |
|
q22-do over |
0.257 (0.06) |
0.7 (0.44) |
−0.16 (−0.11) |
0.25 (−0.04) |
−0.07 (−0.01) |
0.56 (0.51) |
0.67 (0.48) |
−0.01 (−0.03) |
f1 |
f3 |
f1 |
|
q23-hurt |
0 (0.06) |
0.77 (0.41) |
−0.07 (−0.08) |
0.65 (0.07) |
−0.11 (−0.03) |
0.21 (0.38) |
0.71 (0.45) |
0.12 (−0.01) |
f1 |
f1 |
f1 |
|
q24-follow rules |
0.163 (0.38) |
0.61 (0.61) |
0.26 (0.2) |
0.81 (0.94) |
0.11 (−0.04) |
−0.13 (−0.18) |
0.67 (0.62) |
0.41 (0.36) |
f1 |
f1 |
f1 |
|
q25-destroy |
0.197 (0.25) |
0.8 (0.68) |
−0.01 (−0.06) |
0.69 (0.37) |
−0.06 (−0.07) |
0.21 (0.38) |
0.82 (0.69) |
0.16 (0.1) |
f1 |
f1 |
f1 |
|
q26-stay away |
0.512 (0.33) |
0.36 (0.27) |
0.2 (0.13) |
0.38 (0.29) |
0.15 (0.07) |
0.04 (0.03) |
0.39 (0.29) |
0.29 (0.21) |
f1 |
f1 |
f1 |
|
q27-concern |
0.479 (0.37) |
0.24 (0.24) |
0.46 (0.34) |
0.49 (0.42) |
0.33 (0.22) |
−0.2 (−0.11) |
0.31 (0.27) |
0.53 (0.44) |
f2 |
f1 |
f2 |
|
q28-like |
0.144 (0.04) |
0.37 (0.27) |
0.51 (0.38) |
0.53 (0.24) |
0.4 (0.34) |
−0.07 (0.1) |
0.44 (0.31) |
0.62 (0.49) |
f2 |
f1 |
f2 |
|
q29-play children |
0.069 (0.07) |
0.01 (0.02) |
0.74 (0.52) |
0.18 (−0.03) |
0.67 (0.54) |
−0.1 (0.08) |
0.11 (0.04) |
0.78 (0.58) |
f2 |
f2 |
f2 |
|
q30-hurt adults |
0.334 (0.36) |
0.72 (0.6) |
0 (−0.05) |
0.84 (0.55) |
−0.13 (−0.15) |
−0.06 (0.13) |
0.73 (0.62) |
0.16 (0.09) |
f1 |
f1 |
f1 |
|
q31-take turns |
0.252 (0.41) |
0.62 (0.6) |
0.21 (0.15) |
0.68 (0.63) |
0.11 (0.02) |
0.03 (0.07) |
0.66 (0.61) |
0.36 (0.3) |
f1 |
f1 |
f1 |
|
q32-sexual |
0.546 (0.38) |
0.58 (0.37) |
−0.29 (−0.18) |
0.63 (0.25) |
−0.38 (−0.21) |
−0.03 (0.14) |
0.53 (0.4) |
−0.17 (−0.13) |
f1 |
f1 |
f1 |
|
Proportion variance |
0.33 (0.27) |
0.25 (0.16) |
0.19 (0.11) |
0.21 (0.12) |
0.18 (0.10) |
0.09 (0.08) |
0.26 (0.17) |
0.22 (0.14) |
|||
|
Cumulative variance |
0.44 (0.27) |
0.48 (0.30) |
0.48 (0.31) |
||||||||
Abbreviations: ASQ:SE, Ages & Stages Questionnaires: Social-Emotional; PA, parallel analysis; PCA, principal component analysis.
Note: The item contents were shortened for display. Main factors 1, 2, and 3 indicate elbow, PA, and PCA, respectively. Loadings that were computed by Pearson correlation are shown in brackets.
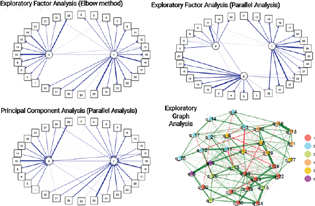
Lastly, the EGA returned six clusters. This method is based on network psychometrics and has recently gained visibility. Its interpretation is directly related to its statistical method. Edges correspond to partial correlation coefficients between two variables after conditioning all other variables in the network and a latent causal mechanism is not entirely necessary.35 Fig. 3 presents this result side-by-side with the previous one.
-
Fig. 3 Graphical representation of exploratory factor analysis (EFA) and principal component analysis (PCA) models and network analysis results.
Fig. 3 Graphical representation of exploratory factor analysis (EFA) and principal component analysis (PCA) models and network analysis results.
Discussion
The present study sought to present and discuss several alternative results to the internal structure of the ASQ:SE. Our results were a fundamental source of evidence because they checked the dimensionality of the assessment. Moreover, these analyses bridged psychological theoretical roots of a tool and its statistical findings.36 37 The main findings indicated that (1) PCA and FA tended to produce similar results, (2) polychoric correlation outperformed Pearson correlation and extracted higher eigenvalues than Pearson correlation but resulted in convergence problems, and (3) the number of factors that were retained allowed a unidimensional solution (Hull method) and solutions that were composed of six clusters (EGA) to uphold. These results are discussed below.
First, the solution obtained from PCA and FA methods completely agreed in terms of placing the item in its factor with the greater loading, with results reproducing some previously published evidence.15 38 From the statistical angle, both methods analyze the internal structure of a psychological test via multivariate analysis and some literature further considers that FA is a generalization of PCA.39
The overlapping findings that were produced by these two approaches have mathematical foundations in the way the decomposition of variance is performed. The total variance of each variable is formed by its shared variance (communality, h 2) and the unique variance (broken down into specific and error variance). EFA modeling accounts for communality only, relying its analyses in a reduced correlation matrix.40
PCA, on the other hand, is a data reduction method only, assuming that all variance is common or shared, with no division. Its models consider that the total variance equals the common variance, with no need of accounting for the unique variance. In this case, its statistical procedure operates through a linear combination of the observed variables, thereby aiming at creating components to summarize the original data while preserving as much information as possible.
The model-implied variance-covariance matrix of EFA is described as Σ = Λ Ψ Λ T + Θ, whereas this matrix of PCA is described as Σ = Λ Ψ Λ T . In both equations, Λ is a matrix of factor loadings, Ψ is a latent factor covariance matrix, and Θ is a matrix of residuals.41
In summary, as pointed out by Maxwell, (1) PCA is a formative model that (2) aims to maximize the variance, (3) without requiring an implicit hypothesis of the structure of covariance of the variables.42 In turn, (1) EFA reproduces correlations7 43 and (2) is well described as a latent reflexive variable model, but (3) although this method is a “sophisticated correlational method to locate regularity and trends in a large data set (p. 76),”44 it explicitly seeks to unveil the nature and number of (latent) factors or constructs and causal relationships among them.7 45 46
Despite the similarities of exploratory analyses, PCA has limited utility in confirmatory analyses with few GoF indices and also assumes a formative model instead of a reflexive model as previously described. This latter condition is commonly used by certain branches of psychometrics to criticize the use of PCA instead of EFA to deal with psychological data.
In the second result obtained, we found that eigenvalues that were produced by polychoric correlation were higher than eigenvalues that were produced by Pearson correlation. Determination of the numbers of factors that should be retained in EFA is intimately related to eigenvalues, and this result can foster different decision-making processes.
The current literature indicates that polychoric correlation is the most suitable method for analyzing data that are obtained by ordered items, such as Likert scales.47 48 However, this method builds on the assumption of underlying bivariate normality, which may not be the case of the distribution of ASQ:SE items. Previous simulation studies showed that solutions that are obtained using polychoric correlations provide a more accurate reproduction of the measurement model that is used to generate data. These studies also concluded that polychoric correlations were the most consistent and robust estimators, regardless of sample size and population correlation, and were the ones that tended to produce higher factor loadings and common fit indices within the EFA framework and confirmatory factor analysis.
However, some disadvantages and limitations that have been discussed in the literature were also noticed in this study. The nonconvergence problem is often detected by other studies, and its resolution (e.g., the use of smoothing corrections) can severely impair the reproducibility aspect of the results and provide unstable estimates and unstable GoF measures.25 49 Our data also suggested an overfactor result.
Additionally, some studies suggested that estimations of polychoric correlations are unstable as a psychological tool if there are a large number of items to analyze, if they have five or more response alternatives, or if small sample sizes are used as the input.50 To these limitations, a simulation study revealed that empirical eigenvalues of Pearson correlations generally outperformed those with tetrachoric correlations, a special case of polychoric correlations.25
Finally, multiple and partially opposite stopping rules arose from the methods that were used in this study. This result is widely known in psychometrics. There is a general consensus that the factor retention decision is still the most difficult area of EFA that depends on several (human-made) choices.43 This issue also explains the reason why some authors suggest using the term “unrestricted model” instead of EFA.
This choice illustrates the psychological theoretical perspective of a tool and its statistical findings, sometimes referred to as an abductive procedure.51 As previously discussed, from a purely statistical perspective, this procedure depends on stringent cumulative steps that seek to determine whether and how much of the derived solution is defensible. From the perspective of roots of a psychological tool, a solution needs to be theoretically interpretable. Solutions that consisted of one to eight factors or components were found.
In summary, the Hull method achieved a unidimensional solution using 5-year ASQ:SE data for illustration. Despite statistical plausibility, the unidimensional solution that derived from this approach appeared to be inadequate in capturing all aspects of development that a child experiences during early stages of development. The results of this unidimensional solution must also face substantial evidence that socioemotional development is a heterogeneous construct,18 52 53 thereby greatly limiting clinical application of this solution.
The two-dimensional solutions were obtained using the elbow rule. In the context of the ASQ:SE, these factors are often known as social and emotional. Social development refers to the manner in which a child develops friendships and other relationships and the ways in which a child handles conflicts among peers.54 The regulation of emotional arousal and emotional expressiveness are also encompassed in the way a child regulates his/her own emotions in diverse situations.
Three factors were suggested in the PA solution. From the statistical perspective, despite being considered one of the most accurate techniques for determining the number of factors to retain, the available evidence for PA is mixed in this regard.24 55 56 This third factor emerging after the PA suggestion brought together items relating to a child's more-than-expected clinging, self-regulation, sleeping problems with the presence of tantrums, and eating difficulties. Therefore, the new factor contained clinically mixed items, weakening its interpretation. The statistical plausibility and psychological interpretation of the solutions that contained more than three dimensions were limited and thus not interpreted.
The last statistical method performed was the EGA. Its clusters varied in terms of the item quantity and theoretical perspective. The characteristics of tantrums while sleeping and ability to independently calm himself/herself down when upset formed the group with the fewest items (in purple in Fig. 3). Items related to pervasive symptoms and aggressiveness were grouped together into a specific cluster (in red), as items related to affective behavior and communication (in yellow) were too. The theoretical appeal of this solution is fragile, sometimes making its interpretation quite difficult.
Limitations
There are a couple of limitations in this research study. As the results were not based on a data set with a known data processing generation (e.g., a simulated data set), the comparison between solutions cannot be looked in respect to a true model. Another limitation is the widely recognized assumption that different exploratory models within statistics will often give about different outputs and their conclusions will tend to vary. In addition, the results could have changed if the chosen extraction method and the rotation strategy were modified. However, despite having clear limitations, we showcased a common scenario very much experienced by researchers: when the study of the internal structure of a test is deemed and taken note of.
Conclusion
When any psychological tool is conceptualized, a set of studies integrating theoretical assumptions, empirical data collection, statistical requirements, and psychometric studies must be performed to delimitate that the results obtained through the use of the tool are assessing what was intended and producing reliable and stable results. In the absence of psychometric studies, the results lack scientific interpretation, are limited, and should not be used.57
The present study demonstrated that exploratory analyses tend to achieve different solutions, occasionally with different and contrafactual interpretations. These diverse possibilities also arise when traditional statistical assumptions of psychometric models are met. This output appears to allow a convenient (and sometimes questionable) use of psychometrics but also works as a guide to enhance connections between theoretical and substantive psychological models and statistical procedures.
Finally, this psychometric study of internal structure of a test is performed to integrate statistical plausibility and theoretical bases. The existence of multiple models and solutions is an undeniable issue that can highlight the theoretical fragility of psychological theories, but it can also pave the way toward progress, even at the cost of abandoning commonly used methods, including procedures that are described in this study.
Acknowledgments
The authors would like to acknowledge the Editor and reviewers for providing insightful comments on the manuscript.
Conflict of Interest
J.S. reported that he received some royalties and he used this financial return to do more research on the tool. The remaining authors do not report any conflicts of interests.
Funding None.
References
- Many analysts, one data set: making transparent how variations in analytic choices affect results. Adv Methods Pract Psychol Sci. 2018;1(3):337-356.
- [Google Scholar]
- Lack of theory building and testing impedes progress in the factor and network literature. Psychol Inq. 2020;31(4):271-288.
- [Google Scholar]
- Perspectives on psychometrics interviews with 20 past psychometric society presidents. Psychometrika. 2021;86(1):327-343.
- [Google Scholar]
- Evaluating the use of exploratory factor analysis in psychological research. Psychol Methods 1999
- [CrossRef] [Google Scholar]
- Factor analysis.The Reviewer's Guide to Quantitative Methods in the Social Sciences. New York, NY: Routledge; 2018. p. :98-122. In:
- [Google Scholar]
- Risky tests of etiological models in psychopathology research: the need for meta-methodology. Psychol Inq. 2015;26(3):253-258.
- [Google Scholar]
- On the nature and direction of relationships between constructs and measures. Psychol Methods. 2000;5(2):155-174.
- [Google Scholar]
- Exploratory factor analysis: a guide to best practice. J Black Psychol. 2018;44(3):219-246.
- [Google Scholar]
- False-positive psychology: undisclosed flexibility in data collection and analysis allows presenting anything as significant. Psychol Sci. 2011;22(11):1359-1366.
- [Google Scholar]
- Confirmatory analysis and normative tables for the Brazilian Ages and Stages Questionnaires: Social-Emotional. Child Care Health Dev. 2019;45(3):387-393.
- [Google Scholar]
- Understanding the model size effect on SEM fit indices. Educ Psychol Meas. 2019;79(2):310-334.
- [Google Scholar]
- FairSubset: a tool to choose representative subsets of data for use with replicates or groups of different sample sizes. J Biol Methods. 2019;6(3):e118.
- [Google Scholar]
- Identification of social-emotional problems in young children using a parent-completed screening measure. Early Child Res Q. 2001;16(4):405-419.
- [Google Scholar]
- Ages and Stages Questionnaire: a global screening scale. Bol Méd Hosp Infant México. 2017;74(1):5-12.
- [Google Scholar]
- Factor structure of a Social-Emotional screening instrument for preschool children. Psico-USF. 2019;24(3)
- [CrossRef] [Google Scholar]
- Examining the psychometric properties of the Brazilian Ages & Stages Questionnaires-Social-Emotional: use in public child daycare centers in Brazil. J Child Fam Stud 2017
- [CrossRef] [Google Scholar]
- Beginnings and beyond: foundations in early childhood education - Ann Miles Gordon, Kathryn Williams Browne - Google Livros. Belmont, CA: Wadsworth; 2014.
- [Google Scholar]
- Research and Practice in Infant and Early Childhood Mental Health. Switzerland: Springer International Publishing; 2016.
- [Google Scholar]
- A new look at Horn's parallel analysis with ordinal variables. Psychol Methods. 2013;18(4):454-474.
- [Google Scholar]
- Dimensionality assessment of ordered polytomous items with parallel analysis. Psychol Methods. 2011;16(2):209-220.
- [Google Scholar]
- Comparing the effects of different smoothing algorithms on the assessment of dimensionality of ordered categorical items with parallel analysis. PLoS One. 2016;11(2):e0148143.
- [Google Scholar]
- Determining the number of factors using parallel analysis and its recent variants: Comment on Lim and Jahng (2019) Psychol Methods. 2021;26(1):69-73.
- [Google Scholar]
- The Hull method for selecting the number of common factors. Multivariate Behav Res. 2011;46(2):340-364.
- [Google Scholar]
- The comparison of two methods of maximum likelihood (ML) and diagonally weighted least squares (DWLS) in testing construct validity of achievement goals. J Educ Manag Stude. 2014;4(1):22-38.
- [Google Scholar]
- Factor analysis with ordinal indicators: a Monte Carlo study comparing DWLS and ULS estimation. Struct Equ Model A Multidiscip J. 2009;16(4):625-641.
- [Google Scholar]
- . Confirmatory factor analysis of ordinal variables with misspecified models. Struct Equ Model A Multidiscip J. 2010;17(3):392-423.
- [Google Scholar]
- Exploratory graph analysis: a new approach for estimating the number of dimensions in psychological research. PLoS One. 2017;12(6):e0174035.
- [Google Scholar]
- Deconstructing the construct: a network perspective on psychological phenomena. New Ideas Psychol. 2013;31(1):43-53.
- [Google Scholar]
- Current concepts in validity and reliability for psychometric instruments: theory and application. Am J Med. 2006;119(2):166.e7-166.e16.
- [Google Scholar]
- Psychometrics and Psychological Assessment: Principles and Applications. Elsevier/AP, Academic Press, an imprint of Elsevier,
- [Google Scholar]
- Screening for social and emotional delays in young children who live in poverty: a Brazilian example. J Child Dev Disord. 2018;4(25):3-6.
- [Google Scholar]
- Factor analysis.Statistical Methods in Social Science Research. Singapore: Springer; 2018. p. :103-111. In:
- [Google Scholar]
- Principal component analysis and factor analysis: differences and similarities in nutritional epidemiology application. Rev Bras Epidemiol. 2019;22:e190041.
- [Google Scholar]
- Exploratory factor analysis with structured residuals for brain network data. Netw Neurosci. 2021;5(1):1-27.
- [Google Scholar]
- Factor Analysis and Principal Component Analysis. Milan, Italy: FrancoAngeli; 2013.
- [Google Scholar]
- Evaluating the use of exploratory factor analysis in developmental disability psychological research. J Autism Dev Disord. 2010;40(1):8-20.
- [Google Scholar]
- Factor analysis in counseling research and practice. Couns Outcome Res Eval. 2013;4(2):75-98.
- [Google Scholar]
- Choosing the optimal number of factors in exploratory factor analysis: a model selection perspective. Multivariate Behav Res. 2013;48(1):28-56.
- [Google Scholar]
- 12 factor analysis and related methods.Epidemiology and Medical Statistics. 2007. p. :367-394. In: eds. (07)27012–9
- [CrossRef] [Google Scholar]
- Polychoric versus Pearson correlations in exploratory and confirmatory factor analysis of ordinal variables. Qual Quant. 2010;44(1):153-166.
- [Google Scholar]
- Exploratory factor analysis: current use, methodological developments and recommendations for good practice. Curr Psychol 2019
- [CrossRef] [Google Scholar]
- Not positive definite correlation matrices in exploratory item factor analysis: causes, consequences and a proposed solution. Struct Equ Model 2021
- [CrossRef] [Google Scholar]
- The exploratory factor analysis of items: guided analysis based on empirical data and software. An Psicol/Ann Psychol 2017
- [CrossRef] [Google Scholar]
- Modeling psychological attributes in psychology - an epistemological discussion: network analysis vs. latent variables. Front Psychol. 2017;8:798.
- [Google Scholar]
- Social-emotional learning skill, self-regulation, and social competence in typically developing and clinic-referred children. J Clin Child Adolesc Psychol. 2009;38(6):858-871.
- [Google Scholar]
- Socioemotional development.Encyclopedia of Human Behavior. Elsevier: Burlington, Massachusetts; 2012. p. :504-511. In:
- [Google Scholar]
- International Encyclopedia of the Social & Behavioral Sciences. (2nd ed.). Elsevier; 2015.
- [Google Scholar]
- An improvement on Horn's parallel analysis methodology for selecting the correct number of factors to retain. Educ Psychol Meas. 1995;55(3):377-393.
- [Google Scholar]
- An illustration of issues in factor extraction and identification of dimensionality in psychological assessment data. J Pers Assess. 2006;86(3):263-272.
- [Google Scholar]
- Standards for educational and psychological testing. American Educational Research Association; 2014. (Eds.)
- [Google Scholar]


