
Translate this page into:
Validation and Diagnostic Accuracy of Hindi Restless Legs Syndrome (RLS-H) Screening Tool
This article was originally published by Thieme Medical and Scientific Publishers Pvt. Ltd. and was migrated to Scientific Scholar after the change of Publisher.
Abstract
Abstract
Background Restless legs syndrome (RLS), a prevalent and treatable entity, has high impact on quality of life, requiring a better screening tool for its early detection. Thus, present study aimed to derive a Hindi RLS (RLS-H) screening tool for its use in Indian population.
Materials and Methods RLS-H screening tool, derived by translating first four criteria of 2012 revised International Restless Legs Syndrome Study Group (IRLSSG) diagnostic criteria in Hindi and was validated in 50 RLS and 50 non-RLS patients. This validated RLS-H tool was used to screen 1,066 patients attending neurology clinic for assessing its diagnostic accuracy. Internal consistency, discriminatory validity, and various diagnostic yields were calculated. IRLSSG was used as gold standard for final diagnosis of RLS.
Results RLS-H screening tool had an internal consistency of 0.910. No correlation was found between RLS-H screening tool and Epworth sleepiness scale, Pittsburgh sleep quality index, or International Restless Legs Syndrome Study Group rating scale indicating satisfactory discriminant validity. Prevalence of RLS was 13.6%. The question (Q)1 had highest sensitivity (97.9%) and Q4 had highest specificity (92.66%). Thus, its combinations (Q1 + Q4) along with addition of Q2 or Q3 were compared for best combination of diagnostic accuracy. A minimum cutoff value of RLS-H screening tool was 2.5 for considering patients requiring detailed RLS evaluation.
Conclusion RLS-H screening tool can be used as a screening tool for early detection of RLS among susceptible patients. Patients answering “yes” to more than two questions (cutoff = 2.5) or “yes” to Q1 and Q4 should be interviewed and assessed for RLS.
Keywords
restless legs syndrome
translation
validation
screening
patient
Hindi RLS screening tool

Introduction
Restless legs syndrome (RLS), also known as Willis–Ekbom's disease is a sensory motor neurological disorder. It is defined as an urge to move the legs, RLS begins or worsens during periods of rest or inactivity in evening or night often relived, partially or totally by movement and is not accounted solely as symptoms due to another condition.1 As its diagnosis relies mainly on patient's self-report, it is often underdiagnosed; however, overdiagnosis is also not uncommon due to the overlap of symptoms with several other conditions which mimic RLS.2 3
Prevalence of RLS varies from 2 to 11% which could be due to use of different methodologies for its diagnosis and also due in part to a large number of mimickers of RLS.4 5 The 2012 revised International Restless Legs Syndrome Study Group (2012 revised IRLSSG) diagnostic criteria for RLS provides guidance in differential diagnosis hence, improving its specificity.6 This criterion not only considers the issues of clinical significance and clinical course but it also emphasizes on the severity range and heterogeneity of clinical manifestations.
Several screening tools of variable questions have been developed. These questionnaires are either oversimplified, thus lost their diagnostic yield or were too lengthy to be used as screening tool.7 A single screening question though has shown to have very high sensitivity (100%) and specificity (96.8%) in normal population by Ferri et al but it showed low yield in hemodialysis patients, limiting its use in special population.8 9 As final diagnosis is made based on 2012 revised IRLSSG, criteria clinicians also assess patients with lot of questions based on these criteria to make diagnosis in clinical settings. Hence, a screening questionnaire in patients' language, based directly on 2012 revised IRLSSG criteria may reduce heterogeneity in way of asking questions. Thus, a patient centric self-administered screening tool based on IRLSSG criteria without oversimplification may ease population study increasing its generalized applicability. Thus, in the present study, first four criteria of 2012 revised IRLSSG diagnostic criteria were translated in Hindi and were framed as questions to assess its utility as a patients self-reported screening tool for RLS among Hindi-speaking Indian population for easy selection of high-risk patients for detailed evaluation.
Materials and Methods
Study Setting and Procedure
The study was conducted at a tertiary care teaching institute in Central India. Adult patients (>18 years) of either gender, attending the neurology outpatient department (OPD) were invited to participate in this questionnaire-based two-phased study.
The participants were enrolled in two phases (Fig. 1):
-
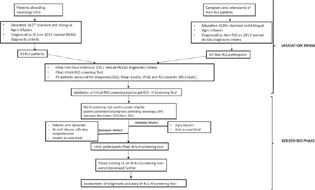
Fig. 1 Flow chart to show the study flow in two phases: validation phase and screening phase. ESS, Epworth sleepiness scale; IRLS, International Restless Legs Syndrome Study Group rating scale; IRLSSG, International Restless Legs Syndrome Study Group; OPD, outpatient department; PSQI, Pittsburgh sleep quality index; RLS, restless legs syndrome;
Fig. 1 Flow chart to show the study flow in two phases: validation phase and screening phase. ESS, Epworth sleepiness scale; IRLS, International Restless Legs Syndrome Study Group rating scale; IRLSSG, International Restless Legs Syndrome Study Group; OPD, outpatient department; PSQI, Pittsburgh sleep quality index; RLS, restless legs syndrome;
-
Validation phase (first phase)
-
Screening phase (second phase)
-
In the first phase of the study, detailed history pertaining to time course and frequency of symptoms was taken. All the mimickers were excluded and were mentioned as other leg complaints as habitual foot tapping, burning feet, positional discomfort, nocturnal cramps, and leg pains. All participants underwent complete neurological examination.
-
In the second phase of the study, all the eligible participants including patients and caregivers attending the neurology OPD were enrolled in the study.
Translation in Hindi (RLS-H Screening Tool)
The first four criteria of 2012 revised IRLSSG diagnostic criteria were translated in Hindi and were framed in a question form. It was further validated for its use as a self-assessment RLS-H screening tool. It was translated in Hindi by two independent bilingual experts and carefully pooled together to form a new self-assessment tool (Version 1), in which care was taken that all the points of 2012 revised IRLSSG diagnostic criteria are preserved. Version 1 was back translated to English by two other bilingual experts and reconciled. It was compared with first four criteria of original English 2012 revised IRLSSG diagnostic criteria. The points of disagreement were discussed, and appropriate changes were made to get the Version 2 (Hindi). This Version 2 was administered to five bilingual patients, who were asked to report any difficulty in understanding in any of the questions. Finally, Version 3 was concluded after incorporation of corrections, taking care that the translated items were complete, comprehensible, acceptable, as well as closest to the original scale except the fact that it was drafted in question from. “yes” to each question was marked as 1, and the maximum score was 4 (Table 1).
|
2012 revised IRLSSG diagnostic criteria |
RLS-H screening tool questions (based on IRLSSG criteria) |
|
|---|---|---|
|
1 |
An urge to move the legs usually but not always accompanied by or felt to be caused by uncomfortable and unpleasant sensations in the legs |
|
|
2 |
The urge to move the legs and any accompanying unpleasant sensations begin or worsen during periods of rest or inactivity such as lying down or sitting |
|
|
3 |
The urge to move the legs and any accompanying unpleasant sensations are partially or totally relieved by movement, such as walking or stretching, at least as long as the activity continues |
|
|
4 |
The urge to move the legs and any accompanying unpleasant sensations during rest or inactivity only occur or are worse in the evening or night than during the day |
|
|
5 |
The occurrence of the above features are not solely accounted for as symptoms primary to another medical or a behavioral condition (e.g., myalgia, venous stasis, leg edema, arthritis, leg cramps, positional discomfort, habitual foot tapping) |
Not translated |


Abbreviations: IRLSSG, International Restless Legs Syndrome Study Group; RLS-H, Hindi restless legs syndrome.
Study Population
Validation Phase (First Phase)
Fifty patients clinically diagnosed with RLS and 50 patients without RLS by 2012 revised IRLSSG diagnostic criteria, having at least intermediate or higher level of education who were capable of filling Hindi as well as English questionnaire on their own were included in this phase of study which took 4 months (July 2019 till October 2019). They were enrolled in the study only if there was agreement between two neurologists for diagnosis of RLS based on 2012 revised IRLSSG diagnostic criteria (gold standard) (Fig. 1).
Patients with dementia or any other disease affecting their comprehension abilities or unable to read the screening questionnaire were excluded. Only 41 patients could be assessed for daytime sleepiness (Epworth sleepiness scale [ESS]),10 sleep quality (Pittsburgh sleep quality index [PSQI]),11 and severity of RLS (International Restless Legs Syndrome Study Group rating scale [IRLS]).12 Screening phase was conducted after getting satisfactory results of the validation of RLS-H tool.
Screening Phase (Second Phase)
A total of 1,066 participants attending neurology OPD from November 2019 to May 2021 fulfilling the inclusion and exclusion criteria, who were at least able to read and understand Hindi were included in this phase of the study. These patients were given validated Hindi RLS screening tool (RLS-H Screening Tool) for filling on their own while waiting for their turn in OPD. Further, all the participants scoring >1 were assessed and interviewed in detail by a neurologist using the 2012 revised IRLSSG diagnostic criteria and confirmed by second neurologist for presence or absence of RLS. Disagreements were discussed and resolved by discussion (Fig. 1).
Statistical Analysis
The data were systematically recorded and analyzed using Microsoft Excel and IBM SPSS (version 21). The data normalcy was checked using the Kolmogorov–Smirnov's test. p-Values <0.05 were considered statistically significant. Reliability was determined by computing Cronbach's α coefficient, which was considered acceptable at >0.70 for the overall correlation between items within a scale. Convergent validity of RLS-H screening tool was assessed by Spearman's rank correlation with ESS, PSQI, and IRLS. Comparison of data between RLS and non-RLS was performed using chi-square test. Fisher's exact test was used if any cell had an expected value <5. Categorical data were summarized as counts (n) and percentages (%). Sensitivity, specificity, positive predictive value (PPV), negative predictive value (NPV), likelihood ratio positive (LR + ), and likelihood ratio negative (LR − ) are the diagnostic accuracy measures used in our study. Receiver operating characteristic (ROC) curve analysis was used to determine an overall accuracy of RLS-H screening tool to identify the individuals with or without inquired symptoms. In ROC analysis, RLS-H screening tool score was dependent variable and status of individuals (with RLS/without RLS) was the independent variable. Area under the ROC curve (AUROC) was calculated to measure how well the screening tool differentiates RLS patients from non-RLS individuals. Cutoffs of the minimum number of affirmative answers, with maximum sensitivity and specificity required for further assessment of RLS were also explored.
Results
In the validation phase, 50 RLS patients with mean age 40.12 ± 16.04 years and 50 non-RLS controls with mean age 35.94 ± 13.39 years were enrolled for assessing the validity of the RLS-H screening tool. More than 50% of the participants were males in both the groups, 27 (54%) among RLS group and 33 (66%) in non-RLS group, in the first phase of the study.
RLS-H screening scale showed good internal consistency with a Cronbach's α coefficient of 0.910. The mean scores for the RLS patients were significantly higher compared with the non-RLS patients (3.52 ± 0.67 vs. 0.4 ± 0.96; p < 0.0001) indicating that the screening tool had a satisfactory discriminative power to differentiate patients of RLS. Total score of RLS-H screening tool demonstrated weak (0–0.299) Spearman's rank correlation coefficient with ESS, PSQI, total IRLS demonstrating acceptable discriminant validity, as these scales (ESS, PSQI, IRLS) measure different dimensions (Table 2).
|
S. no. |
Questionnaire |
Spearman's rho (R) |
p-Value |
|---|---|---|---|
|
1 |
Total IRLS |
0.174 |
0.275 |
|
2 |
ESS |
0.116 |
0.468 |
|
3 |
PSQI |
0.132 |
0.411 |
Abbreviations: ESS, Epworth sleepiness scale; IRLS, International Restless Legs Syndrome Study Group rating scale; PSQI, Pittsburgh sleep quality index; R, Spearman's correlation.
Note: p < 0.05 is significant.
As the RLS-H screening tool showed good internal consistency, construct validity, and discriminative validity, it was further used for screening the patients for RLS to determine the diagnostic accuracy of RLS-H screening tool.
Screening Population
A total of 1,066 participants attending neurology OPD were screened for RLS using newly developed RLS-H screening tool; 454 (42.6%) males and 612 (57.5%) females with mean age 47.14 ± 14.70 years were screened between November 2019 to May 2021. Based on the number of affirmative answers of the RLS-H screening tool, all the participants were classified in five groups (Table 3). Those scoring >1 were interviewed for RLS according to the 2012 revised IRLSSG diagnostic criteria. Ninety-five patients reported yes to all four questions among which 66 (69.5%) had RLS. Almost one-third of patients were non-RLS despite yes to all the questions signifying the high prevalence of mimickers which mainly included patients with radiculopathy, peripheral neuropathy, somatoform disorders, positions discomfort, foot taping syndrome, leg cramps, localized dermatitis, obsession for foot tapping, and restlessness due to acute illness. Similarly, 112 patients reported yes to any three questions and 52 (46.42%) had RLS. However, only one-third of the individuals with yes to any two questions had RLS. Prevalence of RLS in our study was 13.6% (146) among 1,066 participants screened for RLS as per 2012 revised IRLSSG diagnostic criteria, in this hospital-based study.
|
Total yes |
Non-RLS |
RLS |
|---|---|---|
|
0 |
605 (100%) |
0 (0%) |
|
1 |
137 (100%) |
0 (0%) |
|
2 |
88 (75.82%) |
28 (24.13%) |
|
3 |
60 (53.67%) |
52 (46.42%) |
|
4 |
29 (30.52%) |
66 (69.47%) |
|
Total |
920 (86.30%) |
146 (13.69%) |
Abbreviations: Non-RLS, patients who were not having restless legs syndrome; RLS, patients having restless legs syndrome.
Note: p < 0.05 is significant. Data presented as N (%).
Maximum sensitivity of RLS-H was achieved for first question (97.26%) and maximum specificity was for fourth question (91.85%) (Table 4). As question Q1 and Q4 had good sensitivity and specificity, respectively, combination of two questions (Q1 + Q4), with further addition of Q3 and Q2 individually, was assessed for deriving the sensitivity and specificity of various combination of these questions of RLS-H screening tool (Fig. 2). Comparison of diagnostic accuracy parameters for combination of questions showed maximum sensitivity, specificity, NPV, and LR+ for the combination of Q1 + Q3 + Q4, but the AUROC and PPV were maximum for Q1 + Q4 (Table 5). A minimum cutoff value of the RLS-H screening tool was estimated from ROC analysis of “RLS patients” and “non-RLS” groups (Fig. 3). Cutoff of 2.5 correct responses showed an optimum sensitivity (80.8%), specificity (90.3%), for considering the screened patients for detailed RLS evaluation. Sensitivity dropped at higher cutoffs, while specificity was compromised at lower values (Table 6).
|
RLS-H tool |
Patients answering “yes” |
Diagnosed as RLS on IRLSSG criteria |
Sensitivity |
Specificity |
PPV |
NPV |
LR+ |
LR− |
DOR (CI) |
|---|---|---|---|---|---|---|---|---|---|
|
Q1 |
343 |
143 |
97.9% |
78.5% |
42.57% |
99.59% |
4.561 |
0.0256 |
177.9 (56.1–564) |
|
Q2 |
287 |
81 |
69.19% |
83.51% |
50.87% |
91.66% |
4.196 |
0.3689 |
11.37 (8.067–16.04) |
|
Q3 |
241 |
117 |
83.43% |
89.34% |
60.58% |
96.48% |
7.825 |
0.1855 |
42.18 (26.85–66.27) |
|
Q4 |
213 |
139 |
95.42% |
92.66% |
68.54% |
99.18% |
13 |
0.04937 |
263.4 (118.6–585) |
Abbreviations: CI, confidence interval; DOR, diagnostic odds; LR − , likelihood ratio of a negative test; LR + , likelihood ratio of a positive test; NPV, negative predictive value; PPV, positive predictive value; Q, question.
|
RLS |
Q1 + Q4 |
Q1 + Q2 + Q4 |
Q1 + Q3 + Q4 |
Q1 + Q2 + Q3 + Q4 |
|
AUROC |
0.931 |
0.731 |
0.845 |
0.711 |
|
Standard error |
0.013 |
0.021 |
0.022 |
0.027 |
|
95% confidence interval |
0.904–0.957 |
0.678–0.783 |
0.801–0.889 |
0.657–0.765 |
|
Sensitivity |
89.57% |
79.45% |
95.21% |
64.38% |
|
Specificity |
96.35% |
95.43% |
96.52% |
96.96% |
|
PPV |
81.56% |
73.42% |
81.29% |
77.05% |
|
NPV |
98.08% |
96.7% |
99.22% |
94.49% |
|
LR+ |
24.51 |
17.4 |
27.37 |
21.15 |
|
LR− |
0.1083 |
0.2153 |
0.04967 |
0.3673 |
|
DOR (CI) |
226.4 (122.9–417.1) |
80.83 (48.69–134.2) |
551 (238.6–1273) |
57.59 (34.71–95.54) |
Abbreviations: AUROC, area under the receiver operating characteristic curve; DOR, diagnostic odds; LR − , likelihood ratio of a negative test; LR + , likelihood ratio of a positive test; NPV, negative predictive value; PPV, positive predictive value; Q, question.
|
H-RLS tool |
Sensitivity |
Specificity |
PPV |
NPV |
LR+ |
LR− |
|---|---|---|---|---|---|---|
|
0.5 |
100% |
65.9% |
31.5% |
100% |
2.93 |
0 |
|
1.50 |
100% |
80.8% |
45.0% |
100% |
5.208 |
0 |
|
2.50 |
80.8% |
90.3% |
56.7% |
96.7% |
8.329 |
0.212 |
|
3.50 |
45.2% |
96.8% |
68.9% |
91.8% |
14.125 |
0.566 |
Abbreviations: LR − , likelihood ratio of a negative test; LR + , likelihood ratio of a positive test; NPV, negative predictive value; PPV, positive predictive value.
-
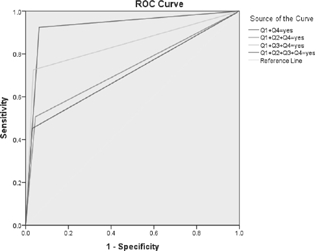
Fig. 2 Comparison of diagnostic accuracy parameters for combination of questions showed maximum AUROC for Q1 + Q4 followed by Q1 + Q3 + Q4. Addition of Q2 to the combination reduced the AUROC to 0.731 from 0.931 (AUROC of Q1 + Q4). AUROC, area under the ROC curve; ROC, receiver operating characteristic: Q, question.
Fig. 2 Comparison of diagnostic accuracy parameters for combination of questions showed maximum AUROC for Q1 + Q4 followed by Q1 + Q3 + Q4. Addition of Q2 to the combination reduced the AUROC to 0.731 from 0.931 (AUROC of Q1 + Q4). AUROC, area under the ROC curve; ROC, receiver operating characteristic: Q, question.
-
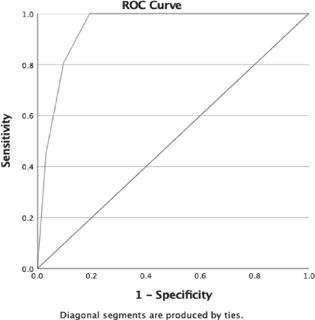
Fig. 3 Optimum sensitivity (80.8%) and specificity (90.3%) were obtained at a cutoff of 2.5 correct responses for considering the screened patients for detailed RLS evaluation. Sensitivity dropped at higher cutoffs, while specificity was compromised at lower values. RLS, restless legs syndrome.
Fig. 3 Optimum sensitivity (80.8%) and specificity (90.3%) were obtained at a cutoff of 2.5 correct responses for considering the screened patients for detailed RLS evaluation. Sensitivity dropped at higher cutoffs, while specificity was compromised at lower values. RLS, restless legs syndrome.
Discussion
In this study, first four criteria of 2012 revised IRLSSG diagnostic criteria were translated in Hindi and transformed in question form as RLS-H self-screening tool. It was further assessed for its utility as a screening tool among Hindi-speaking people from Central India. The RLS-H screening tool had good internal consistency with the four questions measuring different aspects of clinical presentation. This tool had satisfactory discriminative power with significantly different scores between RLS and non-RLS groups, and no association was observed between RLS-H screening tool scores with IRLS, ESS, and PSQI scores. This reflects satisfactory discriminative validity of RLS-H screening tool. Comparable prevalence of RLS detected by this tool to various epidemiological studies further adds weight to RLS-H screening tool. High diagnostic yield with positive response to combination of Q1 + Q4 or any of three questions makes it an appropriate self-screening tool in patients with RLS.
Presently, diagnosis of RLS is being done based on 2012 revised IRLSSG diagnostic criteria globally. Popat et al evaluated a study based on two sets of questionnaires, namely, RLS-NIH (based on NIH/IRLSSG [NIH] 2003) and RLS-EXP (self-developed questionnaire based on RLS with few added questions to reduce false positivity).13 The authors reported a high sensitivity (86%) but low specificity (45%) of RLS-NIH criteria but relatively fair sensitivity (81%) and specificity (73%) of RLS-EXP.13 Hence, specificity could be increased by adding more questions to rule out mimickers. In many studies, screening tools were developed and validated to diagnose RLS in specific populations. In a telephonic survey based on self-completed Cambridge-Hopkins questionnaire (CH-RLSq), sensitivity, specificity, and PPVs were 87.2, 94.4, and 85.5%, respectively.14 The CH-RLSq was further translated in Hindi with good sensitivity, specificity (both 83.3%), and PPV (86.6%).15 Although this scale has high diagnostic values, it contains self-answered 22 items, which is time cumbersome. In another study, Collister et al used 2012 revised IRLSSG diagnostic criteria for diagnosis of RLS in patients on hemodialysis and compared it with (1) a single screening question for RLS derived from a nondialysis population; (2) a single question from the Edmonton Symptom Assessment System; and (3) the IRLSSG rating scale (IRLS).9 Both the single question-based assessment tool had fair sensitivity of ∼80 to 85% but low specificity (56–58%). However, IRLS cutoff > 20 had better sensitivity and specificity.9 In another study, Ferri et al evaluated a single question “When you try to relax in the evening or sleep at night, do you ever have unpleasant, restless feelings in your legs that can be relieved by walking or movement?” for rapid screening of RLS in neurology clinics. It was found to have 100% sensitivity and 96.8% specificity,8 though it is quite sensitive but does not focus on clinical aspects of RLS individually.
Hening et al conducted a telephonic interview in 1,255 family members of RLS patient and asked four simple questions based on 2012 revised IRLSSG diagnostic criteria.16 Subjects with positive responses were asked to provide open descriptive details about their symptoms. However, if the reply to the first two questions was negative, no further questions were asked. Specificity of those questions was 86%, as 16% of the non-RLS patients reported positive response to all four questions. Hening et al suggested that few questions should be added to exclude false-positive cases.16 Another study from Turkey, evaluating 2012 revised IRLSSG diagnostic criteria for screening RLS, reported questionnaire-based diagnosis in only 34% which increased to 70.5% after neurological examinations.17 Interestingly, both studies excluded the subject after negative response to first two questions or first question, respectively. Excluding early based on few questions may reduce sensitivity and specificity of the questionnaire specially if patients have milder symptoms. Similarly, simplified “four-question”-based screening in a group of patients on chronic dialysis reported very low diagnostic yield probably due to confounders such as neuropathy and modified presentation.18 Also, simplification of the symptoms may be another possible cause for low yield. Shukla et al also developed a diagnostic scale (AIIMS RLS questionnaire for Indian patients [ARQIP]) in suspected RLS patients attending neurology clinic.19 The ARQIP scale had very high sensitivity (100%) but relatively low specificity (44%); however, this scale has 9 major parts with total 31 subcategories.19 Thus, the screening tools used were either very lengthy to make correct diagnosis and when simplified, they lost their diagnostic yield.
Various studies reported variable diagnostic yield of RLS depending on the nature and number of questionnaires used, mode of interview, as well as the target population. Irrespective of the questionnaire used, all patients were finally assessed by 2012 revised IRLSSG diagnostic criteria for final diagnosis of RLS. Hence, we used first four criteria of 2012 revised IRLSSG diagnostic criteria as screening tool. We evaluated the patients using the first four criteria of RLS, after translating it in local language, without oversimplification. Although our questions were long, but due to its self-administrability, patients had enough time to evaluate their own symptoms. Fifth question pertains to disease mimickers which are eliminated after interview by physicians; thus, it was excluded.
Like other studies, individual questions in present study also had variable sensitivity and specificity (Table 4). Interestingly, when we combined two or more questions, yield was much better. Assessment of AUROC for the best combination of questions shows that the best possible combination is of Q1 and Q4 which showed maximum AUROC of 0.931 with sensitivity of 89.57% and specificity of 96.35% (Table 5). Similarly, addition of Q3 to Q1 + Q4 increased the LR+ value to 27.37 with higher sensitivity (95.21%) without losing specificity. However, when all four questions were analyzed, sensitivity was quite low, probably due to low sensitivity of Q2. The Q2 assesses limb discomfort during rest without specifying diurnal worsening. Our participants who were selected from neurology OPD might have milder symptom of RLS, which could not be recognized by them during daytime, thus reducing the sensitivity of Q2. We also tried to detect a cutoff score for the minimum number of questions to be answered in affirmation with maximum sensitivity and specificity (80.8 and 90.3%, respectively) for diagnosis of RLS, which was 2.5 (Table 6). Thus, patients answering “yes” to more than two questions will have higher chance of having RLS. Further, combining our finding, we can say that those who answer yes to Q1 and Q4, or those with cutoff > 2.5 scores on RLS-H should be interviewed and assessed for RLS.
Limitations of the study are that maximum participants were recruited from neurology OPD, and thus, it may restrict generalization of our results to the entire population. Also, due to its cross-sectional design, we could not do the test–retest reliability which could be done in future follow-up study. Diagnosis of RLS completely depends on the explanation and understanding of uncomfortable feeling, uneasiness, and unpleasant sensation by the patients. Thus, translation of these feelings in words or sentences may not be enough to clarify the meaning of uncomfortable/unpleasant sensation which may be limitation of this short patient centric screening tool. However, the present tool has been derived from 2012 revised IRLSSG diagnostic criteria, which is the gold standard for making diagnosis for RLS, it will upraise the patients about the disease in question, and they will be in a better position to answer their physicians during one-to-one interactions in which they can explain their feelings in words.
Conclusion
RLS-H screening tool showed good reliability, construct, and discriminative validity. The RLS-H screening tool has acceptable sensitivity (80.8%) and specificity (90.3%) at a 2.5 cutoff and can be utilized for primary screening of patients for RLS. This will help in early diagnosis of this underdiagnosed entity and will reduce the morbidity as RLS is treatable in most of the cases. RLS-H questionnaire did not include questions to exclude mimicker. As it would be difficult to exclude mimickers by a self-reporting tool, suspected patients with scores more than 2.5 on RLS-H tool should be evaluated by a trained clinician to exclude RLS mimickers.16
Conflict of Interest
None declared.
Funding None.
References
- Restless legs syndrome/Willis-Ekbom disease diagnostic criteria: updated International Restless Legs Syndrome Study Group (IRLSSG) consensus criteria–history, rationale, description, and significance. Sleep Med. 2014;15(8):860-873.
- [Google Scholar]
- Common comorbidities and differential diagnosis of restless legs syndrome. J Clin Psychiatry. 2014;75(3):e06.
- [Google Scholar]
- Prevalence of restless legs syndrome: a community-based study from Argentina. Parkinsonism Relat Disord. 2009;15(6):461-465.
- [Google Scholar]
- [Cited June 6, 2021]. Accessed June 22, 2019 at:
- [Publisher]
- Evaluation of a screening interview for restless legs syndrome. Acta Neurol Scand. 2009;120(1):24-29.
- [Google Scholar]
- A single question for the rapid screening of restless legs syndrome in the neurological clinical practice. Eur J Neurol. 2007;14(9):1016-1021.
- [Google Scholar]
- Screening questions for the diagnosis of restless legs syndrome in hemodialysis. Clin Kidney J. 2018;12(4):559-563.
- [Google Scholar]
- A new method for measuring daytime sleepiness: the Epworth sleepiness scale. Sleep. 1991;14(6):540-545.
- [Google Scholar]
- The Pittsburgh Sleep Quality Index: a new instrument for psychiatric practice and research. Psychiatry Res. 1989;28(2):193-213.
- [Google Scholar]
- Validation of the International Restless Legs Syndrome Study Group rating scale for restless legs syndrome. Sleep Med. 2003;4(2):121-132.
- [Google Scholar]
- Reliability and validity of two self-administered questionnaires for screening restless legs syndrome in population-based studies. Sleep Med. 2010;11(2):154-160.
- [Google Scholar]
- Validation of the self-completed Cambridge-Hopkins questionnaire (CH-RLSq) for ascertainment of restless legs syndrome (RLS) in a population survey. Sleep Med. 2009;10(10):1097-1100.
- [Google Scholar]
- Hindi translation and validation of Cambridge-Hopkins diagnostic questionnaire for RLS (CHRLSq) Ann Indian Acad Neurol. 2015;18(3):303-308.
- [Google Scholar]
- The four diagnostic criteria for restless legs syndrome are unable to exclude confounding conditions (“mimics”) Sleep Med. 2009;10(9):976-981.
- [Google Scholar]
- Evaluation of the diagnostic criteria of restless leg syndrome in hemodialysis patients. Eur J Gen Med. 2007;4(4):145-148.
- [Google Scholar]
- Reliability of a questionnaire screening restless legs syndrome in patients on chronic dialysis. Am J Kidney Dis. 2002;40(2):302-306.
- [Google Scholar]
- Evaluation of the diagnostic yield of ARQIP: A new restless legs syndrome diagnostic questionnaire and validation of its Hindi translation. Neurol India. 2018;66(4):1020-1027.
- [Google Scholar]


