
Translate this page into:
Pulsatility Index Reflects Intracranial Pressure Better than Resistive Index in Patients with Clinical Features of Intracranial Hypertension
This article was originally published by Thieme Medical and Scientific Publishers Private Ltd. and was migrated to Scientific Scholar after the change of Publisher.
Abstract
Abstract
Background The intracranial pressure (ICP) is measured through various noninvasive methods to overcome complications of invasive ICP monitoring. In this study, transcranial Doppler was used to measure pulsatility index (PI) and resistive index (RI) that were correlated with opening intraventricular ICP. The opening intraventricular ICP was measured with the placement of intraventricular catheter in lateral ventricle without loss of cerebrospinal fluid.
Methods The prospective, observational study was conducted on 40 patients with clinical and radiological features of raised ICP who underwent either endoscopic third ventriculostomy or ventriculoperitoneal shunt surgery. The PI and RI were measured simultaneously with opening ICP measurements under general anesthesia. Both PI and RI were correlated with ICP by using Pearson correlation coefficient. The receiver operating characteristic (ROC) curve was used to get the optimal values of PI ad RI for corresponding ICP values.
Results The mean PI was 1.01 ± 0.41 and mean RI was 0.59 ± 0.32. The mean opening ICP value was 21.81 ± 8.68 mm Hg. The correlation between PI and RI with ICP was a statistically significant with correlation coefficient of 0.697 and 0.503, respectively. The ROC curve shown statistically significant association between PI and ICP from 15 to 40 mm Hg, whereas the association between RI and ICP was from 15 to 25 mm Hg, with various sensitivity and specificity.
Conclusion The opening intraventricular ICP correlated better with PI than RI in patients with features of raised ICP.
Keywords
intracranial pressure
endoscopic third ventriculostomy
ventriculoperitoneal shunt
general anesthesia

Introduction
Intracranial hypertension is a life-threatening complication following various central nervous system injuries such as stroke, neoplasms, hydrocephalus, encephalitis, and traumatic brain injury (TBI), which is associated with poor outcome. The intracranial pressure (ICP)-guided management of severe TBI patients is found to have good recovery and favorable outcome.1 2 Brain trauma foundation guideline also recommends the ICP monitoring in severe TBI, which reduces both in-hospital and 2-week postinjury mortality.3 ICP is usually measured and monitored through placement of invasive monitoring devices. The gold standard method of ICP monitoring is measured through intraventricular catheter due to its precise and accurate measurement.4 But, it is not devoid of side effects like misplacement of catheter (12.3%), difficult placement, hemorrhagic complications, catheter-related infections (3.4–32.2%), and those related to sudden decompression.5 6 7 8 9 10
To overcome complications of invasive methods, noninvasive methods of ICP measurement have been employed.11 12 The blood flow velocity of basal cerebral arteries mostly middle cerebral artery (MCA) is measured by transcranial Doppler (TCD) where both pulsatility index (PI) and resistive index (RI) are calculated. The mean and end-diastolic flow velocity is progressively reduced with increasing ICP, which leads to increase in both PI and RI. There is paucity of literature regarding correlation of PI and RI with opening intraventricular ICP.
Materials and Methods
This prospective, observational single-center study was performed in neurosurgery operation theater at tertiary level medical institute over 12 months. A total of 40 patients, aged between 8 and 65 years with clinical and radiological features suggestive of raised ICP posted for either endoscopic third ventriculostomy (ETV) or ventriculoperitoneal shunt (VP shunt), were included in the study. The approval from Institutional Ethics Committee (NK/1952/DM/3214) and written informed consent from patient or nearest relative were obtained. Patients in whom TCD window could not be formed or lateral ventricle could not be cannulated were excluded from the study.
A standard general anesthesia technique was used in all the participants. The anesthetic induction was performed with titrated dose of intravenous propofol and muscle relaxation achieved with intravenous vecuronium. Sevoflurane with air–oxygen mixture (50:50) was used for maintenance of anesthesia with minimum alveolar concentration value of 0.8 to 1.0. The patients were ventilated using Datex Ohmeda machine with target end-tidal carbon dioxide of 32 to 35 mm Hg. The MCA insonated through temporal window using 2 MHz probe of “SONARA VIASYS Healthcare” TCD machine. The temporal area was scanned by applying TCD probe perpendicular to the skull keeping a depth of insonation between 40 and 60 mm. If a faint signal found, then slight adjustments of the angle between the probe and skull were performed to get optimal signal of flow of MCA. Head frame was applied to hold the TCD probe in position where continuous TCD measurement could be possible. The PI and RI were calculated by TCD machine using following formulas:13 14
PI = (FVs–FVd)/FVm
RI = (FVs–FVd)/FVs, where
FVs is peak systolic flow velocity, FVd is end-diastolic flow velocity, and FVm is mean flow velocity.
The intraventricular ICP was measured by the operating surgeon after a burr hole craniotomy and dural reflection. A ventriculostomy catheter was introduced into the lateral ventricles, which was connected to pressure transducer through a high-pressure tubing. The pressure of lateral ventricle was measured without loss of cerebrospinal fluid (CSF) by using the closed system. The pressure was recorded for 3 minutes and the highest value was considered as the opening intraventricular ICP. The TCD and ICP measurements were recorded simultaneously.
Statistical analysis was performed using the statistical software SPSS (version 22, SPSS, Chicago, Illinois, United States and Statxat 3, Cytel Software, Cambridge, Massachusetts, United States). The distribution of the study measurements was verified using Shapiro–Wilk test. Parametric data was expressed as mean ± standard deviation. The parametric data was compared between the two groups using independent sample t-test. Pearson’s correlation test was used to evaluate the correlation of the TCD measurement of PI and RI with intraventricular ICP. The receiver operating characteristic (ROC) curve was drawn to find the optimal value of both the indices at various cutoff points of ICP at 95% confidence interval. Statistical significance was defined at p < 0.05.
Results
Forty patients with clinical and radiological features of raised ICP participated in the study, out of which 28 were male. The mean age of the patients was 24 ± 14.04 years and mean weight was 47.68 ± 16.92 kg. Two patients were of ASA II who had hypertension. The median Glasgow coma scale (GCS) was 15 with a range of 12 to 15 (Table 1). The patients diagnosed with intracranial pathology and underwent either ETV or VP shunt surgery (Table 2).
|
Parameter |
Values |
|
|---|---|---|
|
Abbreviations: ASA, American Society of Anesthesiologist; GCS, Glasgow coma scale; HTN, hypertension; SD, standard deviation. aValues expressed as mean ±SD. bNumber (percentage). |
||
|
Age (y)a |
24 ± 14.04 |
|
|
Weight (kg)a |
47.68 ± 16.92 |
|
|
Gender (M:F)b |
28 (70%):12 (30%) |
|
|
ASA class (I:II)b |
38 (95%):2(5%) |
|
|
Comorbidity (HTN)b |
2 (5%) |
|
|
GCS |
15 |
28 (70%) |
|
14 |
1 (2.5%) |
|
|
13 |
8 (20%) |
|
|
12 |
3 (7.5%) |
|
|
n |
||
|---|---|---|
|
Abbreviations: Acom, anterior communicating artery; CP, cerebellopontine; ETV, endoscopic third ventriculostomy; HCP, hydrocephalus; SOL, space occupying lesion; TBM, tubercular meningitis; VP shunt, ventriculoperitoneal shunt. Note: Values expressed as number. |
||
|
Diagnosis |
Third ventricle SOL |
7 |
|
Fourth ventricle SOL |
7 |
|
|
TBM with HCP |
7 |
|
|
Congenital HCP |
6 |
|
|
Obstructive HCP |
5 |
|
|
Intraventricular SOL |
3 |
|
|
Postoperative Acom aneurysm with HCP |
2 |
|
|
Postoperative basilar top aneurysm with HCP |
1 |
|
|
CP angle SOL with HCP |
1 |
|
|
Head injury with contusion and HCP |
1 |
|
|
Surgery |
ETV |
18 (45%) |
|
VP shunt |
22 (55%) |
|
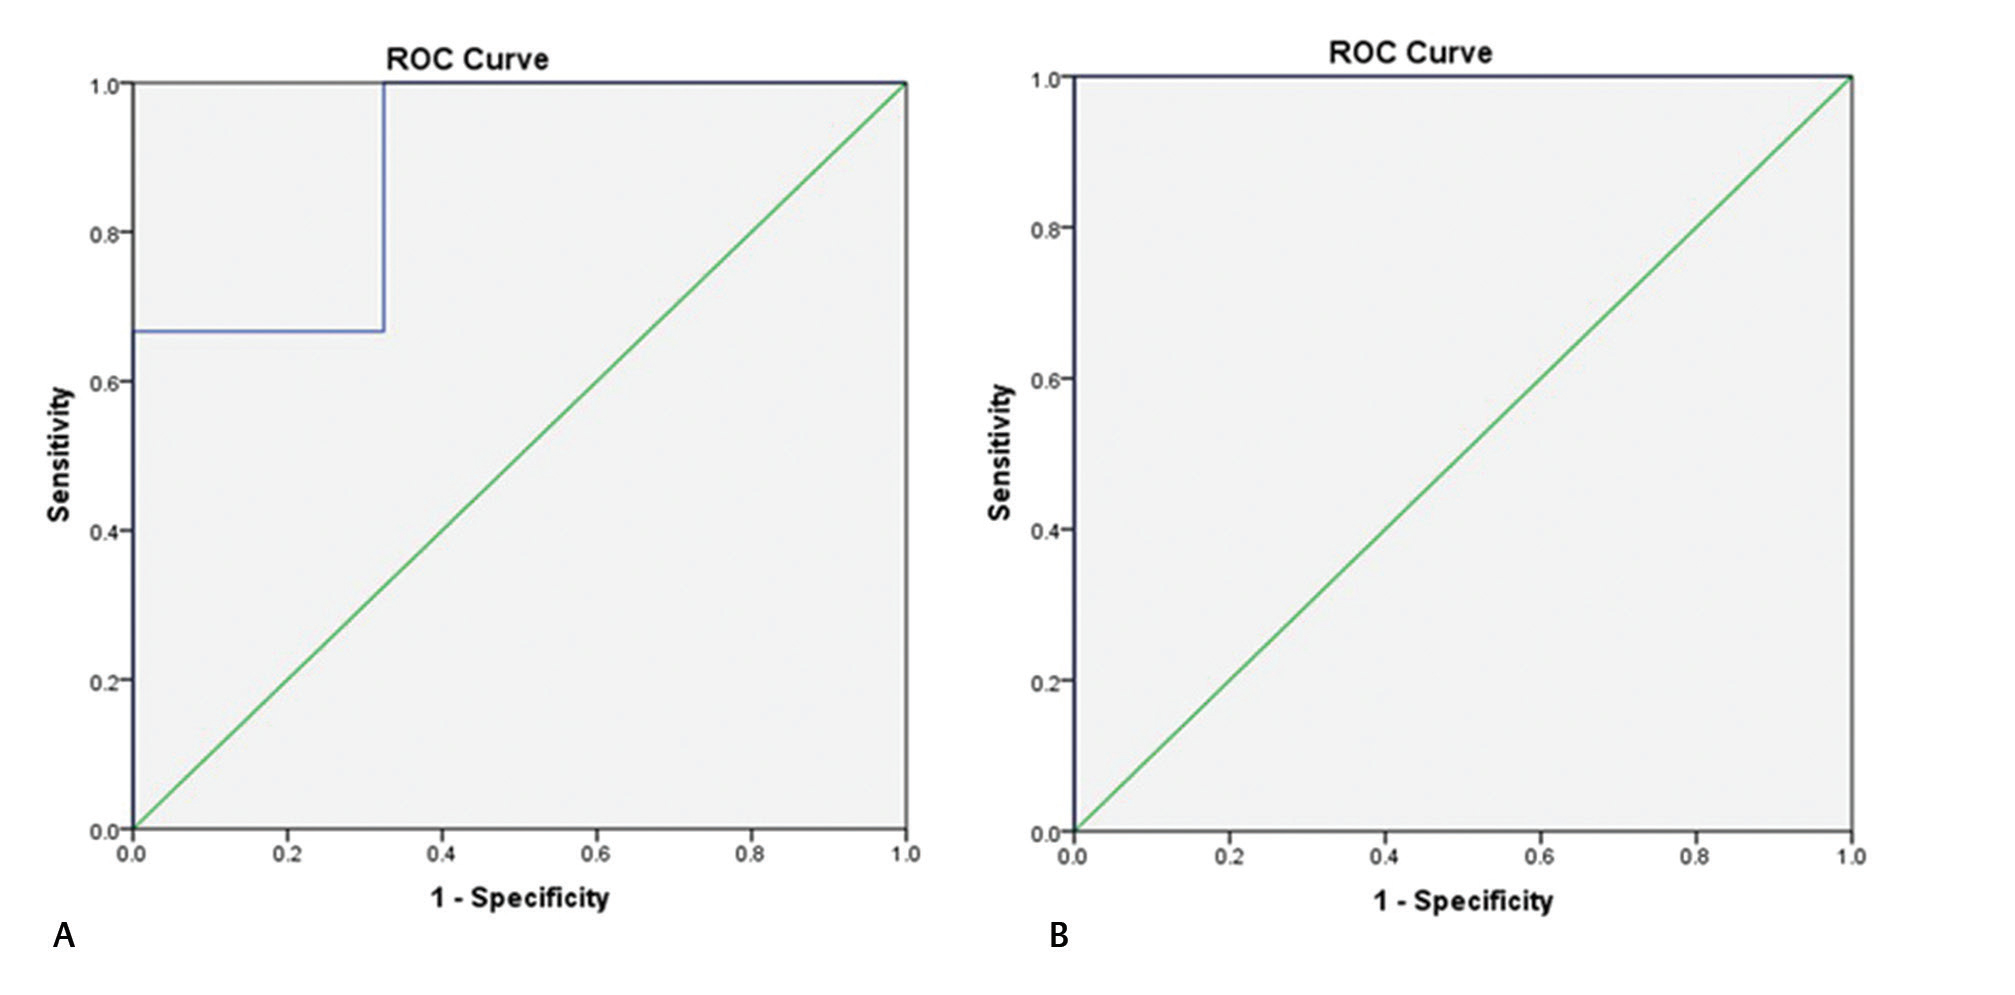
The mean opening intraventricular ICP was 21.81 ± 8.68 mm Hg with a range of 9 to 44 mm Hg and mean PI was 1.02 ± 0.41 with a range of 0.52 to 2.97. There was a significant positive linear correlation present between PI and ICP with correlation coefficient of 0.697 (p = 0.0001). The ROC curve was drawn at various values of ICP to find the optimum cutoff value of PI. There was a statistically significant association present between PI and ICP from 15 to 40 mm Hg with various sensitivity and specificity (Table 3 Figs. 1 2 3).
|
ICP (mm Hg) |
PI |
Area under ROC curve |
Sensitivity (%) |
Specificity (%) |
p-Value |
|---|---|---|---|---|---|
|
Abbreviations: ICP, intracranial pressure; PI, pulsatility index; ROC, receiver operative characteristic. The values are derived from the ROC curve between PI and ICP. a p-Value ≤0.05 is statistically significant. |
|||||
|
15 |
0.81 |
0.729 |
87.5 |
50.0 |
0.048a |
|
20 |
0.92 |
0.821 |
80 |
60 |
0.001a |
|
25 |
1.02 |
0.887 |
88.9 |
77.4 |
0.0001a |
|
30 |
1.18 |
0.896 |
75.0 |
86.1 |
0.01a |
|
35 |
1.28 |
0.892 |
66.7 |
100 |
0.026a |
|
40 |
1.28 |
1.000 |
100 |
100 |
0.018a |

-
Fig. 1 Receiver operating characteristic (ROC) curve of intracranial pressure value 15 (A) and 20 mm Hg (B) with pulsatility index showing a statistically significant association among them.
Fig. 1 Receiver operating characteristic (ROC) curve of intracranial pressure value 15 (A) and 20 mm Hg (B) with pulsatility index showing a statistically significant association among them.

-
Fig. 2 Receiver operating characteristic (ROC) curve of intracranial pressure value 25 (A) and 30 mm Hg (B) with pulsatility index showing a statistically significant association among them.
Fig. 2 Receiver operating characteristic (ROC) curve of intracranial pressure value 25 (A) and 30 mm Hg (B) with pulsatility index showing a statistically significant association among them.
-
Fig. 3 Receiver operating characteristic (ROC) curve of intracranial pressure value 35 (A) and 40 mm Hg (B) with pulsatility index showing a statistically significant association among them.
Fig. 3 Receiver operating characteristic (ROC) curve of intracranial pressure value 35 (A) and 40 mm Hg (B) with pulsatility index showing a statistically significant association among them.
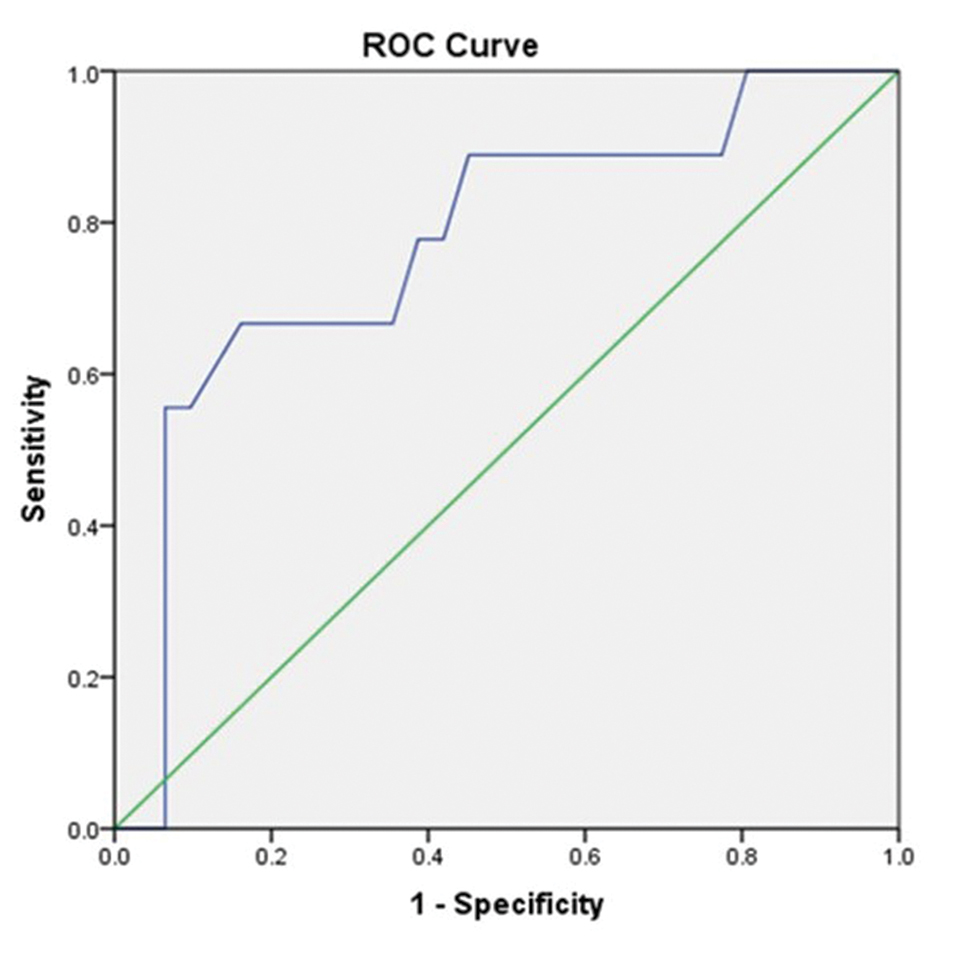
The mean RI was 0.59 ± 0.32 with a range of 0.3 to 0.8 with a statistically significant positive correlation with ICP, with correlation coefficient of 0.503 (p = 0.001). The ROC curve was also drawn between RI and ICP to find the association of RI at various cutoff values of ICP where RI was statistically significantly associated with ICP at 15 to 25 mm Hg with various sensitivity and specificity (Table 4 Figs. 4 5). However, the correlation between ICP and RI was not statistically significant at ICP value more than 25 mm Hg. The PI had a higher sensitivity (88.9%) and area under curve (AUC) in the ROC curve (0.887) than with RI (66.7%; AUC 0.772) at ICP of 25 mm Hg (Tables 3 4).
|
ICP (mm Hg) |
RI |
Area under ROC curve |
Sensitivity (%) |
Specificity (%) |
p-Value |
|---|---|---|---|---|---|
|
Abbreviations: ICP, intracranial pressure; RI, resistive index; ROC, receiver operative characteristic. The values are derived from the ROC curve between RI and ICP. a p-Value ≤0.05 is statistically significant. |
|||||
|
15 |
0.53 |
0.805 |
87.5 |
62.5 |
0.008a |
|
20 |
0.57 |
0.827 |
80 |
70 |
0.001a |
|
25 |
0.64 |
0.772 |
66.7 |
83.9 |
0.014a |

-
Fig. 4 Receiver operating characteristic (ROC) curve of intracranial pressure value 15 (A) and 20 mm Hg (B) with resistive index showing a statistically significant association among them.
Fig. 4 Receiver operating characteristic (ROC) curve of intracranial pressure value 15 (A) and 20 mm Hg (B) with resistive index showing a statistically significant association among them.
-
Fig. 5 Receiver operating characteristic (ROC) curve of intracranial pressure value 25 mm Hg with resistive index showing a statistically significant association among them.
Fig. 5 Receiver operating characteristic (ROC) curve of intracranial pressure value 25 mm Hg with resistive index showing a statistically significant association among them.
Discussion
In this study, we observed a statistically significant correlation of PI and RI with opening ICP. Homburg et al measured PI and ICP in 10 TBI patients. A total of 58 measurements of ICP and PI were recorded. Authors found statistically significant correlation between these two parameters with correlation coefficient of 0.82 (p = 0.001).15 Gura et al compared PI and ICP in 52 TBI patients with GCS < 9 in neuro intensive care unit. The ICP was measured either by parenchymal catheter or intraventricular catheter. They also found a statistically significant correlation (p < 0.001) of PI with ICP at day 1, 3, and 5 with correlation coefficients of 0.567, 0.529, and 0.779, respectively.16
Voulgaris et al also investigated 37 patients with severe TBI (GCS < 8) to find correlation between ICP and PI. The ICP was monitored with a fiberoptic device (Camino) at bedside and PI was measured with standard 2 MHz probe. They noted a statistically significant correlation between ICP and PI, with r = 0.64 and p < 0.001.17 Bellner et al assessed 658 TCD and ICP measurements with intraventricular catheter in situ in 81 patients with various intracranial pathologies. Authors found that their ICP values varied from 5 to 40 mm Hg and the correlation between PI and ICP was statistically significant (r = 0.938; p < 0.001).18 The results of these studies were consistent with our study that further validate our finding of correlation between PI and ICP. Although the ICP measurement techniques were different in these studies, we measured opening intraventricular ICP without loss of CSF that reflects the intracranial condition more accurately.
There are only few studies that correlated RI with ICP. Klingelhöfer et al measured RI and simultaneously mean ICP through epidural device in 26 patients with severe cerebral pathology. The author observed that the RI was also increased with the rise in ICP. They also observed a statistically significant correlation between ICP and the flow parameter in selected 13 patients with a correlation coefficient of 0.873, p < 0.001.19 Similarly, Goraj et al found a statistical significant correlation between RI and intraparenchymal ICP with a correlation coefficient of 0.614, p < 0.001 in 12 head injury patients.20 The results of these studies were also similar to our study.
All the above-mentioned studies found a good correlation of ICP with PI than with RI.15 16 17 18 19 20 Although both the indices are derived from TCD, PI is more commonly studied for its correlation with ICP than RI. The PI primarily depends on mean velocity, whereas the RI is mainly affected by systolic velocity. The cause of this difference is not clear. It can be hypothesized that PI involves mean flow velocity that is average flow velocity of a cardiac cycle, while RI involves peak systolic flow velocity that does not include flow velocity during diastolic phase of cardiac cycle, which is almost twice as long as systolic phase of cardiac cycle. Hence, mean flow velocity represents the flow velocity of the entire cardiac cycle better than systolic velocity. It may be similar to the fact that mean blood pressure is a better indicator of perfusion of vital organs compared with systolic blood pressure.21 Therefore, the PI has a better representation of ICP compared with RI.
In our study, we assessed opening ICP through intraventricular catheter that is the gold standard of ICP measurement and the correlation of ICP was found better with PI than RI in patients with features of raised ICP. The ROC curve had shown that the range for statistically significant association between PI and ICP was more (15–40 mm Hg) in comparison to RI and ICP (15–25 mm Hg). We also found a higher sensitivity with PI (88.9%) in comparison to RI (66.7%) to detect intracranial hypertension at ICP 25 mm Hg. Thus, the diagnosis of intracranial hypertension is better with PI than RI. This was further validated with increased AUC of the ROC at ICP 25 mm Hg with PI (0.807) than RI (0.772).
The TCD measurements are commonly associated with intra- and interobserver variations but in our study, all TCD measurements were performed by single investigator to eliminate the possibility of interobserver variations. To eliminate intraobserver variations, the investigator had a sufficient experience, by performing > 50 measurements before participating in the study.
This study highlighted the use of TCD as noninvasive ICP measurement modality. The centers where invasive ICP monitoring is not available TCD can be useful for the detection of intracranial hypertension, which can help them in the management and prognostication of the patients. Although both PI and RI were correlated with ICP in our study, correlation ICP with PI was better than that with RI. Hence, PI can be used for ICP assessment in limited resource health sectors.
There were a few limitations of the study. The first one was small sample size of the study; second, we wanted to check opening intraventricular pressure (without loss of CSF), which was technically difficult to measure. Hence, we had excluded patients with CSF leak while checking ICP.
Hence, this prospective, observational study concluded that both PI and RI measured by TCD noninvasively correlated well with opening intraventricular ICP in patients with intracranial hypertension. However, the PI correlated better than RI.
Acknowledgments
The authors would like to thank the patients who participated in the study.
Note
Oral paper presentation at 17th Annual conference of Indian Society of Neuroanaesthesiology and Critical Care from 05 to 07 February, 2016 at National Institute of Mental Health and Neurosciences (NIMHANS) convention center, Bengaluru, India. N. K. was awarded the 2nd best paper presentation for the same.
Authors’ Contributions
Dr. Narender Kaloria helped in writing, draft, data acquisition, and data analysis. Dr. Nidhi Bidyut Panda helped in concept and design of the manuscript, and drafting and editing the manuscript. Dr. Hemant Bhagat helped in the definition of intellectual content and review of the manuscript. Dr. Neha helped in draft, data analysis, and statistical analysis. Dr. Shiv Lal Soni helped in critical revision of the manuscript. Dr. Rajeev Chauhan helped data acquisition. Dr. Rajesh Chhabra helped in literature search and conduct of the study. Dr. Kiran Jangra helped in literature search and critical revision. The article has been read and approved by all the authors, that the requirements for authorship as stated earlier in this document have been met, and that each author believes that the manuscript represents honest work from inception to published article. The corresponding contributor is designated as “guarantor” for above research work authenticity.
Conflict of Interest
None declared.
Funding None.
References
- Hyperosmolar therapy for raised intracranial pressure. N Engl J Med. 2012;367(8):746-752.
- [Google Scholar]
- Effects of intracranial pressure monitoring on outcome of patients with severe traumatic brain injury; results of a historical cohort study. Bull Emerg Trauma. 2014;2(4):151-155.
- [Google Scholar]
- Guidelines for the management of severe traumatic brain injury, fourth edition. Neurosurgery. 2017;80:6-15.
- [Google Scholar]
- Intracranial hypertension: monitoring and nursing assessment. Crit Care Nurse. 2004;24(5):19-20, 22–26, 28–32, quiz 33–34.
- [Google Scholar]
- Connolly ES Jr. Ventriculostomy-related infections: a critical review of the literature. Neurosurgery. 2002;51(1):170-181.
- [Google Scholar]
- Malplacement of ventricular catheters by neurosurgeons: a single institution experience. Neurocrit Care. 2009;10(2):248-252.
- [Google Scholar]
- Long subcutaneous tunnelling reduces infection rates in paediatric external ventricular drains. Childs Nerv Syst. 2014;30(10):1671-1678.
- [Google Scholar]
- In vivo accuracy of two intraparenchymal intracranial pressure monitors. Intensive Care Med. 2011;37(5):875-879.
- [Google Scholar]
- Results and complications of intracranial pressure monitoring in 303 children. Pediatr Neurosurg. 1995;23(2):64-67.
- [Google Scholar]
- Intracranial pressure monitoring: invasive versus non-invasive methods—a review. Crit Care Res Pract. 2012;2012:950393.
- [Google Scholar]
- Non-invasive methods of estimating intracranial pressure. Neurocrit Care. 2011;15(3):599-608.
- [Google Scholar]
- Clinical review of noninvasive intracranial pressure measurement in medical cases. J Neuroanaesth Crit Care. 2016;3:9-14.
- [Google Scholar]
- Applications of transcranial Doppler in the ICU: a review. Intensive Care Med. 2006;32(7):981-994.
- [Google Scholar]
- 2006. p. :306-310. Transcranial Doppler examinations. In: Goldberg BB, McGahan JP, eds. Atlas of Ultrasound Measurements. 2nd ed. Philadelphia: Elsevier Health Sciences
- Transcranial Doppler recordings in raised intracranial pressure. Acta Neurol Scand. 1993;87(6):488-493.
- [Google Scholar]
- Correlation of pulsatility index with intracranial pressure in traumatic brain injury. Turk Neurosurg. 2011;21(2):210-215.
- [Google Scholar]
- Early cerebral monitoring using the transcranial Doppler pulsatility index in patients with severe brain trauma. Med Sci Monit. 2005;11(2):CR49-CR52.
- [Google Scholar]
- Transcranial Doppler sonography pulsatility index (PI) reflects intracranial pressure (ICP) Surg Neurol. 2004;62(1):45-51. discussion 51
- [Google Scholar]
- Evaluation of intracranial pressure from transcranial Doppler studies in cerebral disease. J Neurol. 1988;235(3):159-162.
- [Google Scholar]
- Lansen TA, Kasoff SS, Tenner MS. Correlation of intracranial pressure and transcranial Doppler resistive index after head trauma. AJNR Am J Neuroradiol. 1994;15(7):1333-1339.
- [Google Scholar]
- 2010. Surviving sepsis campaign. In: Brunner & Suddarth's Textbook of Medical-Surgical Nursing. 12th edition. Philadelphia: Wolters Kluwer Health/ Lippincott Williams & Wilkins


