
Translate this page into:
Prognostic Factors and Nomogram Predicting Survival in Diffuse Astrocytoma
This article was originally published by Thieme Medical and Scientific Publishers Private Ltd. and was migrated to Scientific Scholar after the change of Publisher.
Abstract
Abstract
Background Prognosis of low-grade glioma are currently determined by genetic markers that are limited in some countries. This study aimed to use clinical parameters to develop a nomogram to predict survival of patients with diffuse astrocytoma (DA) which is the most common type of low-grade glioma.
Materials and Methods Retrospective data of adult patients with DA from three university hospitals in Thailand were analyzed. Collected data included clinical characteristics, neuroimaging findings, treatment, and outcomes. Cox’s regression analyses were performed to determine associated factors. Significant associated factors from the Cox regression model were subsequently used to develop a nomogram for survival prediction. Performance of the nomogram was then tested for its accuracy.
Results There were 64 patients with DA with a median age of 39.5 (interquartile range [IQR] = 20.2) years. Mean follow-up time of patients was 42 months (standard deviation [SD] = 34.3). After adjusted for three significant factors associated with survival were age ≥60 years (hazard ratio [HR] = 5.8; 95% confidence interval [CI]: 2.09–15.91), motor response score of Glasgow coma scale < 6 (HR = 75.5; 95% CI: 4.15–1,369.4), and biopsy (HR = 0.45; 95% CI: 0.21–0.92). To predict 1-year mortality, sensitivity, specificity, positive predictive value, negative predictive value, accuracy, and area under the curve our nomogram was 1.0, 0.50, 0.45, 1.0, 0.64, and 0.75, respectively.
Conclusions This study provided a nomogram predicting prognosis of DA. The nomogram showed an acceptable performance for predicting 1-year mortality.
Keywords
diffuse astrocytoma
nomogram
survival analysis

Introduction
Diffuse astrocytoma (DA) is one type of low-grade glioma (LGG) and classified as WHO (World Health Organization) grade II. DA is a relatively slow-growing brain tumor with a median survival time of 3.9 to 10.8 years.1 2 3 4 5 6 However, DA infiltrates brain parenchyma, making it hard for total resection. The rate of gross-total resection is only 14 to 17%.2 3 Therefore, residual tumors become the burden of patients with DA in the long-term follow-up.
Low-grade glioma (LGG) comprised of several types of tumor, that is, astrocytoma, oligodendroglioma, and mixed oligoastrocytoma. Associated factors for poor outcomes in patients with LGG are older age, Karnofsky’s performance status (KPS) < 70, prior neurological deficits, tumor size >6 cm, tumor crossing midline, and nonhemispheric/noncerebellar tumor.6 7 8 Postoperative radiotherapy (RT) is yet a debatable predicting factor for prognosis of LGG. In a study, postoperative conventional RT tends to shorten time to progression and prolonged progression-free survival but not the overall survival.9 Another study shows no significant difference in survival between pediatric patients with LGG who received postoperative RT and those who did not.8 Nonetheless, there has been limited data about prognosis among subpopulation of patients with LGG including patients with DA.
Nomogram has been used to predict clinical outcome in various groups of diseases, such as malignancies,10 11 degenerative diseases,12 and metabolic diseases.13 From the literature review, there is the heterogeneity of histology in the group of LGG and lack of evidence of the prognostic factors that focuses on diffuse astrocytoma. We aimed to identify prognostic factors associated with survival of patients with diffuse astrocytoma. This study developed the nomogram to predict survival of DA hoping to use in the clinical practice.
Subjects and Methods
Study Designs and Population
We reviewed data from three university hospitals in Thailand (Central Nervous System Tumor Registry). Patients who were newly diagnosed with DA within the study period (January 2009 and December 2017) were included. DA was histologically-confirmed by certified pathologists using World Health Organization Classification.14 Data collected included demographics, neuroimaging, treatment, and outcome.
The Karnofsky performance status (KPS) score is an assessment tool for functional impairment. Scores run from 100 to 0 (the lowest KPS score has the worst survival probability). KPS scores were also dichotomized into two groups, according to the ability to carry on normal activities (KPS ≥80).15
Magnetic resonance images (MRI) of the brain were reviewed prospectively by trained neurosurgeons to demonstrate tumor location, tumor size, and other characteristics of the tumor. The postoperative residual tumor was quantified from postoperative MRI or contrast-enhanced computerized tomography (CT) of the brain. The hypervascularization of the tumor defined as the visualizing vascular structures inside a tumor (flow void sign) was reviewed.16
The extent of resection was defined using the same definition by Vecht et al.17 Gross-total resection was defined as residual tumor seen in postoperative neuroimaging less than 5%. Subtotal resection was defined as residual tumor 5 to 25% seen in postoperative neuroimaging. Partial resection was defined as visible residual tumor more than 25%. Biopsy was defined as an operation for tissue diagnosis only, and no attempt was made to remove the tumor.
The follow-up data were collected until December 2018. Survival duration was duration from the time of surgery to death or censor (still survived) in December 2018. Follow-up data were collected mainly when patients visited outpatient clinics. Patients (or caregivers) who did not come to the hospital were interviewed by phone. We also checked death records from the local municipality. The study got clearance from the institutional review board of each collaborator (REC number 61–203–10–1).
Nomogram Development and Performance Test
From the multivariable analysis, the prediction model was constructed from the significant parameters that affect the mortality. A nomogram was developed using the significant parameters (p < 0.05) of the method by Zhang et al.18 The bootstrap method with 1,000 replicates was used for the internal validity of the model. The validated function in the “ rms“ package was used to analyze the bias-corrected c-index that evaluated the predictive discrimination of the model.19 The concordance index is the probability of concordance between predicted probability and response.
For the individual prediction, the performances of nomogram were evaluated as the binary classifiers (death or living) instead of the death-probability prediction by the self-consistency validation.20 The nomogram’s sensitivity, specificity, positive predictive value (PPV), negative predictive value (NPV), and accuracy were determined for death in various cut-off point of the total scores. Therefore, the highest performance nomogram with optimal cut-off points was chosen by the receiver operating characteristic (ROC) curve and the area under the receiver operating characteristic (AUC) were plotted. Additionally, AUCs were determined that values ≥0.9 are “excellent,” ≥0.80 “good,” ≥0.70 “fair,” and <0.70 “poor.”21
Statistical Analysis
Clinical characteristics and therapeutic factors were first described using descriptive statistics. Survival curve was constructed using the Kaplan–Meier method. The Cox proportional hazard regression model was used to identify the univariate and multivariate predictors of survival. A p-value less than 0.05 was considered statistically significant. The statistical analysis was performed using the R version 3.4.0 software (R Foundation, Vienna, Austria). In details, the “rms” package was used for establishing nomogram.19 Moreover, ROC and AUC were created by “PlotROC” package.22
Results
The clinical manifestations of the 64 patients with DA are shown in Table 1. More than half of the DA was slightly dominant in males. The mean age was 39.4 years (SD = 17.3). The patients usually presented with a seizure and a progressive headache. Additionally, 96.9% of patients had the Glasgow coma scale (GCS) score 15, while 3.1% had a GCS score of less than 15. The common tumor location involved the frontal and temporal lobe in 37.5 and 23.4%, respectively. The thalamic tumor was found in 1.6% of cases. Moreover, the mean tumor volume was 5.6 (+SD = 1.8) and 92.2% of the DA was solitary tumors while 7.8% was multiple tumors.
|
Factor |
n(%) |
|---|---|
|
Abbreviations: IQR, interquartile range; SD, standard deviation. |
|
|
Age (y) |
|
|
< 60 |
55 (85.9) |
|
≥ 60 |
9 (14.1) |
|
Median of age (y)(IQR) |
39.5 (20.2) |
|
Gender |
|
|
Male |
34 (53.1) |
|
Female |
30 (46.9) |
|
Seizure |
34 (53.1) |
|
Progressive headache |
21 (32.8) |
|
Weakness |
16 (25.0) |
|
Visual disturbance |
3 (4.7) |
|
Alteration of consciousness |
2 (3.1) |
|
Ataxic gait |
2 (3.1) |
|
Preoperative Karnofsky’s performance status |
|
|
< 80 |
22 (34.4) |
|
≥ 80 |
42 (65.6) |
|
Major location of the tumor |
|
|
Frontal |
24 (37.5) |
|
Temporal |
15 (23.4) |
|
Corpus callosum |
7 (10.9) |
|
Parietal |
5 (7.8) |
|
Brainstem |
3 (4.7) |
|
Pineal |
2 (3.1) |
|
Spinal cord |
2 (3.1) |
|
Occipital |
1 (1.6) |
|
Periventricular |
1 (1.6) |
|
Basal ganglion |
1 (1.6) |
|
Thalamus |
1 (1.6) |
|
Sellar/suprasellar |
1 (1.6) |
|
Cerebellum |
1 (1.6) |
|
Lateralization of tumor |
|
|
Left |
24 (37.5) |
|
Right |
27 (42.2) |
|
Bilateral |
1 (1.6) |
|
Midline |
12 (18.8) |
|
Number of tumors |
|
|
Single |
59 (92.2) |
|
Multiple |
5 (7.8) |
|
Preoperative hydrocephalus |
15 (23.4) |
|
Positive hypervascular signs |
20 (31.3) |
|
Initial leptomeningeal dissemination |
3 (4.7) |
|
Eloquent area |
26 (40.6) |
|
Mean of diameter (cm) (SD) |
5.6 (1.8) |
|
Mean of midline shift (mm) (SD) |
3.3 (3.7) |
|
Type of operation |
|
|
Total resection |
8 (12.5) |
|
Subtotal resection |
7 (10.9) |
|
Partial resection |
27 (42.2) |
|
Biopsy |
22 (34.4) |
|
Radiotherapy |
53 (82.8) |
|
Postoperative Karnofsky’s performance status |
|
|
< 80 |
29 (45.3) |
|
≥ 80 |
35 (54.7) |
In this study, the total resection rate was 12.5%, while the rates of subtotal, partial resection, and biopsy were 10.9, 42.2, and 34.4%, respectively. Most of the patients (82.8%) underwent radiotherapy after resection.
Survival Analysis
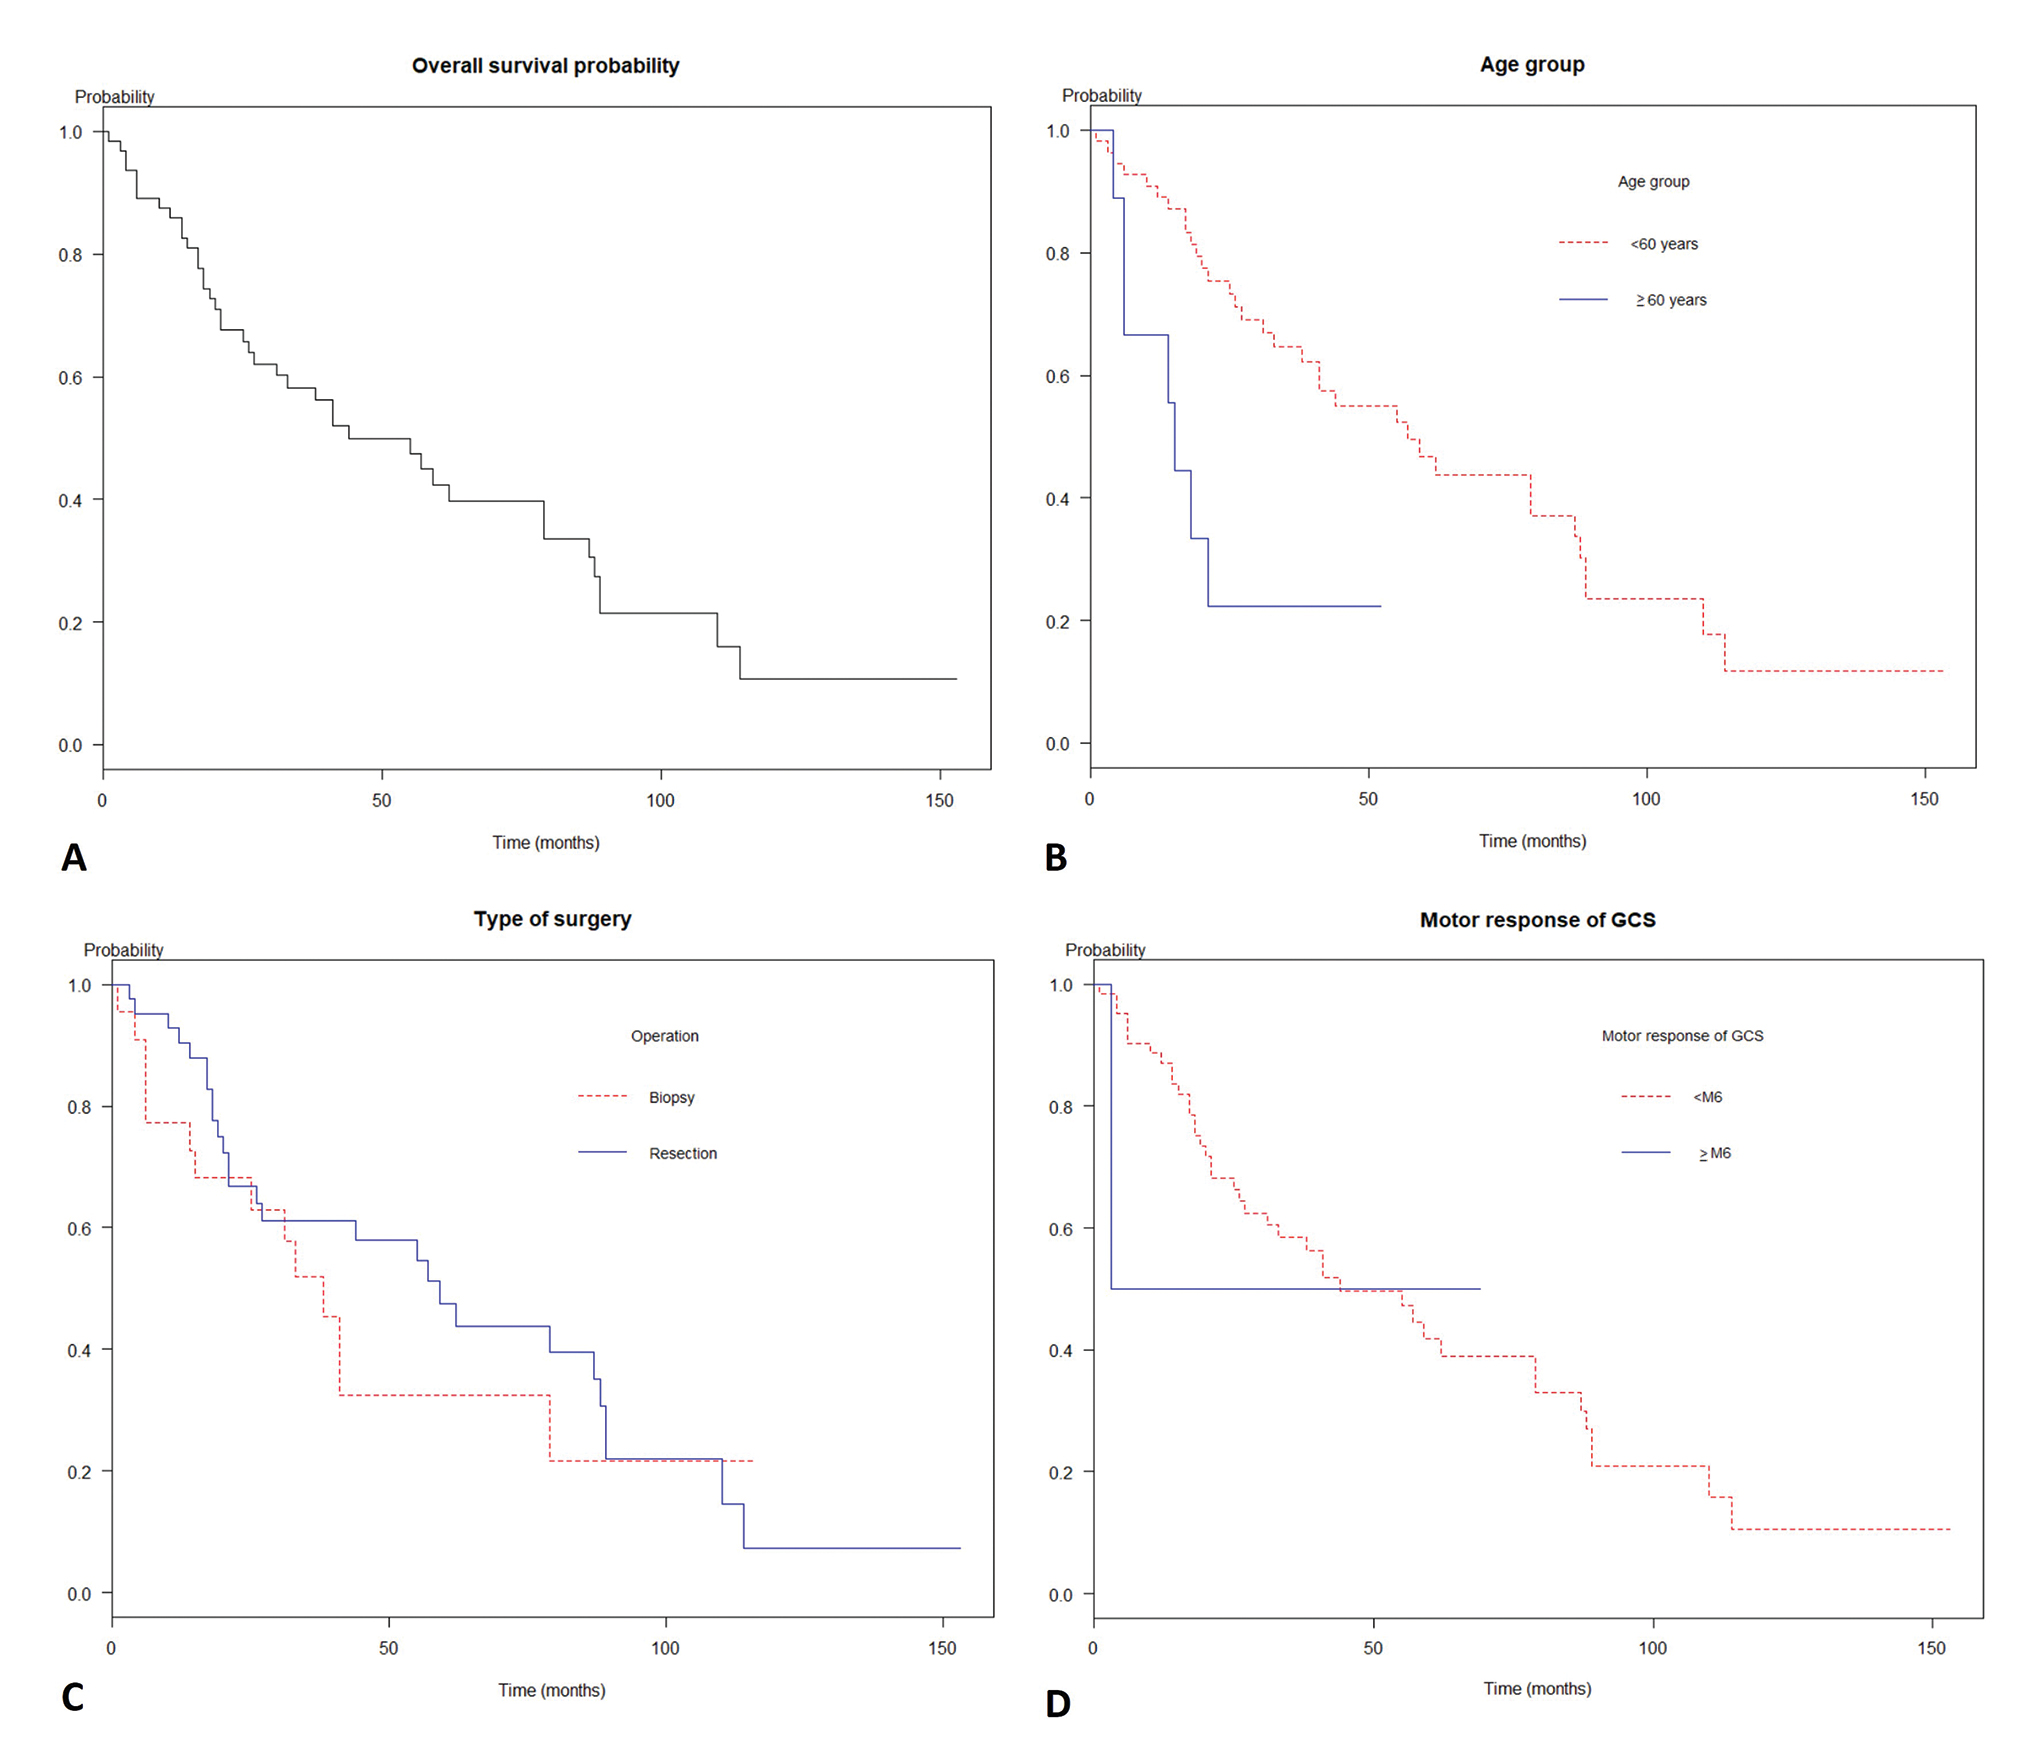
The prognosis of the diffuse astrocytoma was pitiable as the Kaplan–Meier curve in Fig. 1A Mean follow-up time was 42 months (SD = 34.3). Also, the overall median survival time was 44 months (95% confidence interval [CI]: 31.0–87.0), while the 1-, 2-, and 5-year survival probability were 85.9, 67.6, and 42.3%, respectively. Moreover, the malignant transformation was observed in 17.2% of cases.
-
Fig. 1 Survivals of patients with diffuse astrocytoma glioma by predictors. (A) The overall median survival time was 26 months (95% confidence interval [CI]: 19.0–41.0). (B) A comparison of survival times among age groups (log-rank test, p = 0.004). (C) A comparison of survival times among patients according to motor response groups (log-rank test, p < 0.001). (D) A comparison of survival times among biopsy and resection operations (log-rank test, p = 0.04).
Fig. 1 Survivals of patients with diffuse astrocytoma glioma by predictors. (A) The overall median survival time was 26 months (95% confidence interval [CI]: 19.0–41.0). (B) A comparison of survival times among age groups (log-rank test, p = 0.004). (C) A comparison of survival times among patients according to motor response groups (log-rank test, p < 0.001). (D) A comparison of survival times among biopsy and resection operations (log-rank test, p = 0.04).
According to Cox’s proportional hazard regression analysis as shown in Table 2, the significant parameters for increased death were age 60 years or more group (hazard ratio [HR] = 4.83, p = 0.001), motor response of GCS score less than 6 in groups (HR 39.49, p = 0.009), positive hypervascular sign (HR = 2.05, p = 0.03), biopsy (HR = 0.47, p = 0.03) in univariate analysis. By multivariable analysis, the significant model consisted of age 60 years or more (HR = 5.76, p < 0.001), the motor response score of GCS less than 6 (HR = 75.47, p = 0.003), and biopsy (HR = 0.45, p = 0.02).
|
Univariate analysis |
Multivariable analysis |
|||
|---|---|---|---|---|
|
Factor |
Odds ratio (95%CI) |
p-Value |
Odds ratio (95%CI) |
p-Value |
|
Abbreviations: CI, confidence interval; Ref., reference. aData show only “yes group” while reference groups (no group) are hidden. bEloquent area defined tumor involved motor cortex, sensory cortex, visual center, speech center, basal ganglion, hypothalamus, thalamus, brainstem, dentate nucleus. |
||||
|
Gender |
||||
|
Male |
Ref. |
|||
|
Female |
1.16 (0.61–2.20) |
0.63 |
||
|
Age (y) |
||||
|
< 60 |
Ref. |
|||
|
≥ 60 |
4.83 (1.86–12.55) |
0.001 |
5.76 (2.09–15.91) |
< 0.001 |
|
Aphasiaa |
4.50 (0.56–36.0) |
0.15 |
||
|
Seizurea |
1.08 (0.56–2.08) |
0.80 |
||
|
Motor response of GCS |
||||
|
Equal 6 |
Ref. |
Ref. |
||
|
Less than 6 |
39.49 (2.47–631.49) |
0.009 |
75.47 (4.15–1369.4) |
0.003 |
|
Preoperative Karnofsky performance status |
||||
|
< 80 |
Ref. |
|||
|
≥ 80 |
1.29 (0.67–2.51) |
0.43 |
||
|
Location |
||||
|
Frontal lobea |
1.06 (0.55–2.05) |
0.84 |
||
|
Temporal lobea |
0.83 (0.49–1.68) |
0.69 |
||
|
Parietal lobea |
0.67 (0.20–2.28) |
0.52 |
||
|
Brainstema |
1.17(0.15–8.71) |
0.87 |
||
|
Thalamus/basal gangliona |
2.85 (0.65–12.32) |
0.16 |
||
|
Corpus callosuma |
2.20 (0.63–7.71) |
0.21 |
||
|
Sellar/suprasellar regiona |
0.20 (0.02–1.75) |
0.14 |
||
|
Spinal corda |
2.59 (0.32–20.52) |
0.36 |
||
|
Lateralization of tumor |
||||
|
Left |
Ref. |
|||
|
Right |
1.45 (0.73–2.88) |
0.28 |
||
|
Midline |
1.36 (0.53–3.48) |
0.51 |
||
|
Eloquent area a,b |
0.87 (0.46–1.65) |
0.68 |
||
|
Number of tumors |
||||
|
Single |
Ref. |
|||
|
Multiple |
2.18 (0.75–6.28) |
0.14 |
||
|
Positive hypervascular signa |
2.08 (1.04–4.12) |
0.03 |
1.81 (0.88–3.75) |
0.10 |
|
Leptomeningeal disseminationa |
1.59 (0.37–6.73) |
0.52 |
||
|
Preoperative hydrocephalusa |
1.09 (0.51–2.30) |
0.81 |
||
|
Midline shift |
||||
|
< 0.5 |
Ref. |
|||
|
≥ 0.5 |
1.20 (0.59–2.45) |
0.59 |
||
|
Maximum diameter (cm) |
||||
|
< 3 |
Ref. |
|||
|
≥ 3 |
0.73 (0.30–1.78) |
0.49 |
||
|
Type of operation |
||||
|
Biopsy |
Ref. |
Ref. |
||
|
Resection |
0.47 (0.23–0.95) |
0.03 |
0.45 (0.21–0.92) |
0.02 |
|
Postoperative Karnofsky’s performance status |
||||
|
< 80 |
Ref. |
|||
|
≥ 80 |
0.98 (0.52–1.85) |
0.95 |
||
|
Radiotherapy |
||||
|
No |
Ref. |
|||
|
Yes |
0.86 (0.35–2.06) |
0.73 |
||
As the Kaplan–Meier curve in Fig. 1B D, the median survival time of age less than the 60-year group was 34 months, whereas age 60 or above group was 7 months (log rank test, p < 0.01). The patients with motor response score of GCS less than 6 had median survival time at 40 months while motor response score of GCS equal to 6 had median survival time at a month (log-rank test, p = 0.005). Additionally, the median survival time of biopsy and tumor resection was 22 months and 27 months, respectively (log rank test, p = 0.04).
Nomogram Development and Performance Test
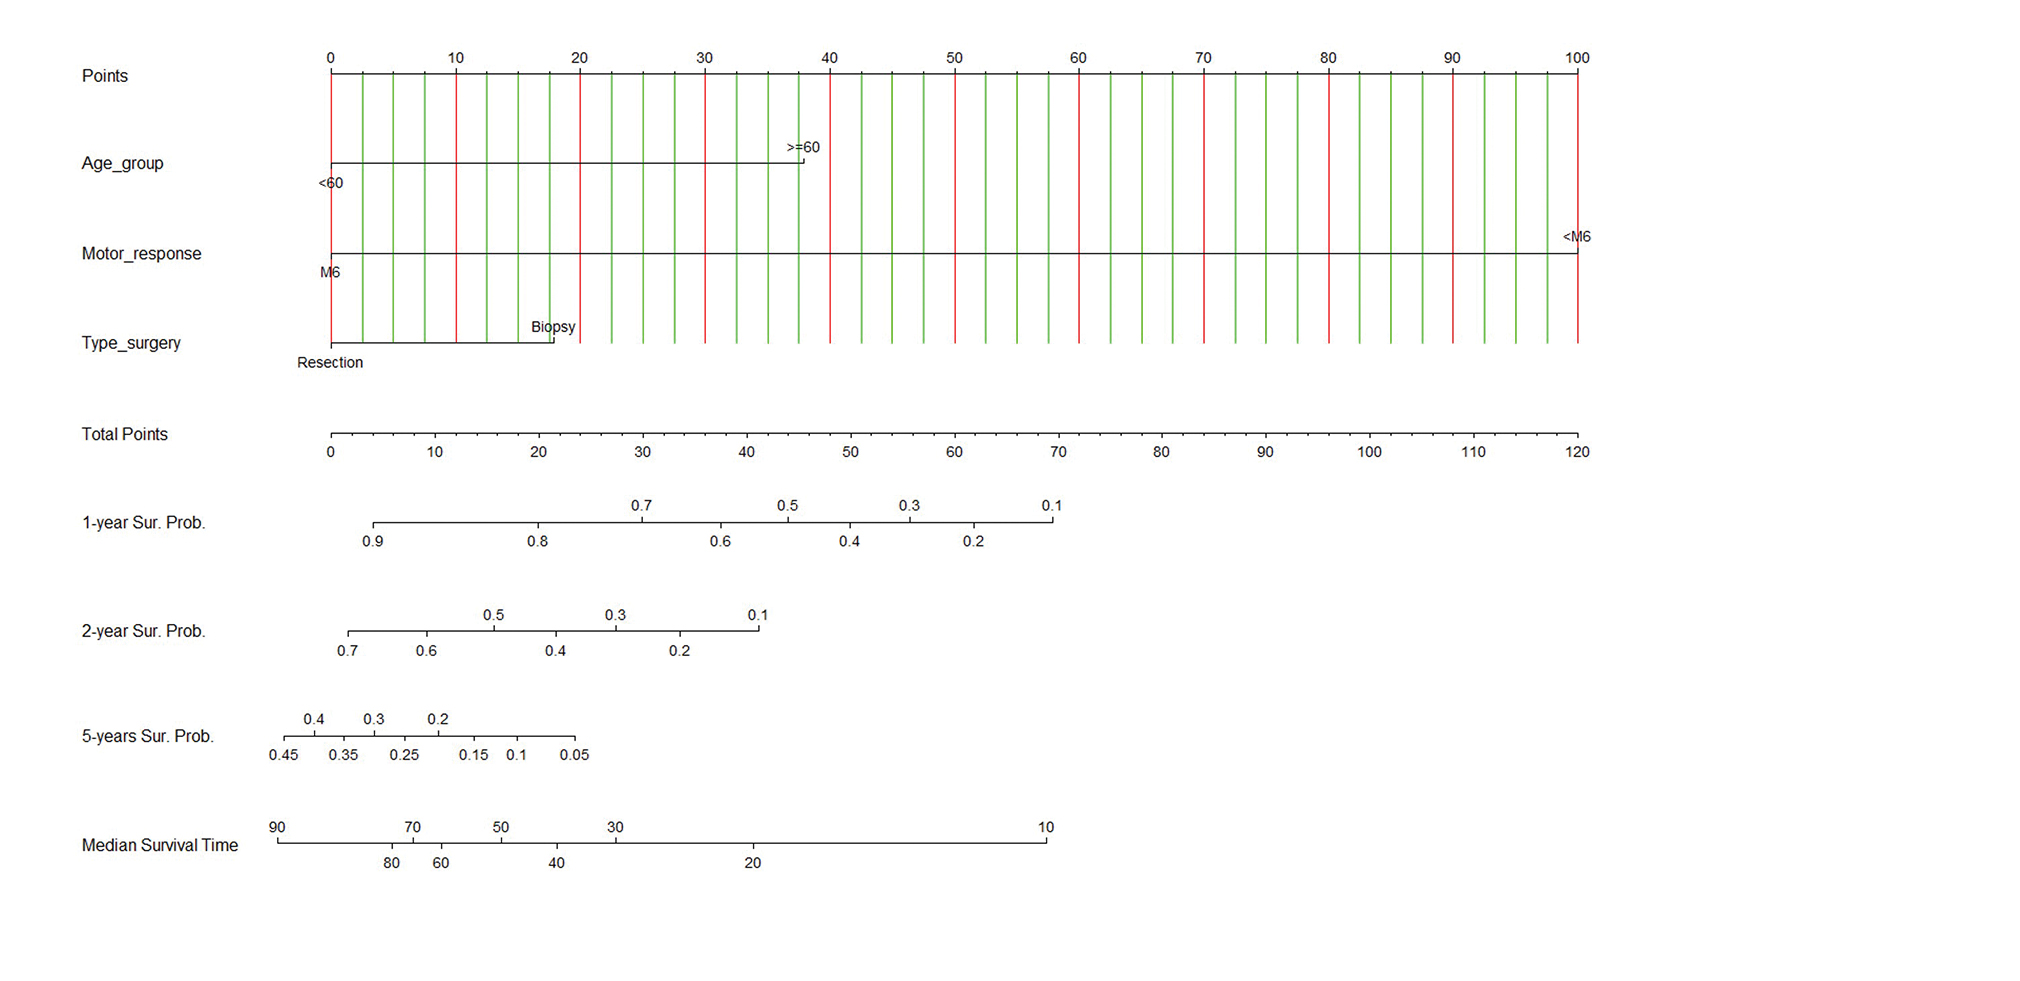
The nomogram was developed using the significant parameters in the multivariable analysis as shown in Fig. 2. Additionally, the calibrate plot revealed that the model was nearby the ideal and had a bias-corrected concordance-index value of 0.933. The nomogram is simple in general practice. For example, a 58-year-old patient (no point) had six scores in the motor response of GCS (no point), and the MRI of the brain showed a left frontal diffuse astrocytoma with positive of the hypervascular sign, and he underwent to total tumor resection (no point) as Fig. 3. Therefore, total points equal to 0 points which approximately corresponds to more than 90% of 1-year survival probability, more than 70% of 2-year survival probability, 35 to 40% of 5-year survival probability, and 80 to 90 months of predicted-survival time.
-
Fig. 2 Nomogram predicting 1-year, 2-year, 5-year survival probabilities (Sur. Probs.) and median survival time (months). To use the nomogram, draw a straight line upward from the patient's characteristics of age group, motor response, type of surgery to the upper points scale, the sums of the scores of all variables. Then, draw another straight line down from the scale of the total points through the 1-year, 2-year, 5-year, and median survival times. This is the probability of the presence of prognosis in an individual.
Fig. 2 Nomogram predicting 1-year, 2-year, 5-year survival probabilities (Sur. Probs.) and median survival time (months). To use the nomogram, draw a straight line upward from the patient's characteristics of age group, motor response, type of surgery to the upper points scale, the sums of the scores of all variables. Then, draw another straight line down from the scale of the total points through the 1-year, 2-year, 5-year, and median survival times. This is the probability of the presence of prognosis in an individual.
-
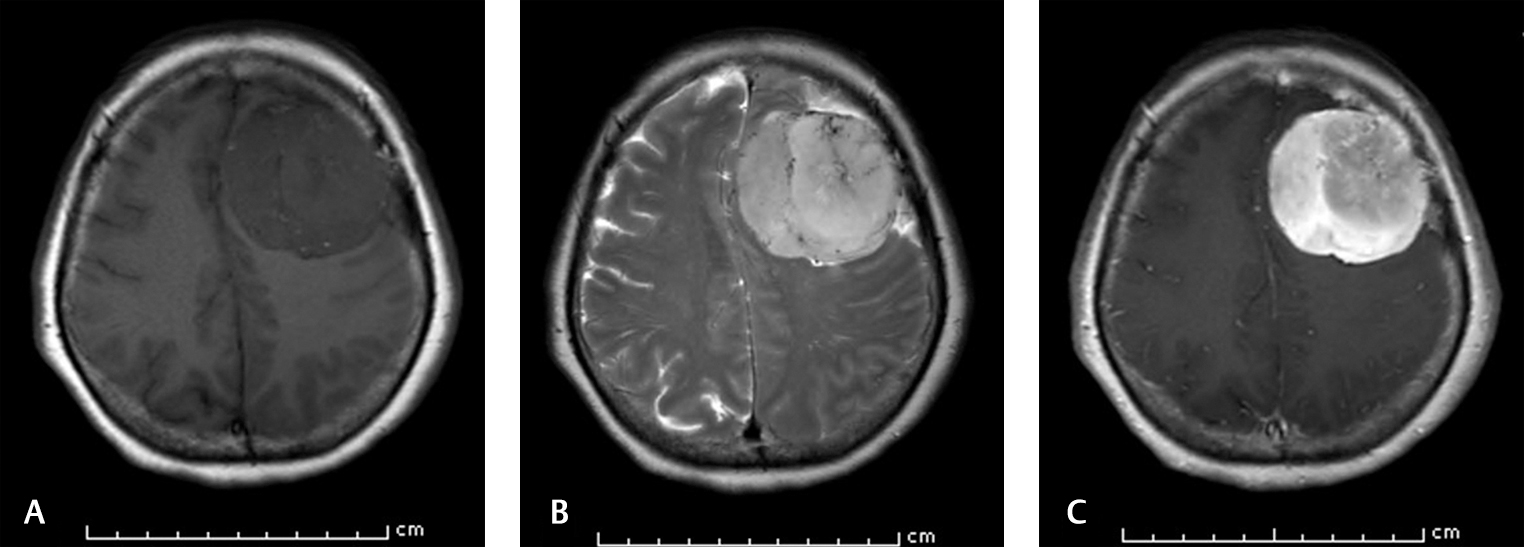
Fig. 3 Brain MRI of a 58-year-old patient who survived at 4-year-follow-up. (A) Axial T1-weighted image shows left hypointense frontal mass. (B). Axial T2-weighted image demonstrates the intratumoral flow void sign. (C). Axial T1-weighted image shows vivid enhancement after contrast injection. MRI, magnetic resonance imaging.
Fig. 3 Brain MRI of a 58-year-old patient who survived at 4-year-follow-up. (A) Axial T1-weighted image shows left hypointense frontal mass. (B). Axial T2-weighted image demonstrates the intratumoral flow void sign. (C). Axial T1-weighted image shows vivid enhancement after contrast injection. MRI, magnetic resonance imaging.
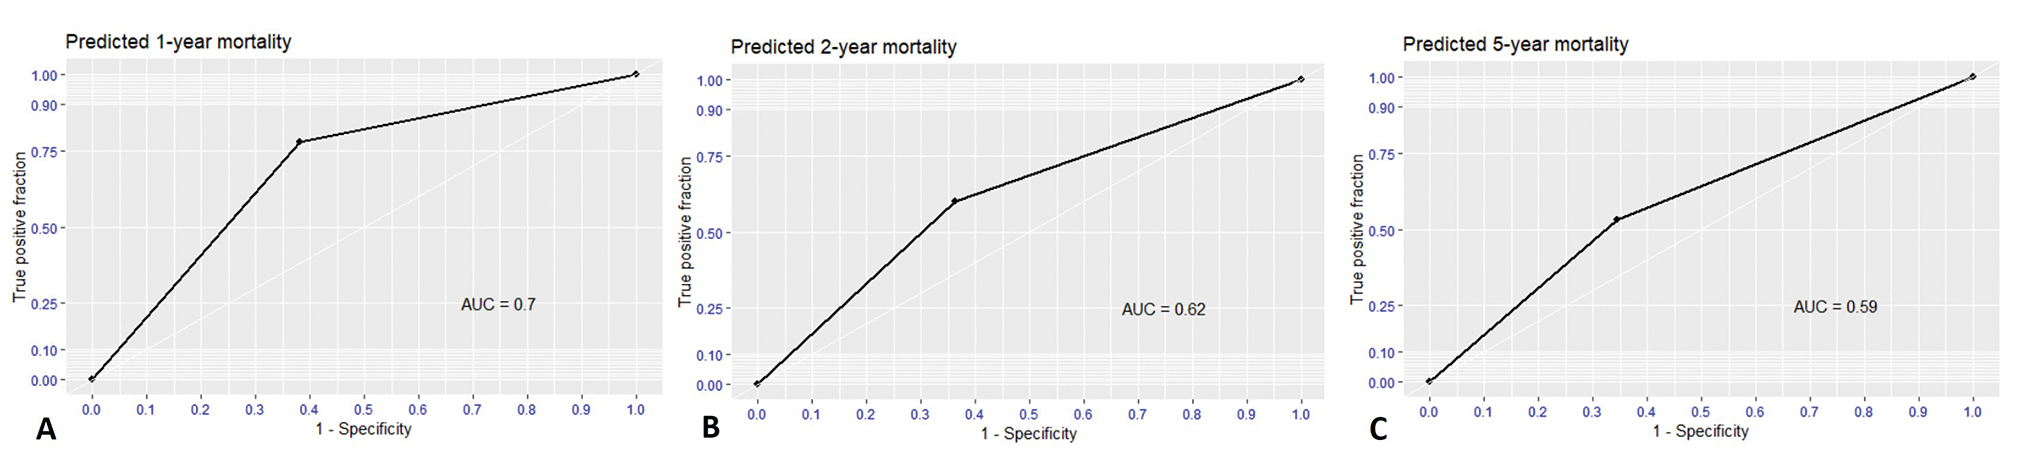
For validation, the performances of nomogram were evaluated as the binary classifiers instead of survival probability. Therefore, nomogram needed to find the optimal cut-off point for highest performance. At an optimal cut-off point of 18, the nomogram was validated by self-consistency test that sensitivity, specificity, PPV, NPV, accuracy, and AUC were 0.77, 0.61, 0.25, 0.94, 0.70, and 0.70, respectively for predicting 1-year mortality as Fig. 4. Nevertheless, nomogram performance gradually dropped in 2-year and 5-year prediction as Table 3.
-
Fig. 4 Receiver operating characteristic (ROC) curve and area under the curve (AUC) of predicted mortality as binary classifiers using cut-off-point of 18. (A) 1-year predicted mortality, (B) 2-year predicted mortality, and (C) 5-year predicted mortality.
Fig. 4 Receiver operating characteristic (ROC) curve and area under the curve (AUC) of predicted mortality as binary classifiers using cut-off-point of 18. (A) 1-year predicted mortality, (B) 2-year predicted mortality, and (C) 5-year predicted mortality.
|
Prediction |
Sensitivity |
Specificity |
PPV |
NPV |
Accuracy |
|---|---|---|---|---|---|
|
Abbreviations: NPV, negative predictive value; PPV, positive predictive value. |
|||||
|
1-year mortality |
0.77 |
0.61 |
0.25 |
0.94 |
0.70 |
|
2-year mortality |
0.60 |
0.63 |
0.42 |
0.77 |
0.62 |
|
5-year mortality |
0.53 |
0.65 |
0.60 |
0.58 |
0.59 |
Discussion
Overall median survival time have been reported between 3.9 and 10.8 years in the LGG which composed of astrocytomas, oligodendrogliomas, and mixed oligoastrocytomas.1 2 3 4 5 6 Spych et al reported LGG had the median survival times of 26.9 months (range: 25.4–46.8 months), whereas the median survival times was 48 months (range: 30 months–138 months) according to the study by Kumthekar et al.2 3 Moreover, The 1-year, 3-year, and 5-year overall survivals of LGG were 88.3, 55.1, and 43.3%, respectively.2 As the present results, the prognosis of our cohort was poorer than prior studies that the median survival time of the cohort was 26 months and the 5-year probability was 22.0%. Since the heterogeneity of the LGG population limits to comparison with the present cohort.
For negative prognostic factors, Pignatti et al reported that age >40 years, whereas Okamoto et al reported age >50 years associated with the poor prognosis.6 Similarly, the present study found the elderly patients had a poor prognosis. Furthermore, the presence of neurologic deficit before surgery was one of the significant prognostic factors, while motor response score of GCS was less than 6, as well as the poor performance status of the patients was associated with worse outcome in the present study.
Several studied reported that tumor resection significantly impacts the survival of LGGs.23 24 25 The result in the present study concordances the prior studies that biopsy was significantly associated with increased mortality. Furthermore, the effect of RT is controversial for improving outcome and prognosis. LGGs treated with postoperative RT which was highly correlated with overall survival3 9 in prior studies, whereas other studies reported that postoperative RT was no statistically significant difference in survival was seen between the postoperative RT and non-RT groups.2 8 26 However, the heterogeneity of the study population of LGGs was observed in previous studies. In the present cohort of DA, the radiotherapy following surgery was no statistically significant association with overall survival rate. From the literature review, a few studies focused on the prognosis of the DA group since the limitation of sample size were considered. Nevertheless, the present study, which focused on the specific DA group, had the strength in the homogeneity of the study population. To the best of our knowledge, this is the first study mentioned to evaluate and validate nomogram which is specific to DA.
Gorlia et al proposed nomogram for predicting survival of patients with LGGs including astrocytoma, oligodendroglioma, and mixed oligoastrocytoma. The final overall survival model, independent prognostic factors were identified as time since first LGG symptoms (HR = 0.67, p = 0.009), Medical Research Council (MRC) neurological score (HR = 1.51, p = 0.0001), independent confirmation of astrocytoma (HR = 1.96, p < 0.001), and tumor size (HR = 1.74, p = 0.001). However, there is a limitation of validation because the prediction of nomogram is probability at each time point and survival time.27 For example, predicted the 1-year probability of nomogram is 50% what we should interpret these results for an individual in the real-world applications. Therefore, we proposed nomogram validation as binary classifiers each time point with the optimal cut-off point in the present study. The nomogram of our cohort had acceptable performances for predicting 1-year mortality that had a high level of sensitivity and accuracy. For general practice, the nomogram could be applied as the screening tool for advising patients and managing treatment strategies. However, nomogram’s performances dropped for predicting 2- and 5-year mortality that needs external validation in the future.
Limitations
Certain limitations of the present study should be acknowledged. The IDH1 mutation of DAs did not perform in the present study because these genetic investigations have not routinely estimated in Thailand. Moreover, the possibility of bias and confounding factors cannot be excluded from the retrospective study. However, we presented to adjust the model by multivariable analysis for controlling this limitation28
Conclusion
We provided nomogram predicting prognosis of a patient with DA. The nomogram was acceptable performance for predicting 1-year mortality. The tool is a good clinical utility for optimizing therapeutic approaches and counseling patients.
Acknowledgment
The authors would like to offer special thanks to Associate Prof. Paramee Thongsuksai for advice about the manuscript preparation. Additionally, the authors would like to thank Mrs. Supaporn Sainamsai for interdepartment and interinstitutes coordination.
Key Messages
To the best of authors’ knowledge, this article is the first one to mention the nomogram predicting prognosis of diffuse astrocytoma. Moreover, we proposed that nomogram can be used in the binary outcome for simplifying nomogram application in the clinical practice.
Authors’ Contributions
T.T., S.R., U.I., A.K., and T.V. participated in study design and data collection plan. T.T., S.S., T.O., I.S., A.K., S.R., A.K., and T.V. supervised data collection. T.T., S.R., A.K., and T.V. contributed in data extraction, data management, and quality control. T.T. analyzed the data and drafted the manuscript. All authors contributed substantially to manuscript revision. T.T. takes responsibility for this paper as a whole.
Conflict of Interest
None declared.
Funding This study was funded by the faculty of Medicine at Prince of Songkla University, Thailand.
References
- Validation of EORTC prognostic factors for adults with low-grade glioma: a report using intergroup 86-72-51. Int J Radiat Oncol Biol Phys. 2011;81(1):218-224.
- [Google Scholar]
- Prognosis of older patients with low-grade glioma: a retrospective study. Integr Cancer Sci Ther. 2017;4(5):1-5.
- [Google Scholar]
- Response to postoperative radiotherapy as a prognostic factor for patients with low-grade gliomas. Oncol Lett. 2012;4(3):455-460.
- [Google Scholar]
- Update on molecular findings, management and outcome in low-grade gliomas. Nat Rev Neurol. 2010;6(12):695-701.
- [Google Scholar]
- Population-based studies on incidence, survival rates, and genetic alterations in astrocytic and oligodendroglial gliomas. J Neuropathol Exp Neurol. 2005;64(6):479-489.
- [Google Scholar]
- Population-based study on incidence, survival rates, and genetic alterations of low-grade diffuse astrocytomas and oligodendrogliomas. Acta Neuropathol. 2004;108(1):49-56.
- [Google Scholar]
- Prognostic factors for survival in adult patients with cerebral low-grade glioma. J Clin Oncol. 2002;20(8):2076-2084.
- [Google Scholar]
- Results of a policy of surveillance alone after surgical management of pediatric low grade gliomas. Int J Radiat Oncol Biol Phys. 2001;51(3):704-710.
- [Google Scholar]
- Randomized trial on the efficacy of radiotherapy for cerebral low-grade glioma in the adult: European Organization for Research and Treatment of Cancer Study 22845 with the Medical Research Council study BRO4: an interim analysis. Int J Radiat Oncol Biol Phys. 2002;52(2):316-324.
- [Google Scholar]
- A validation of two preoperative nomograms predicting recurrence following radical prostatectomy in a cohort of European men. Urol Oncol. 2002;7(4):141-146.
- [Google Scholar]
- Development and validation of a nomogram for predicting survival in patients with resected non-small-cell lung cancer. J Clin Oncol. 2015;33(8):861-869.
- [Google Scholar]
- A predictive model and nomogram for predicting return to work at 3 months after cervical spine surgery: an analysis from the Quality Outcomes Database. Neurosurg Focus. 2018;45(5):E9.
- [Google Scholar]
- A new nomogram for prediction of outcome of pediatric shock-wave lithotripsy. J Pediatr Urol. 2015;11(2):84.e1-84.e6.
- [Google Scholar]
- The 2016 WHO classification of tumours of the central nervous system: the major points of revision. Neurol Med Chir (Tokyo). 2017;57(7):301-311.
- [Google Scholar]
- The use of the nitrogen mustards in the palliative treatment of carcinoma - with particular reference to bronchogenic carcinoma. Cancer. 1948;1:634-656.
- [Google Scholar]
- Butterfly tumor of the corpus callosum: clinical characteristics, diagnosis, and survival analysis. J Neurosci Rural Pract. 2017;8(01):S57-S65.
- [Google Scholar]
- The influence of the extent of surgery on the neurological function and survival in malignant glioma. A retrospective analysis in 243 patients. J Neurol Neurosurg Psychiatry. 1990;53(6):466-471.
- [Google Scholar]
- Drawing nomograms with R: applications to categorical outcome and survival data. Ann Transl Med. 2017;5(10):211.
- [Google Scholar]
- Harrell FE Jr. Package ‘rms’. 2019. Available at: https://cran. r-project.org/web/packages/rms/rms.pdf. Accessed January 29, 2019
- Self-consistency: measurement and validation. Proc Ann Conv Am Psych Assoc. 1967;2:207-208.
- [Google Scholar]
- ROC analysis applied to the evaluation of medical imaging techniques. Invest Radiol. 1979;14(2):109-121.
- [Google Scholar]
- Sachs MC, Corty RW. Package ‘plotROC’ 2019. Available at: https://cran.r-project.org/web/packages/plotROC/plotROC.pdf. Accessed January 29, 2019
- The role of extent of resection in IDH1 wild-type or mutant low-grade gliomas. Neurosurgery. 2018;82(6):808-814.
- [CrossRef] [Google Scholar]
- Extent of resection and timing of surgery in adult low grade glioma. J Pak Med Assoc. 2017;67(6):959-961.
- [Google Scholar]
- Updated therapeutic strategy for adult low-grade glioma stratified by resection and tumor subtype. Neurol Med Chir (Tokyo). 2013;53(7):447-454.
- [Google Scholar]
- Long-term efficacy of early versus delayed radiotherapy for low-grade astrocytoma and oligodendroglioma in adults: the EORTC 22845 randomised trial. Lancet. 2005;366:985-990. (9490)
- [Google Scholar]
- New validated prognostic models and prognostic calculators in patients with low-grade gliomas diagnosed by central pathology review: a pooled analysis of EORTC/RTOG/NCCTG phase III clinical trials. Neuro-oncol. 2013;15(11):1568-1579.
- [Google Scholar]
- Observational research methods. Research design II: cohort, cross sectional, and case-control studies. Emerg Med J. 2003;20(1):54-60.
- [Google Scholar]


