
Translate this page into:
Malnutrition as a cause of mental retardation: A population-based study from Sub-Himalayan India
This is an open access article distributed under the terms of the Creative Commons Attribution NonCommercial ShareAlike 3.0 License, which allows others to remix, tweak, and build upon the work non commercially, as long as the author is credited and the new creations are licensed under the identical terms.
This article was originally published by Medknow Publications & Media Pvt Ltd and was migrated to Scientific Scholar after the change of Publisher.
Abstract
Background:
Mental retardation is one of the most common disabilities of childhood. The research on childhood malnutrition and its relationship with cognitive functioning suggests that malnutrition alone does not cause mental retardation.
Objective:
To identify the relation between malnutrition and cognition among children from a Sub-Himalayan state in North India.
Materials and Methods:
A two-phase cross-sectional study was conducted in the rural, urban, and slum area of district Kangra. A 30-cluster sampling technique was used to screen a population of children 1–10 years of age from five randomly selected panchayats (village government units) of district Kangra. The screening was based on a modified version of the ten questions screen, adapted to the local population. In the first phase, a door-to-door survey was done to identify suspects of mental retardation. In the second phase, the children found positive in the first phase were called for clinical examination to confirm mental retardation. Anthropometric assessment of all study children was done by measuring weight and height. The nutritional assessment was done by categorizing them according to Waterlow classification for malnutrition.
Results:
Out of the total 5300 children, 1.7% were diagnosed as mentally retarded. No positive association was reported with different types of malnutrition and mental retardation. A weakly positive association existed between nutritional status and mental retardation (correlation coefficient-0.04). Children who were both wasted and stunted had the highest risk (odds ratio, 95% confidence interval – 5.57, 2.29–10.36) of mental retardation as compared to normal.
Conclusion:
Malnutrition may be one of the causes but certainly not the only cause of mental retardation. Other causes may be contributing more significantly toward it.
Keywords
Malnutrition
mental retardation
Sub-Himalayan India

Introduction
Malnutrition has been defined “a pathological state resulting from a relative or absolute deficiency or excess of one or more essential nutrients.”[1] Sustained malnutrition among children may result in diminished cognitive functioning. It may also have to do with the fact that by the time undernourished children reach school-age, they may have a much lower potential to learn compared to their well-nourished peers.[2]
The research on child malnutrition and its relationship with cognitive functioning has grown in the last few decades. Research suggests that malnutrition alone does not cause irreversible damage to the brain but is believed to result from a complex interaction between environmental deprivation and undernutrition.[3] Further research does not establish a causal relationship between malnutrition and mental development that could facilitate more direct action.[3] A review of studies of the effects of severe malnutrition on mental development by Grantham-McGregor concludes that there is no consistent evidence of a specific cognitive deficit. Further, although the evidence of a causal relationship is strong but it is not unequivocal.[2]
Understanding the role of nutrition in cognitive impairment is crucial for us in Indian. This because almost half of children under 5 years of age (48%) are stunted and 43% are underweight.[4] The proportion of children who are severely undernourished is also notable: 24% are severely stunted and 16% are severely underweight. Wasting is quite a serious problem in India, affecting 20% of children under 5 years of age. Now, if undernutrition was a major risk factor for mental retardation, then one would expect to find higher prevalence rates of mental retardation in societies with increased prevalence of malnutrition, perhaps in pandemic proportions in subgroups with severe malnutrition. Keeping this in view, the present study was aimed to identify the relation between malnutrition and cognition among children from a Sub-Himalayan state in North India.
Materials and Methods
This study was carried out in Urban, rural, and slum population of district Kangra of Himachal Pradesh. For the purpose of the study, 9 wards of Kangra town with a population of 9528 along with its slum population was taken as urban and slum population, whereas Shahpur block, with a population of 136,000 and Nagrota Bagwan block with a population of 115,767 were taken as rural population. The study was carried out for a period of 1 year from January 1, 2013 to December 31, 2013. The study population included children in the age group of 1–10 years of age from the selected areas.
The sample size calculation was based on the recommendations of the WHO guidelines for population-based assessment of disabilities. A brief of the guidelines is as under:
In the WHO publication, “Development of indicators for monitoring progress towards health for all by the year 2000,” it is recommended that for covering all disabilities, a sample size of 1000 will suffice. However, if the survey is aimed at assessing specific disorders, such as mental retardation, a sample size of 5000 is suggested.[5] To achieve the most accurate estimates, it is advisable to conduct a house-to-house survey in three areas: One urban slum (including urban slum areas around the capital or other major city) and two rural areas, one that is relatively economically prosperous, and one that is poor.[5]
Keeping this in view, a sample of 5000 children was planned from urban area including its urban slum area and rural areas (Shahpur and Nagrota Bagwan areas) as mentioned earlier. However, to round-off the sample distribution in these areas, a total of 5300 children, 1–10 years of age (500 from urban and 4800 from two rural areas) were included in the study. The study population of 5300 was divided into a proportion of 90% and 10% between rural and urban areas, respectively, in accordance with the demographic distribution prevalent in Himachal Pradesh. The study design comprised a stratified two-stage sampling. The design was similar in rural and urban areas.
Urban area
The wards and the slum area formed the primary sampling unit, and the child as the secondary unit. About 50 children from each of the 9 wards of Kangra town and one slum area were included in the study, giving us a required sample size of 500 children.
Rural area
Samples were derived from two blocks; Nagrota Bagwan and Shahpur. The villages formed the primary sampling unit, and the child as the secondary unit. The 30-cluster technique primarily used to estimate immunization coverage was used as the strategy of picking up the primary sampling units. Before the sampling began, the population was divided into a complete set of nonoverlapping subpopulations (clusters) with a defined geographic (villages). After this, 30 of these clusters were sampled with probability proportionate to the size of the population in the cluster. A cluster of 30 villages was taken from each block. About 80 children taken from each cluster were included in the study to complete a sample requirement of 2400 children from each block. In case of insufficient number of children in a single cluster, the children in the adjoining village were included in the study. The areas were mapped and different directions identified in the selected ward/village. One direction was selected randomly. The first house on the left side was approached and a house-to-house survey was conducted to include secondary sampling units, i.e. children of age 1–10 years. Once the desired number was achieved the process was stopped. Each household was enquired for the presence of a child of <10 years of age. Parental permission was sought before including the child up to 7 years of age in the study after ensuring the following things:
-
The process was conducted in a manner and location that ensures participant privacy
-
Giving adequate information about the study in a language understandable to the participant
-
Providing adequate opportunity for the participant to consider all options
-
Responding to the participant's questions
-
Ensuring the participant has understood the information provided
-
Obtaining the participant's voluntary agreement to participate, and
-
Continuing to provide information as the participant or research requires.
In children above 7 years of age, consent from children in addition to parental permission, after fulfilling the above criteria, was obtained.
Thus, from each village and urban ward children <10 years of age were picked up independent of each other. In case, there was no such beneficiary, an inquiry in the immediate next house was made. The process was continued till a beneficiary was found and desired information was collected. The process was continued till the desired number for the sample was obtained; 50 in each urban ward and 80 in each village. Thus, 500 children from the 9 wards of Kangra and adjoining slum area and 2400 children from each rural area which includes Shahpur and Nagrota Bagwan blocks were included in the study. Once the children were identified, evaluation was performed. The evaluation was conducted in two phases; (1) screening phase, (2) clinical evaluation.
Phase I (screening phase)
Information about the child was preferably sought from the parents of the child. If the parents were not available, same information was collected from any adult respondent present in the house at that time. After the beneficiaries were identified, a screening questionnaire was administered to identify children suspected of mental retardation. The questionnaire was translated into local language and administered during a personal interview after establishing the validity of the translated version by a reiterative technique with the parent or guardian. The screening questionnaire had been prepared in accordance to the ten questions screen for the disability previously used in similar studies.[6789]
Using a global rather than a disability-specific interpretation of the ten questions,[7] a child was considered positive for any disability if a response to any one question indicated potential disability. Using the global definition, the ten question screen has been shown to have a good reliability and validity (sensitivity 85%) for detecting severe neurodevelopmental disabilities.[9] In addition to the ten question screen, a structured per forma was administered to collect demographic information about each child and his/her household. In addition, details on socioeconomic status of the child were enquired using Uday Pareek scale in the rural areas and Kuppuswamy scale in the urban areas.
Phase II (clinical evaluation)
All children who screened positive were referred for clinical evaluations. Clinical evaluation was performed (without the knowledge of the screening result) by a pediatrician and a clinical psychologist. The diagnosis of mental retardation was made after psychological assessment based on nonverbal scales from 1985 revision of the Stanford–Binet intelligence test.[10] The assessment of mental retardation was also based on the child's developmental history and her ability in motor skills and behavior. Classification of a child as mentally retarded implied “significantly subaverage intellectual functioning existing concurrently with related limitations in two or more of the following applicable adaptive skill areas with such limitations manifested before age 18.”[11]
-
Communication
-
Self-care
-
Home living
-
Social skills
-
Community use
-
Self-direction
-
Health and safety
-
Functional academics
-
Leisure and work.
Measurement of height and weight
For the measurement of weight, the child was asked to step up backward onto the scale and stand still over the center of the scale with body weight evenly distributed between both feet. The child's arms were hanging freely by the sides of the body, with palms facing the thighs. The child was asked to hold his/her head up, and face forward. Weight was recorded to the nearest to 100 g using the recommended scale with a digital readout. For the measurement of standing height, a stadiometer was used. The child was asked to stand with his/her back against the board. The back, scapulae, and buttocks were in contact with the vertical board. The child was instructed to stand erect (stand up straight and look straight ahead). The child's position was verified from both the front and from the left side of the body. Next, the child's head was positioned in the Frankfort horizontal plane. Next, a movable headpiece was brought onto the uppermost (superior) point on the head with sufficient pressure to compress the hair. The measurement was recorded to the nearest to 0.1 cm. For a child <2 years length was measured. The investigators asked to lay the child on his back with his head against the fixed headboard, compressing the hair. The head was asked to be placed in such a way that an imaginary vertical line from the ear canal to the lower border of the eye socket is perpendicular to the board (The child's eyes looking straight up). The mother was asked to move behind the headboard and hold the head in this position. Shoulders were made to touch the board, and the spine was not allowed to arch.
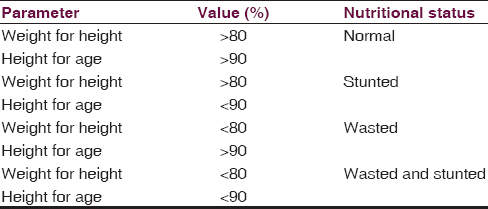
Waterlow's classification of nutritional status based on height for age and weight for age was used to categorize the children for malnutrition.[12] This classification for defining malnutrition was used because of it being age independent. The classification has been described in Table 1.
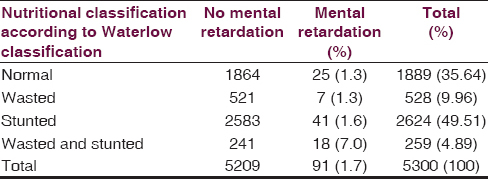
Results
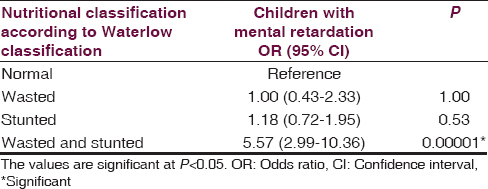
The details of the study population have been provided in Table 2. A total of 5300 children were included in this study. Prevalence of mental retardation was 1.7% (91/5300). According to Waterlow's classification, 49.5% of children were stunted, 10.0% were wasted, and 4.9% were both wasted and stunted. A higher proportion (7.0%) of children in “wasted and stunted” were found to be mentally retarded as compared to “only stunted” group (1.6%), “only wasted” group (1.3%), and normal children (1.3%). The association depicted in Table 3 between nutrition status and mental retardation shows that there is a statistically significant (P = 0.0001) 6 times increased risk of mental retardation in children who are both wasted and stunted (odds ratio [OR], 95% confidence interval [CI] – 5.57, 2.29–10.36) as compared to normal nutrition status children. The risk decreases in only wasted and only stunted children when compared to both wasted and stunted. The risk of mental retardation MR is equal to normal children in only wasted group (OR, 95% CI – 1.00, 0.43–2.33) and 18% more in only stunted group (OR, 95% CI – 1.18, 0.72–1.95) as compared to normal children; however, this association was statistically nonsignificant. On applying linear regression analysis statistically significant (P = 0.001) association between nutrition status and mental retardation was found; however, it was an imperfect positive correlation (correlation coefficient – 0.04) [Figure 1].

- Association between different grades of malnutrition (according to Waterlow classification) and presence and absence of mental retardation. Y axis-mental retardation, “0”: No mental retardation, “1”: Mental retardation present, X-axis-Nutrition status, “1”: Normal, “2”: Wasted, “3”: Stunted, “4”: Wasted and stunted both
Discussion
Continuous low nutritional intake combined with poor access to healthcare is likely to impact on children's psychological development in terms of attentiveness, emotional expression, motivation, learning ability, and school performance. Nutrition is interconnected with the environment, psychological health, health, and education. Malnutrition must be considered alongside other factors in childhood development. Psychosocial stimulation received by the children seems to make a significant contribution in alleviating the effects of malnutrition. Several studies show that nutritional supplementation when combined with stimulation has substantial benefits for cognitive development.[21011] Children who experience undernutrition are also likely to grow up in an understimulated social and psychological environment and it is the complex interaction between these factors that causes cognitive deficits. Since it is difficult to unravel the complexity of the mechanisms and sift out the effect of psychosocial stimulation, it is difficult to establish the existence of a causal relationship between undernutrition alone and cognitive development of children.
The proportion of underweight children in Himachal Pradesh state is 35–39%. This proportion although on higher side is better than the national figures.[4] However, the prevalence of mental retardation at 1.7% is higher as compared to the rest of the country. The prevalence of mental retardation is even higher than the neighboring state of J and K, wherein the prevalence is only 0.72%.[1314] The current corroborates on the absence of an unequivocal role of malnutrition alone as a cause for cognitive impairment. The future research should focus on the role of undernutrition on cognition. The current study does point to a correlation between nutritional deficiency and mental retardation, but the correlation is too weak to be of causal nature. Further nutritional deficiency may have an indirect effect on cognition. Nutritional deficiency may affect school enrollment and therefore participation in learning.
Limitations
A study of micronutrient deficiency among the study participants would have ruled out the possibility of confounding by such deficiencies or the lack of their deficiency.
Financial support and sponsorship
Nil.
Conflicts of interest
There are no conflicts of interest.
References
- The assessment of the nutritional status of the community (with special reference to field surveys in developing regions of the world) Monogr Ser World Health Organ. 1966;53:3-271.
- [Google Scholar]
- A review of studies of the effect of severe malnutrition on mental development. J Nutr. 1995;125(8 Suppl):2233S-8S.
- [Google Scholar]
- The impact of health and nutrition on education. World Bank Res Obs. 1996;11:23-37.
- [Google Scholar]
- Ministry of Health and Family Welfare, Government of India. Nutrition in India. 2005-2006. National Family Health Survey (NFHS-3). India. Available from: rchiips.org/nfhs/nfhs3.shtml
- [Google Scholar]
- A prevalence study of mental retardation in a metropolitan area. Am J Public Health Nations Health. 1956;46:702-7.
- [Google Scholar]
- Variation in the influence of selected sociodemographic risk factors for mental retardation. Am J Public Health. 1995;85:329-34.
- [Google Scholar]
- Prevalence and correlates of mental retardation among children in Karachi, Pakistan. Am J Epidemiol. 1998;147:281-8.
- [Google Scholar]
- Prevalence of mental retardation among children in Saudi Arabia. East Mediterr Health J. 2003;9:6-11.
- [Google Scholar]
- Trends in the prevalence of developmental disabilities in US children, 1997-2008. Pediatrics. 2011;127:1034-42.
- [Google Scholar]
- Effects of growth restriction in early childhood on growth, IQ, and cognition at age 11 to 12 years and the benefits of nutritional supplementation and psychosocial stimulation. J Pediatr. 2000;137:36-41.
- [Google Scholar]
- Primary school progress after preschool experience: Troublesome issues in the conduct of follow up research and findings from the Cali, Columbia, study. In: Preventing School Failure: The Relationship Between Preschool and Primary Education. Ottawa, Ont.: International Development Research Centre; 1983. p. :36-41.
- [Google Scholar]
- Classification and definition of protein-calorie malnutrition. Br Med J. 1972;3:566-9.
- [Google Scholar]
- Socio demography of mental retardation: A community-based study from a goitre zone in rural sub-Himalayan India. J Neurosci Rural Pract. 2015;6:165-9.
- [Google Scholar]
- Prevalence of mental retardation among children in RS Pura town of Jammu and Kashmir. Ann Indian Acad Neurol. 2012;15:23-6.
- [Google Scholar]


