
Translate this page into:
Assessing the predictive values of sural/radial amplitude ratio and dorsal sural/radial amplitude ratio in peripheral neuropathy of type 2 diabetes mellitus
 , Charu Bansal3, Arpita Chakraborty1, Rubia Mondal1, Boudhayan Das Munshi2, Manjusha Ashlesh Shinde1, Tandra Ghosh1,
*Corresponding author: Tandra Ghosh, Department of Physiology, All India Institute of Medical Sciences, Kalyani, Kolkata, West Bengal, India. tandra12@gmail.com
-
Received: ,
Accepted: ,
How to cite this article: Shaikh A, Bansal C, Chakraborty A, Mondal R, Das Munshi B, Shinde MA, et al. Assessing the predictive values of sural/radial amplitude ratio and dorsal sural/radial amplitude ratio in peripheral neuropathy of type 2 diabetes mellitus. J Neurosci Rural Pract. doi: 10.25259/JNRP_446_2024
Abstract
Objective:
Diabetic peripheral neuropathy (DPN) is a common complication of diabetes; timely detection is critical for preventing severe complications. Traditional nerve conduction studies (NCS) are the gold standard for assessing neuropathy, but traditional NCS cannot detect neuropathy in very early or mild cases. The sural/radial amplitude ratio (SRAR) and dorsal sural/radial amplitude ratio (DSRAR) have emerged as potential markers for identifying early, length-dependent neuropathy in diabetic patients, though standardized cut-off values remain unexplored. This study evaluates the diagnostic effectiveness of the SRAR and DSRAR in identifying diabetic neuropathy (DPN) among individuals with type 2 diabetes mellitus (T2DM). By analyzing sensory nerve conduction parameters of the foot and arm, the study aims to compare the efficacy of these amplitude ratios in distinguishing neuropathic from non-neuropathic individuals.
Materials and Methods:
A cross-sectional study was conducted among patients with T2DM, classified into neuropathic (VPT > 15) and non-neuropathic (VPT < 15) groups based on vibration perception threshold (VPT). Sural and dorsal sural nerve amplitudes were recorded alongside radial nerve amplitudes, and the SRAR and DSRAR were calculated. A total of 103 participants (mean age: 53.55 ± 10.57 years; mean body mass index: 25.34 ± 4.31 kg/m2) with T2DM (mean duration: 9.28 ± 6.54 years) were included. Diagnostic accuracy, sensitivity, specificity, and predictive values were assessed using receiver operating characteristic analysis and the area under the curve (AUC) was calculated for both SRAR and DSRAR.
Results:
Sural and dorsal sural nerve amplitudes were significantly lower in the neuropathic group (P < 0.01). The mean SRAR was 0.72 ± 0.23 in non-neuropathic participants and 0.56 ± 0.25 in those with neuropathy (P = 0.004). Similarly, DSRAR was markedly reduced in the neuropathic group (0.22 ± 0.03 vs. 0.28 ± 0.02; P = 0.001). At cut-off values of 0.59 (SRAR) and 0.26 (DSRAR), the sensitivity and specificity of DSRAR (83.72% and 86.36%) surpassed those of SRAR (68.97% and 62.16%).
Conclusion:
Both SRAR and DSRAR demonstrate diagnostic potential for detecting diabetic neuropathy; however, DSRAR exhibits superior sensitivity, specificity, and overall diagnostic accuracy. With its higher predictive values and robust AUC, DSRAR may be a more reliable non-invasive marker for the clinical evaluation of neuropathy in T2DM patients.
Keywords
Diabetic peripheral neuropathy
Dorsal sural/radial amplitude ratio
Nerve conduction study
Sensory nerve action potential
Sural/radial amplitude ratio

INTRODUCTION
Diabetic peripheral neuropathy (DPN) is a frequent complication of diabetes. Symmetric or asymmetric distal sensory or combined sensory-motor neuropathy is overwhelmingly the most common form of neuropathy in diabetes.[1] The main symptoms of diabetic neuropathy are pain, tingling, numbness, and loss of sensation, particularly in the lower extremities, and can significantly impair the quality of life. Studies have shown that over 50% of people with diabetes will develop some form of neuropathy during their lifetime.[2] Specifically, the prevalence of DPN in people with diabetes ranges from 18.8% to 61.9%, although it depends on the population studied and the diagnostic criteria used.[3] Nerve conduction studies (NCS) are a gold standard for the assessment of neuropathy in diabetes. As reported previously, the sural sensory nerve action potential (SNAP) is a crucial diagnostic tool for identifying length-dependent distal sensory or sensory-motor axonal peripheral neuropathy.[4] In addition to the Sural SNAP, evaluation of the dorsal sural nerve is important for comprehensive evaluation because the dorsal sural nerve supplies sensation to the posterior and lateral aspects of the lower leg and foot. It is the most distal and sensory nerve and may be affected in the early stage of length-dependent neuropathy.[5] Some studies have reported that the dorsal sural nerve recording is reliable in the diagnosis of early peripheral neuropathy.[6]
However, both sural and dorsal sural sensory potential may be affected by aging, walking barefoot, previous callus, or injury. The sural/radial amplitude ratio (SRAR) has been proposed to address these limitations as a more sensitive diagnostic measure.[7] The SRAR is calculated by comparing the amplitude of the sural SNAP to that of the radial SNAP, with the hypothesis that a decrease in the sural SNAP amplitude will occur before changes in the radial SNAP amplitude in cases of length-dependent neuropathy. In this study, we have also assessed the dorsal sural/radial amplitude ratio (DSRAR), which compares the amplitude of the dorsal sural SNAP to the radial SNAP, as a potential measure for detecting length-dependent neuropathy in type 2 diabetes mellitus (T2DM) patients earlier or at minimal stage, with the hypothesis that as dorsal sural lies more distal than sural, changes in dorsal sural amplitude would be earlier in neuron damage.
In this study, we have used vibration perception threshold (VPT) as an operational diagnostic criterion for diabetic neuropathy. VPT measures the ability of a patient to detect vibrations in the skin, primarily in the feet, and is a widely recognized tool for evaluating diabetic neuropathy.[8] Higher VPT values indicate impaired sensation and a severe degree of neuropathy, while lower values are associated with healthier nerve function.[9,10]
The study aimed to assess and compare the diagnostic efficacy of SRAR and DSRAR among diabetic patients with a VPT >15, indicative of neuropathy, to those with a VPT <15, representing non-neuropathic individuals.
MATERIALS AND METHODS
This study was a cross-sectional analytical study. The study was conducted at the neurophysiology laboratory at AIIMS Kalyani, a tertiary care center in Nadia district, West Bengal. The study was conducted after approval from the institutional ethical committee, and informed consent was obtained from all participants. Convenience sampling was used to recruit subjects. 103 patients gave consent and participated in the study. The study included participants aged above 18 years with a confirmed diagnosis of T2DM. Patients were screened using the Michigan Neuropathy Screening Instrument (MNSI) as per standard protocol. Participants with known Type 1 diabetes mellitus, uncontrolled diabetes, hereditary neuropathies, neurodegenerative and neuropsychiatric disorders, severe liver disease or cirrhosis, thyroid dysfunction (uncontrolled hypo- or hyperthyroidism), on neurotoxic medications, alcoholic neuropathy with active or old foot ulcer or presence of foot callus, subjects barefoot walking habit, were excluded from the study. Anthropometric parameters of all subjects, including age, weight, height, and body mass index (BMI), were recorded as per standard guidelines. In addition, the duration of diabetes was also included in the study.
The Michigan Screening for Diabetes refers to a set of guidelines developed to assess peripheral neuropathy in diabetes. The Michigan Neuropathy Screening Index was administered by two trained staff alternately, following a standardized protocol to ensure accurate, reproducible results minimizing bias. Patients were asked to complete a detailed self-administered questionnaire, designed to assess the presence and severity of neuropathic symptoms, such as numbness, tingling, and pain in the feet. Following the questionnaire, a thorough physical examination of the patient’s feet was performed by trained staff. The examination involved assessing foot appearance for deformities, callus formation, and ulcerations, as well as evaluating sensory function using a 128 Hz tuning fork to test vibratory sensation. In addition, deep tendon reflexes, particularly the ankle reflex, were elicited with a reflex hammer to gauge the integrity of the peripheral nerves. Each component of the physical exam was scored according to predefined criteria. The scores obtained from the self-administered questionnaire and the clinical examination were then combined to calculate the overall Michigan Neuropathy Screening Index.
The vibration perception threshold (VPT) test was conducted using the Biothezi VPT-UltraSystem integrated with Kodys Foot Clinik Version 2 Software to assess peripheral neuropathy in diabetic patients. The testing procedure followed a standardized protocol to ensure the accuracy and reliability of the results by single trained staff. The person doing VPT was blinded by the MNSI score. At first, the procedure was explained to the patient to ensure their cooperation and understanding. The patient was comfortably seated in a quiet, temperature-controlled room to minimize external influences on sensory perception. A thorough inspection of the feet was performed to check for any wounds, ulcers, or calluses that could interfere with the test results. The test was performed by placing a standardized vibrating probe at specific anatomical sites on the plantar surface of the foot, typically over the great toe, first metatarsal head, and heel. The vibration intensity was gradually increased, and the patient was instructed to indicate the first perception of vibration. The Kodys Foot Clinik Version 2 Software automatically recorded the VPT values, analyzed them, and provided the average value. Each measurement was repeated 3 times for consistency. Based on the obtained VPT values, patients were categorized into neuropathic and non-neuropathic groups. Those with a VPT >15 were classified as having peripheral neuropathy, with further stratification into mild (15–20 V), moderate (21–25 V), and severe (>25 V) neuropathy.[11] Patients with a VPT <15 were classified as non-neuropathic.[11]
Standard electrodiagnostic protocols were followed to study bilateral sural, dorsal sural, and radial SNAPs antidromically. The NCS was performed using a Neurosoft-MEP8 nerve conduction system by a trained neuro-technician who was blinded to VPT and MNSI values. All tests adhered to a standardized protocol, filters set at filters set at 5 Hz to 2 kHz with a sweep speed of 2 ms per division, sensitivity at 10 μV for sensory studies. An average of 20 stimuli was used for sensory studies. The test was explained to the subject; the stimulating and recording sites were cleaned with spirit. Room temperature was maintained at 32°C. Onset latency and peak-to-peak amplitudes were measured by the SNAPs.
For sural sensory nerve conduction, the subject requested to lie in the opposite lateral position. The active recording (E1) electrode was placed just posterior to the lateral malleolus, and the reference electrode (E2) was placed 4 cm distal to it. The ground electrode (E0) was placed between the recording and stimulating electrodes after marking the stimulus sites along the posterior–lateral calf at a 10 cm distance proximal to the active recording electrode.
For dorsal sural sensory nerve conduction recordings were taken in the opposite lateral position. Self-adhesive stick-on electrodes were used to record the potential, keeping the reference electrode (E2) in the web space of digits 4 and 5 and the active electrode (E1) 3 cm proximal to (E2). The ground electrode (E0) was placed between the recording and stimulating electrodes. The stimulation site was kept at a fixed distance of 10 cm from the active electrode, along a line from below the tip of the lateral malleolus to just posterior to the lateral malleolus (along the course of the sural nerve).
For radial nerve sensory conduction, the patient was in a supine position; the forearm was in the prone position, with the active electrode (E1) in the anatomical snuffbox and the reference electrode (E2) 4 cm distal to it. Ground (E0) was placed between the stimulating and recording electrodes after marking the stimulation sites 10 cm proximal to the active electrode along the lateral border of the forearm.
The ratios of amplitudes of Sural: Radial and Dorsal Sural: Radial were calculated for each patient during analysis.
Statistical analysis
All data were analyzed using Jamovi software version 2.5.6. Descriptive statistics, including mean standard deviation (SD), were calculated. Binomial logistic regression analysis was conducted to assess whether the ratios of neurophysiological parameters could serve as independent predictors of neuropathy. The receiver operating characteristic curve (ROC) and Youden’s Index were used as a summary measure to evaluate the overall effectiveness of the diagnostic tests. Sensitivity, specificity, positive predictive value (PPV), and negative predictive value (NPV) were computed for the estimated SRAR and DSRAR cut-off values. The Pearson correlation was calculated as a measure of the association between these ratios (SRAR and DSRAR) and the presence of neuropathy. P < 0.05 was considered as statistically significant.
RESULTS
The study sample consisted of participants with a mean age of 53.55 years (SD = 10.57) of average height of 156.3 cm (SD = 7.78), a mean weight of 61.83 kg (SD = 11.33), and an average BMI of 25.34 kg/m2 (SD = 4.31). Patients without neuropathy (VPT < 15) had a mean VPT of 10.03 ± 4.06, whereas those with neuropathy (VPT > 15) had a significantly higher mean VPT of 30.9 ± 12.14, (P = 0.0001). Michigan Neuropathy Score was significantly higher in the neuropathic group (8.28 ± 3.05) compared to those without neuropathy (6.94 ± 3.32) (P = 0.003). There was no significant correlation between VPT and MNSI among the two groups (VPT>15 and VPT<15) [Table 1].
| Parameter | Whole cohort (Mean±SD) |
VPT<15 (without neuropathy) (Mean±SD) |
VPT>15 (with neuropathy) (Mean±SD) |
P-value |
|---|---|---|---|---|
| Age (years) | 53.55±10.57 | 49.63±9.6 | 56.07±10.37 | 0.0001* |
| Height (cm) | 156.3±7.78 | 154.6±7.4 | 157.4±7.8 | 0.01* |
| Weight (kg) | 61.83±11.33 | 61.01±8.76 | 62.12±12.66 | 0.494 |
| BMI (kg/m2) | 25.34±4.31 | 25.61±4.03 | 25.07±4.46 | 0.381 |
| Duration of T2DM (years) | - | 8.78±5.25 | 9.72±6.88 | 0.299 |
| Vibration perception threshold (volts) | - | 10.03±4.06 | 30.9±12.14 | 0.0001* |
| Michigan scoring | - | 6.94±3.32 | 8.28±3.05 | 0.003* |
This tablepresents the mean and SD of demographic characteristics of the participants. The age, height, weight, and BMI are reported for the entire cohort as well as the two subgroups, i.e., patients with and without neuropathy, while the duration of T2DM, VPT, and Michigan scoring are provided separately for patients with and without neuropathy, based on the VPT cut-off value of 15. *P<0.05 is considered statistically significant. T2DM: Type 2 diabetes mellitus, SD: Standard deviation, BMI: Body mass index, VPT: Vibration perception threshold.
Among 103 participants or 206 nerves, sural nerve responses were not recordable in 65 nerves. The mean duration of diabetes was 8.69 ± 6.61 years among the non-recordable subjects. Dorsal sural nerve responses were not recordable in 114 nerves, corresponding to a mean duration of diabetes of 10.25 ± 6.87 years, whereas 42 nerves had absent radial SNAPs. In the neuropathy group with absent sural SNAPs (n = 48), the mean VPT was 27.27, and the mean MNSI score was 36.52, indicating a strong positive correlation between VPT and MNSI (r = 0.85, P < 0.0001). However, in the neuropathy group with absent dorsal sural SNAPs (n = 80), the mean VPT was 30.83 and the mean MNSI score was 40.69. The correlation between VPT and MNSI was negligible (r = 0.056, P = 0.619) in this subgroup. However, in non-neuropathic patients with absent sural SNAPs (n = 17), the mean VPT was 9.42 and the mean MNSI score was 7.47, with a negligible correlation between VPT and MNSI (r = −0.044, P = 0.86). In nonneuropathic patients with absent dorsal sural SNAPs (n = 34), the mean VPT was 10.92 and the mean MNSI score was 8.52, showing a low, non-significant correlation (r = 0.26, P = 0.13).
In Table 2, participants diagnosed with neuropathy (VPT > 15) exhibited significantly reduced mean values for both sural and dorsal sural amplitudes compared to patients without neuropathy (VPT < 15) [Figure 1].
| VPT | Nerves | Sensory NCS parameters | Mean | SD | Median |
|---|---|---|---|---|---|
| VPT<15 (Without neuropathy) (n=79) |
Sural (n=62) | L (ms) | 2.09 | 0.43 | 2.1 |
| Amp (µV) | 15.93 | 12.29 | 12.8 | ||
| Dorsal sural (n=45) | L (ms) | 2.28 | 0.47 | 2.2 | |
| Amp (µV) | 6.03 | 3.25 | 5.1 | ||
| Radial (n=71) | L (ms) | 1.88 | 0.29 | 1.8 | |
| Amp (µV) | 21.04 | 10.43 | 18.2 | ||
| VPT>15 (With neuropathy) (n=127) | Sural (n=79) | L (ms) | 2.29 | 0.46 | 2.2 |
| Amp (µV) | 10.80 | 8.45 | 9.15 | ||
| Dorsal sural (n=47) | L (ms) | 2.34 | 0.57 | 2.3 | |
| Amp (µV) | 5.00 | 1.92 | 4.3 | ||
| Radial (n=93) | L (ms) | 2.01 | 0.35 | 2 | |
| Amp (µV) | 18.95 | 10.98 | 16.8 |
Detailed presentation of the sensory nerve conduction study (NCS) parameters for participants with diabetes, stratified according to their neuropathy status as determined by the vibration perception threshold (VPT) of<15 Volts as non-neuropathic and vibration perception threshold (VPT) of>15 Volts as neuropathic. VPT: Vibration perception threshold, L: Latency, Amp: Amplitude, n: Number, SD: Standard deviation.
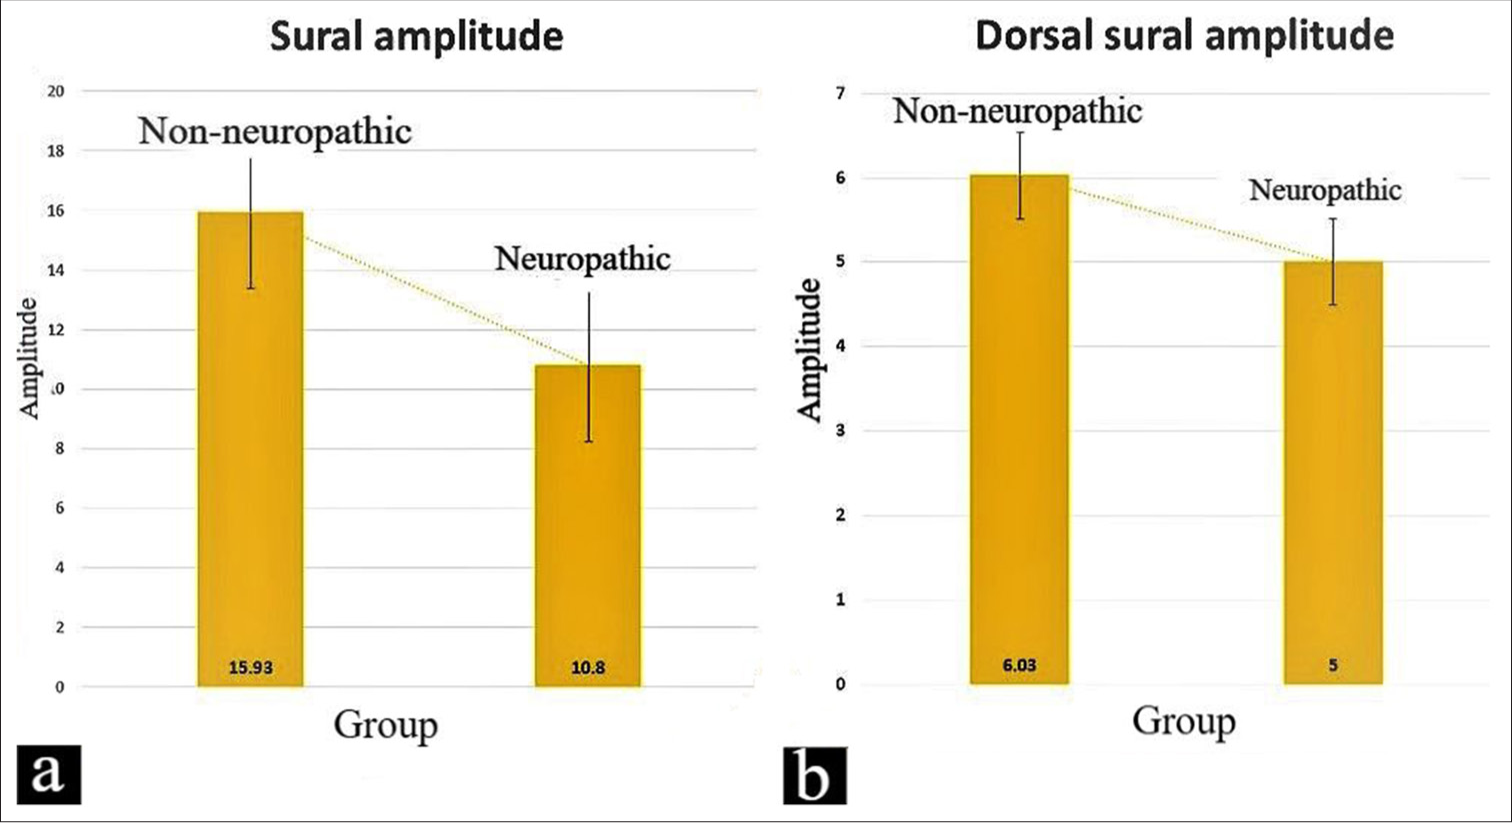
- (a) The analysis comparing the sural amplitudes among non-neuropathic and neuropathic diabetics (P = 0.01). (b) The analysis compares the dorsal sural amplitudes among non-neuropathic and neuropathic diabetics (P = 0.04).
In Table 3, the contingency tables provided a comprehensive illustration of the diagnostic performance of the SRAR and the DSRAR in the identification of neuropathy among participants. The substantial difference in positive versus negative test outcomes across both groups suggests that DSRAR may serve as a more reliable indicator as also indicated in Figures 2 and 3.
| Cut-off value for SRAR obtained by ROC analysis: 0.59 | ||||
| VPT | SRAR | |||
| Without neuropathy | With neuropathy | Total | ||
| Negative (<15) | 46 (TN) | 28 (FP) | 74 | Specificity=62.16% |
| Positive (>15) | 18 (FN) | 40 (TP) | 58 | Sensitivity=68.97% |
| Total | 64 | 68 | 132 | |
| NPV=71.88% | PPV=58.82% | |||
| Cut-off value for DSRAR obtained by ROC analysis: 0.26 | ||||
| VPT | DSRAR | |||
| Without neuropathy | With neuropathy | Total | ||
| Negative (<15) | 38 (TN) | 6 (FP) | 44 | Specificity=86.36% |
| Positive (>15) | 7 (FN) | 36 (TP) | 49 | Sensitivity=83.72% |
| Total | 45 | 42 | 92 | |
| NPV=84.44% | PPV=85.71% | |||
The contingency tables provided a comprehensive illustration of the diagnostic performance of the SRAR and the DSRAR in the identification of neuropathy among participants. SRAR: Sural/radial amplitude ratio, DSRAR: Dorsal sural/radial amplitude ratio, VPT: Vibration perception threshold, TN: True negative, FP: False positive, FN: False negative, TP: True positive, PPV: Positive predictive value, NPV: Negative predictive value, ROC: Receiver operating characteristic curve.
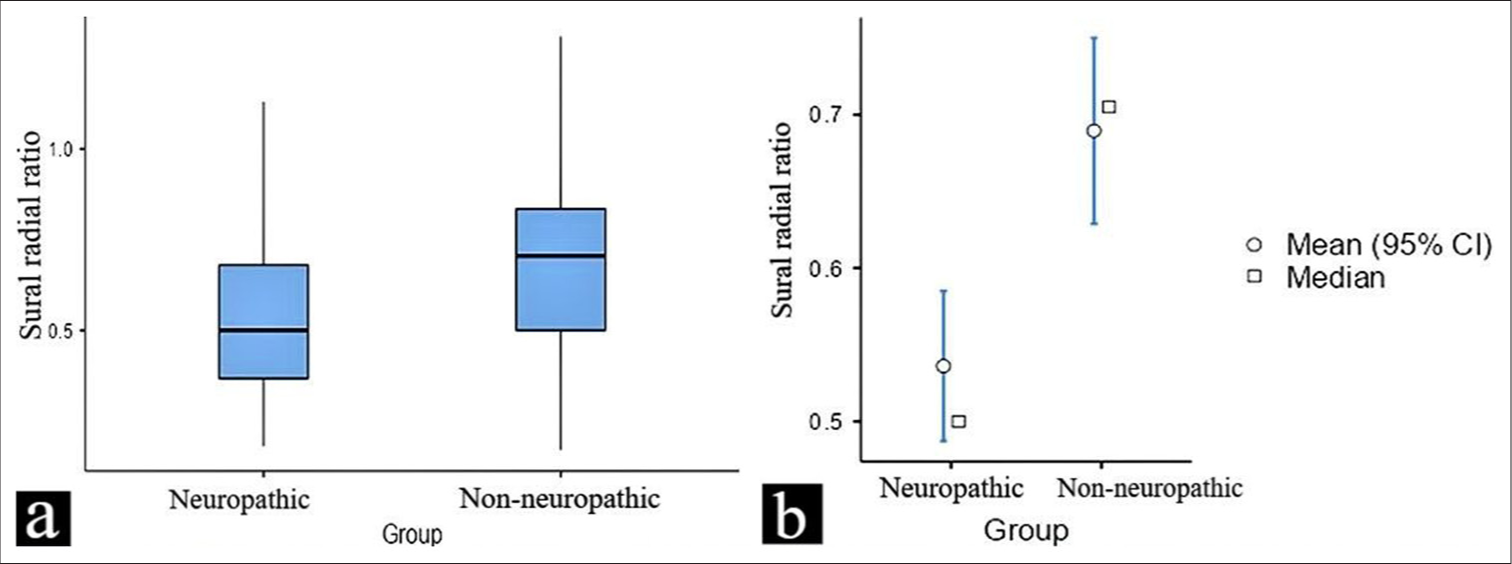
- (a and b) This figure illustrates the difference in the sural/radial amplitude ratio values between neuropathic and non-neuropathic in a diabetic population. The data are presented as box plots, highlighting the mean, median, and potential outliers for both groups. CI: Confidence interval.
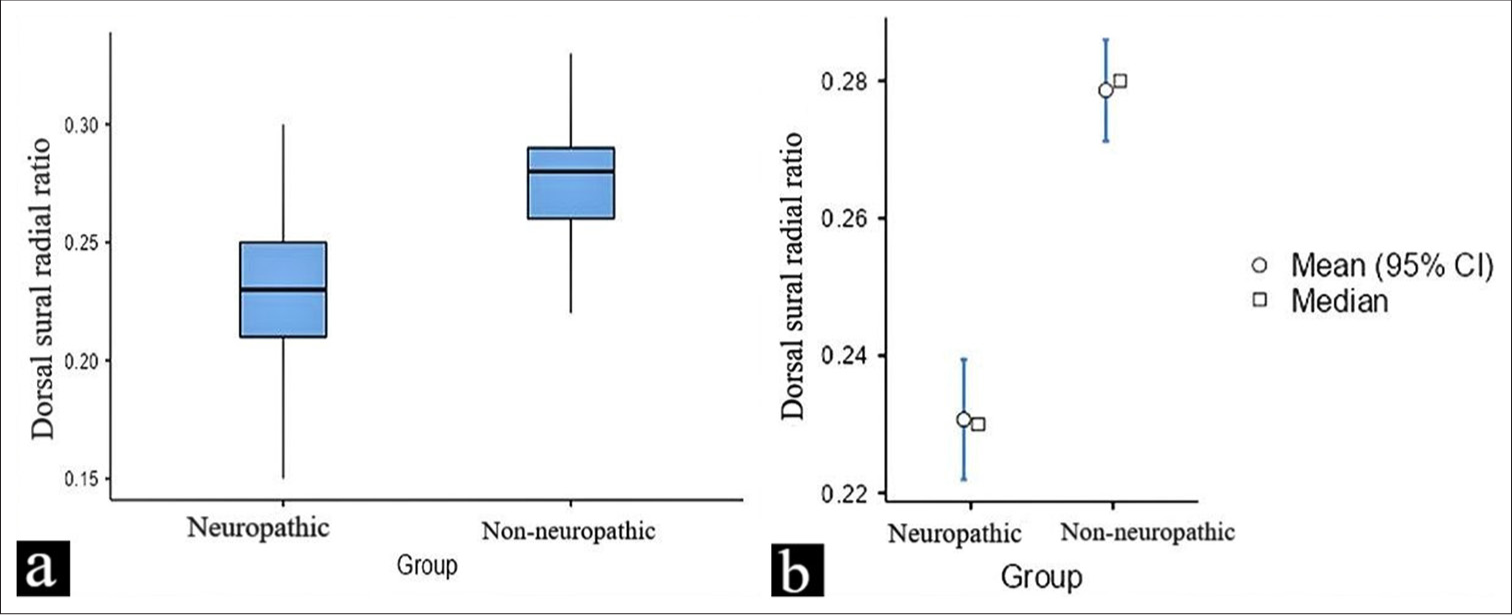
- (a and b) This figure illustrates the difference in the dorsal sural/radial amplitude ratio values between neuropathic and non-neuropathic in a diabetic population. The data are presented as box plots, highlighting the mean, median, and potential outliers for both groups. CI: Confidence interval.
The Youden’s Index for SRAR was calculated to be 0.311, whereas DSRAR demonstrated a markedly higher index of 0.701. The optimal cut-off value for the SRAR was determined to be 0.59, as identified using the Youden Index. The diagnostic performance of SRAR was quantified by an area under the curve (AUC) of 0.692 [Figure 4], the sensitivity of SRAR was 68.97% and the specificity was found to be 62.16%. The PPV was at 58.82%, reflecting a strong likelihood that individuals identified as positive for neuropathy indeed had the condition. Conversely, the NPV was at 71.88%; a high NPV indicates that the test is effective in ruling out the condition in those who test negative.
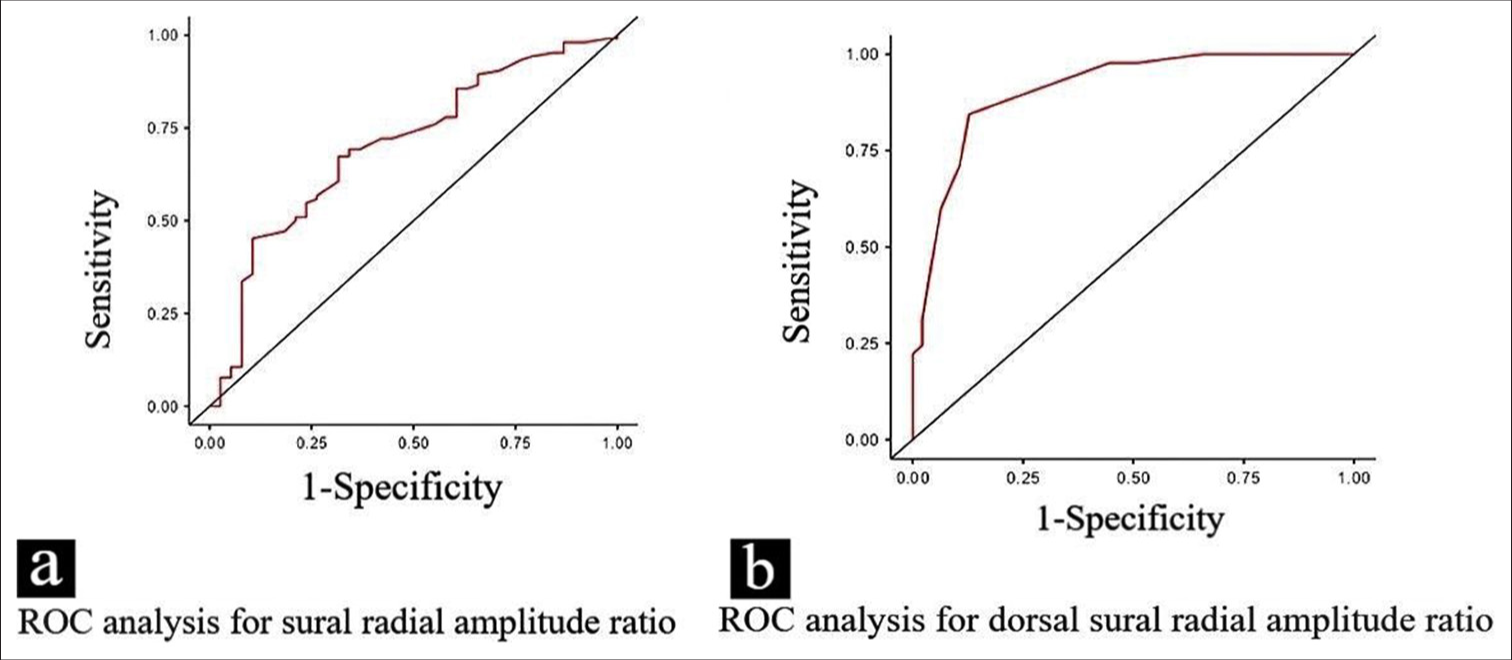
- (a and b) The receiver operating characteristic curve shows the diagnostic performance of the sural/radial amplitude ratio and dorsal sural/radial amplitude ratio in distinguishing between neuropathic and non-neuropathic groups. The curves illustrate the trade-offs between sensitivity and 1-specificity at different threshold points for both ratios. ROC: Receiver operating characteristic curve.
The AUC for DSRAR was significantly higher at 0.90 [Figure 4]. The sensitivity for DSRAR was calculated at 83.72%, implying that it successfully identified a substantial majority of individuals with neuropathy. Specificity was similarly impressive at 86.36%, denoting its ability to correctly classify those without neuropathy. In addition, the PPV for DSRAR was recorded at 85.71%, further reinforcing its reliability in predicting neuropathy presence, while the NPV was a commendable 84.44%, indicating a strong likelihood that negative results effectively rule out the condition.
Participants with VPT < 15 had a mean SRAR of 0.68 (SD = 0.23), while those with VPT > 15 had a significantly attenuated mean SRAR of 0.53 (SD = 0.21) (t = 3.8 and p-value = 0.0002). This difference in SRAR between the two groups suggests that higher VPT, which is indicative of neuropathy, is associated with lower SRAR values, reflecting impaired nerve function. For DSRAR, participants with VPT < 15 showed a mean of 0.27 (SD = 0.02). In contrast, participants with VPT > 15 had a lower mean DSRAR of 0.23 (SD = 0.02), with a t-value of 9.3 and a P-value of 0.0001 indicating the difference between these two groups is statistically significant.
The binomial logistic regression analysis revealed that the model explained approximately 48.1% of the variance in predicting neuropathy, as indicated by the Cox-Snell R2 value of 0.481. The Omnibus likelihood ratio tests showed that the sural radial ratio had a Chi-squared value of 1.85 with a P-value of 0.174, suggesting it was not statistically significant in predicting neuropathy. In contrast, the dorsal sural radial ratio demonstrated a strong and statistically significant association with neuropathy, with a Chi-squared value of 27.28 and a P < 0.001. The regression coefficients indicated that while the sural radial ratio had a negative estimate of −2.67 (P = 0.179), it did not significantly contribute to predicting neuropathy. However, the dorsal sural radial ratio had a large negative estimate of −74.97 (P < 0.001), suggesting a significant relationship with the likelihood of having neuropathy. These results indicate that the dorsal sural radial ratio is a stronger and more reliable predictor of neuropathy compared to the sural radial ratio.
DISCUSSION
A study by Siddiqui et al.[12] examines the role of nerve conduction studies (NCS) in diagnosing diabetic neuropathy, highlighting how reduced nerve conduction amplitudes, especially in sensory nerves like the sural nerve, serve as indicators of nerve damage. The study also reinforces the connection between nerve dysfunction, impaired signal transmission, and the severity of neuropathy. Similarly, a study by Haque et al.[13] compares clinical and electrophysiological findings, including nerve conduction amplitudes and vibratory perception threshold (VPT) scores, in diagnosing diabetic polyneuropathy. It emphasizes the decline in NCS parameters among individuals with neuropathy, further underscoring the utility of NCS in assessing the extent of nerve dysfunction.
The demographic analysis of the study sample [Table 1] revealed no statistically significant differences between the neuropathic and non-neuropathic groups in terms of age, height, weight, and BMI, suggesting that these factors did not confound the observed outcomes related to neuropathy. This indicates that the differences in neuropathy-related outcomes are not influenced by these demographic variables. The duration of diabetes among participants varied considerably, with a range of 1–32 years. This wide range is clinically relevant, as the progression of diabetic neuropathy (DPN) is often related to the length of time a person has had diabetes. Participants with longer diabetes duration are more likely to exhibit neuropathic complications, and the variability in duration likely contributes to the spectrum of neuropathy severity observed in the study.[14,15]
The normative mean radial sensory amplitude for healthy adults in our laboratory was 26.3 μV with a standard deviation of ± 9.2 μV whereas the normative mean sural sensory amplitude for healthy adults was 19.1 μV with a standard deviation of ± 9.9 μV. Similarly, the normative mean dorsal sural sensory amplitude for healthy adults, as found in our laboratory, was 6.59 μV with a standard deviation of ± 2.9 μV. We calculate the DSRAR and SRAR among normative. The DSRAR (0.27) and SRAR (0.68) among VPT < 15 are in line with the normative data.
In our study, we observed that dorsal sural SNAPs were absent in 114 nerves in the setting of preserved sural SNAPs. This dissociation may indicate that neuropathy begins in the most distal nerve fibers, affecting the dorsal sural nerve earlier than the sural nerve due to its anatomical position, hence making it more susceptible to early length-dependent neurodegenerative changes seen in diabetic patients. In the subgroup with preserved sural SNAPs (n = 83) but absent dorsal sural SNAPs, the mean sural amplitude was 11.3 μV and the mean SRAR was 0.60. This pattern suggests that even when sural nerve function appears intact, the loss of dorsal sural responses could serve as an early marker of neuropathy. Analyzing and comparing the diagnostic utility of SRAR and DSRAR in this context could provide valuable insights into the early detection of neuropathic changes, particularly in the distal nerves.
In non-neuropathic patients, 17 nerves showed absent sural SNAPs despite a mean VPT of 9.42 and a mean MNSI of 7.47, both of which are within normal limits. Similarly, 34 nerves exhibited absent dorsal sural SNAPs, with a mean VPT of 10.92 and a mean MNSI of 8.52—again falling within the normal range. In these cases, the absence of sural and dorsal sural SNAPs may indicate early small-fiber neuropathy, which standard assessments like VPT (primarily evaluating large-fiber function) and MNSI (comprising a questionnaire and physical examination) might not detect. Alternatively, these findings could also result from technical errors during data collection.
The findings [Table 2] are significant as they reflect the underlying pathophysiology of diabetic neuropathy, where progressive damage to nerve fibers results in impaired sensory signal transmission. The lower amplitudes in the neuropathic group suggest that nerve fibers have undergone significant degeneration, impairing their ability to conduct electrical signals. The statistical significance [Figure 1] of these differences underscores the clinical utility of NCS in diagnosing diabetic neuropathy. Specifically, the reduction in nerve amplitudes serves as a quantifiable marker of nerve dysfunction, correlating with the severity of neuropathic symptoms. Statistical comparisons between the two groups indicate that these differences in amplitude measurements are clinically significant and statistically significant, highlighting the deleterious effects of neuropathy on nerve conduction parameters. Such findings underscore the importance of utilizing NCS parameters in the diagnostic evaluation of diabetic neuropathy, as they reflect underlying physiological changes associated with the condition. The reduction in amplitude values among participants with neuropathy may correlate with the severity of sensory dysfunction, thereby serving as critical indicators for both diagnosis and ongoing patient assessment.
Rutkove et al. explored the diagnostic utility of the SRAR in identifying mild axonal polyneuropathy.[7] The SRAR, calculated as the sural SNAP amplitude divided by the radial SNAP amplitude, is particularly valuable in detecting early or subclinical axonal, length-dependent peripheral neuropathy, even when the age-adjusted sural SNAP amplitude remains within normal limits. Since sural and radial SNAP amplitudes exhibit a significant correlation, early-stage length-dependent neuropathy typically reduces the sural SNAP amplitude before affecting the radial SNAP, thereby lowering the SRAR. However, there is limited reference data establishing the lower limit of normal SRAR values. Previous studies, such as those by Overbeek et al. and Esper et al., have proposed diagnostic thresholds for SRAR ranging from 0.21 to 0.4.[16,17] Similarly, Pastore et al. evaluated various electrophysiological parameters, including nerve conduction studies, to determine the most effective tools for detecting early-stage diabetic neuropathy. Their findings underscored the importance of tests like sural SNAP amplitude and conduction velocity in identifying subclinical neuropathy before the onset of clinical symptoms.[18] In a related study, Zis et al. found that reduced sensory and motor nerve action potential amplitudes were significant indicators of disease progression, whereas conduction velocities showed less correlation with severity. These findings highlighted the critical role of amplitude measurements in assessing nerve fiber loss and provided valuable insights into the relationship between electrophysiological changes and clinical symptoms, aiding in the stratification of neuropathy severity.[19]
The mean SRAR in participants without neuropathy was significantly higher than in those with neuropathy, with a P-value of 0.0002. The DSRAR followed a similar pattern with a P-value of 0.0001. The results suggest that lower SRAR and DSRAR values are associated with more advanced nerve damage and greater sensory dysfunction, reinforcing their potential as non-invasive diagnostic markers. Mansukhani et al.[20] emphasized the significance of understanding population-specific variations in the SRAR, given its diagnostic value in detecting early axonal, length-dependent peripheral neuropathies. Their study provided age-stratified and overall reference limits for SRAR in the Indian population, addressing the scarcity of data on SRAR norms within this demographic. Similarly, Anandhanarayanan et al.[21] explored the application of nerve amplitude ratios, specifically SRAR, in diagnosing diabetic neuropathy. Their findings highlighted a consistent decline in amplitude ratios among patients with neuropathy, underscoring their role as reliable markers of nerve degeneration. In addition, Singh et al. reviewed various diagnostic tools for diabetic neuropathy, focusing on nerve conduction parameters such as SRAR and DSRAR. Their analysis reinforced the clinical utility of these metrics in detecting and quantifying the severity of nerve damage.[22]
In our study, the ROC analysis revealed an AUC of 0.692 for SRAR and 0.900 for DSRAR [Figure 4], indicating that both measures demonstrate good diagnostic accuracy. The substantially higher AUC for DSRAR suggests that it provides superior discriminative ability in differentiating neuropathic from non-neuropathic cases. The contingency table [Table 3] provides important insights into the diagnostic accuracy of SRAR and DSRAR for identifying neuropathy. The cutoff value for SRAR (0.59) yielded a sensitivity of 68.97% and a specificity of 62.16%, indicating that while SRAR is moderately effective in distinguishing neuropathic from non-neuropathic individuals, its diagnostic performance is not optimal, especially with an NPV of only 71.88%. This suggests that SRAR, while useful, may not reliably exclude the presence of neuropathy when results are negative.
In contrast, DSRAR demonstrated superior diagnostic performance, with a sensitivity of 83.72% and a specificity of 86.36% at the cut-off value of 0.26. The AUC for DSRAR was 0.900, indicating excellent accuracy in distinguishing between participants with and without neuropathy. Furthermore, the NPV of 84.44% suggests that a negative DSRAR result effectively rules out the presence of neuropathy in most cases, while the PPV of 85.71% indicates a high likelihood that individuals with a positive DSRAR result indeed have neuropathy. The results indicated that the DSRAR remained an independent predictor of neuropathy.
Clinical implications
The findings of this study have important clinical implications for the diagnosis and management of diabetic neuropathy. The reduction in sensory nerve amplitudes, combined with the diagnostic utility of SRAR and DSRAR, underscores the need for early and accurate detection of neuropathy in diabetic patients. The use of DSRAR, in particular, may enhance clinicians’ ability to identify patients at risk of neuropathy, allowing for earlier interventions to slow disease progression. In addition, the moderate performance of SRAR suggests that it may be useful as part of a broader diagnostic toolkit, particularly when combined with other assessments such as NCS or VPT.
The significant association between reduced SRAR and DSRAR values and elevated VPT readings further supports the role of these ratios in detecting early nerve damage. Given that diabetic neuropathy often remains asymptomatic in its early stages, the ability to detect subclinical neuropathy using these ratios could lead to better outcomes for patients by enabling timely management strategies, such as glycemic control and lifestyle modifications aimed at preserving nerve function.
Limitations of our study
Our study’s limited sample size and cross-sectional design may restrict generalizability and prevent insights into neuropathy progression. Confounding factors such as uncontrolled glucose levels and comorbidities could also affect results, as the study focuses solely on diabetic neuropathy. In addition, limited ethnic diversity may impact the applicability of SRAR and DSRAR cut-offs across populations. Reliance on amplitude ratios alone suggests that future studies should incorporate additional parameters, such as conduction velocity, for a more comprehensive assessment. We also used VPT as an operational definition of neuropathy, whereas VPT is affected by large fiber neuropathy, which is seen in the advanced stage. As several sural and dorsal nerves were unexcitable, the effective size of the cohort was markedly reduced.
CONCLUSION
This study demonstrates the clinical utility of sensory NCS parameters, SRAR, and DSRAR in the diagnosis of diabetic neuropathy. The findings suggest that DSRAR, in particular, holds promise as a reliable and accurate diagnostic tool. Further research should focus on refining cut-off values and exploring the use of these ratios in diverse populations, including those from different ethnic backgrounds, to improve their generalizability and applicability in clinical practice.
Ethical approval:
The research/study was approved by the Institutional Review Board at All India Institute of Medical Sciences, Kalyani, number IEC/AIIMS/Kalyani/Meeting/2023/029, dated April 12, 2023.
Declaration of patient consent:
The authors certify that they have obtained all appropriate patient consent.
Conflicts of interest:
There are no conflicts of interest.
Use of artificial intelligence (AI)-assisted technology for manuscript preparation:
The authors confirm that there was no use of artificial intelligence (AI)-assisted technology for assisting in the writing or editing of the manuscript and no images were manipulated using AI.
Financial support and sponsorship: Nil.
References
- Towards prevention of diabetic peripheral neuropathy: Clinical presentation, pathogenesis, and new treatments. Lancet Neurol. 2022;21:922-36.
- [CrossRef] [PubMed] [Google Scholar]
- The prevalence by staged severity of various types of diabetic neuropathy, retinopathy, and nephropathy in a population-based cohort: The Rochester diabetic neuropathy study. Neurology. 1993;43:817-24.
- [CrossRef] [PubMed] [Google Scholar]
- Diabetic neuropathy: A position statement by the American Diabetes Association. Diabetes Care. 2017;40:136-54.
- [CrossRef] [PubMed] [Google Scholar]
- Diagnostic approach to peripheral neuropathy. Ann Indian Acad Neurol. 2008;11:89-97.
- [CrossRef] [PubMed] [Google Scholar]
- Dorsal sural sensory nerve action potential: A study for reference values. Ann Indian Acad Neurol. 2017;20:127-31.
- [CrossRef] [PubMed] [Google Scholar]
- Neurophysiological examination of dorsal sural nerve. Muscle Nerve. 2012;46:895-8.
- [CrossRef] [PubMed] [Google Scholar]
- Sural/radial amplitude ratio in the diagnosis of mild axonal polyneuropathy. Muscle Nerve. 1997;20:1236-41.
- [CrossRef] [Google Scholar]
- Diabetic neuropathies: A statement by the American Diabetes Association. Diabetes Care. 2005;28:956-62.
- [CrossRef] [PubMed] [Google Scholar]
- A comparison of the new indicator test for sudomotor function (Neuropad) with the vibration perception threshold and the clinical examination in the diagnosis of peripheral neuropathy in subjects with type 2 diabetes. Exp Clin Endocrinol Diabetes. 2008;116:135-8.
- [CrossRef] [PubMed] [Google Scholar]
- Comparison of vibration perception thresholds obtained with the neurothesiometer and the CASE IV and relationship to nerve conduction studies. Diabet Med. 2002;19:661-6.
- [CrossRef] [PubMed] [Google Scholar]
- The prediction of diabetic neuropathic foot ulceration using vibration perception thresholds. A prospective study. Diabetes Care. 1994;17:557-60.
- [CrossRef] [PubMed] [Google Scholar]
- Association of sensory nerve action potential amplitude and velocity with type 2 diabetic peripheral neuropathy. Cureus. 2023;15:e46501.
- [CrossRef] [Google Scholar]
- Performance analysis of noninvasive electrophysiological methods for the assessment of diabetic sensorimotor polyneuropathy in clinical research: A systematic review and meta-analysis with trial sequential analysis. Sci Rep. 2020;10:21770.
- [CrossRef] [PubMed] [Google Scholar]
- Prevalence and impact of chronic pain in the diabetic population: Results from a large nationwide study. Diabetes Care. 2009;32:1457-62.
- [Google Scholar]
- The association between duration of diabetes and diabetic peripheral neuropathy: A cross-sectional study. J Diabetes Metab Disord. 2019;18:173-8.
- [Google Scholar]
- Sural/radial nerve amplitude ratio: Reference values in healthy subjects. Muscle Nerve. 2005;32:613-8.
- [CrossRef] [PubMed] [Google Scholar]
- Sural and radial sensory responses in healthy adults: Diagnostic implications for polyneuropathy. Muscle Nerve. 2005;31:628-32.
- [CrossRef] [PubMed] [Google Scholar]
- A comparison of electrophysiological tests for the early diagnosis of diabetic neuropathy. Muscle Nerve. 1999;22:1667-73.
- [CrossRef] [Google Scholar]
- Electrophysiological determinants of the clinical severity of axonal peripheral neuropathy. Muscle Nerve. 2019;59:491-3.
- [CrossRef] [PubMed] [Google Scholar]
- Sural radial amplitude ratio: A study in healthy Indian subjects. Ann Indian Acad Neurol. 2020;23:255-60.
- [CrossRef] [PubMed] [Google Scholar]
- Diabetic neuropathies In: Feingold KR, Anawalt B, Blackman MR, eds. Endotext. South Dartmouth, MA: MDText.com, Inc.; 2000. Available from: https://www.ncbi.nlm.nih.gov/books/nbk279175 [Last accessed on 2022 Mar 15]
- [Google Scholar]
- Pathophysiology and diagnosis of diabetic peripheral neuropathy: Clinical and electrophysiological findings. Can J Diabetes. 2003;27:382-91.
- [Google Scholar]


