
Translate this page into:
Accuracy of clinical stroke scores for distinguishing stroke subtypes in resource poor settings: A systematic review of diagnostic test accuracy
Address for correspondence: Dr. Clifford C. Mwita, Thika Level-5 Hospital, PO Box 227, Thika, Kenya. E-mail: cliffmwita@gmail.com
This is an open-access article distributed under the terms of the Creative Commons Attribution-Noncommercial-Share Alike 3.0 Unported, which permits unrestricted use, distribution, and reproduction in any medium, provided the original work is properly cited.
This article was originally published by Medknow Publications & Media Pvt Ltd and was migrated to Scientific Scholar after the change of Publisher.
Abstract
Background:
Stroke is the second leading cause of death globally. Computerized tomography is used to distinguish between ischemic and hemorrhagic subtypes, but it is expensive and unavailable in low and middle income countries. Clinical stroke scores are proposed to differentiate between stroke subtypes but their reliability is unknown.
Materials and Methods:
We searched online databases for studies written in English and identified articles using predefined criteria. We considered studies in which the Siriraj, Guy's Hospital, Besson and Greek stroke scores were compared to computerized tomography as the reference standard. We calculated the pooled sensitivity and specificity of the clinical stroke scores using a bivariate mixed effects binomial regression model.
Results:
In meta-analysis, sensitivity and specificity for the Siriraj stroke score, were 0.69 (95% CI 0.62-0.75) and 0.83 (95% CI 0.75-0.88) for ischemic stroke and 0.65 (95% CI 0.56-0.73) and 0.88 (95% CI 0.83-0.91) for hemorrhagic stroke. For the Guy's hospital stroke score overall sensitivity and specificity were 0.70 (95% CI 0.53-0.83) and 0.79 (95% CI 0.68-0.87) for ischemic stroke and 0.54 (95% CI 0.42-0.66) and 0.89 (95% CI 0.83-0.94) for hemorrhagic stroke.
Conclusions:
Clinical stroke scores are not accurate enough for use in clinical or epidemiological settings. Computerized tomography is recommended for differentiating stroke subtypes. Larger studies using different patient populations are required for validation of clinical stroke scores.
Keywords
Besson score
Guy's hospital stroke score
Greek stroke score
Siriraj stroke score
stroke

Introduction
Stroke is the second leading cause of death globally and is associated with up to 5.54 million deaths every year, two thirds of which occur in resource poor countries (RPC).[1] It has two main subtypes, ischemic and hemorrhagic. For optimal management, a distinction must be made between the subtypes since the therapy is different.[2] Ischemic stroke warrants institution of thrombolytic and/or antiplatelet therapy while in hemorrhagic stroke, hemostatic therapy may be given.[3] Ideally, either thrombolytic or hemostatic therapy should be given soon after the onset of stroke in order to improve outcome.[4]
Non-contrast computed tomography (CT) scan is the gold standard for distinguishing stroke sub-types.[56] It is cheaper than magnetic resonance imaging (MRI), but is still expensive and inaccessible for most resource poor settings. To overcome these difficulties and to enhance clinical bedside diagnosis, clinical stroke scores have been developed. The most commonly used ones include the Guy's hospital score (GHSS),[7] the Besson score,[8] the Greek stroke score[9] and the Siriraj stroke score (SSS).[10] In developing these scores, clinical variables that could potentially distinguish ischemia from hemorrhage in patients with acute stroke were used.
While these scores are not more accurate than neuro-imaging, they are simple, cheap and practical. However, their true accuracy and value in the diagnosis of stroke in resource poor settings remains unknown. We report a systematic review examining the evidence on the accuracy of clinical stroke scores in distinguishing between stroke subtypes, particularly within low and middle income countries (LAMICs).
Materials and Methods
Search strategy
We searched the following databases for both published and unpublished studies in the English language over the period 1983-2013: PubMed, EMBASE, Cochrane central register of controlled trials (CENTRAL), Cumulative Index to Nursing and Allied Health Literature (CINAHL), Web of Science, Virtual health library, System for Information on Grey literature in Europe (SIGLE), Scientific Electronic Library Online (SciELO), MedNar and ProQuest. The following terms were used to generate a search: Stroke, Acute stroke, Brain ischemia, Cerebral hemorrhage, Cerebral infarction, Siriraj stroke score, Clinical stroke score, Guy's hospital stroke score, Allen score, Besson score, Greek stroke score.
Inclusion and exclusion criteria
We considered studies of diagnostic test accuracy from LAMICs that included patients admitted to hospital with a diagnosis of acute stroke according to the WHO criteria[2] and in which the index tests (Siriraj, Guy's Hospital, Besson and Greek stroke scores) and reference test (CT-Scan) were interpreted independently of one another on the same group of participants. Table 1 provides more details on each score. Due to a difference in the prevalence of hemorrhagic stroke and stroke risk factors,[1112] we did not consider studies from high income countries (HICs). Details on the calculation of test scores have been described previously.[78910] Studies that evaluated two or more of these scores simultaneously were also included. Only studies that reported on the sensitivity and specificity of stroke scores compared to CT scan diagnosis were included however, studies that did not report on sensitivity and specificity but had sufficient information to calculate these were also considered.

Assessment of methodological quality
Papers selected for review were assessed independently for methodological validity prior to inclusion in the review using the Quality Assessment of Diagnostic Accuracy Studies (QUADAS) criteria. Disagreements were resolved through discussion. We considered a representative spectrum of patients to be female or male patients of all ages presenting with mild, moderate or severe stroke symptoms, with or without a previous history of stroke. In the assessment of disease progression bias, 15 days was considered an appropriate period between onset of stroke and administration of the reference standard. This period helps to avoid interpreting resolving hemorrhages as infarcts and accommodates the lack of the sensitivity of CT scan in early ischemic stroke.
Data extraction
A data extraction form was designed and used to collect details from included studies. For each study, the following data were obtained: Author information, year of publication, study site, setting, study design, number and characteristics of patients (age, sex, ethnicity), reference standard, index test (s), information on clinicians who administered scores and clinicians who interpreted the reference standard i.e. background specialty. Sensitivity and specificity, number of patients with equivocal scores, true positive (TP), false positive (FP), true negative (TN) and false negative (FN) data for each test were taken directly from source papers. If this was not possible, they were calculated from provided data. Extracted data was then entered in a separate form and transferred to a spreadsheet.
Data synthesis
We derived indices of diagnostic performance from the data presented in each study for each index test. We constructed 2 × 2 contingency tables of true positive, false positive, false negative and true negative cases with CT scan as the independent variable and index test as the dependent variable and calculated sensitivity and specificity with 95% confidence interval (95% CI) for each stroke score in each study. However, since exclusion of indeterminate test results may result in overestimation of accuracy, we included equivocal test results in our calculations where these were reported. Because ischemic and hemorrhagic stroke have different management strategies we tabulated results for ischemic stroke separately from those for hemorrhagic stroke for each index test and generated separate forest plots of test performance for ischemic and hemorrhagic strokes.
Since included studies had a similar spectrum of patients and the threshold value used for the index tests was the same in all the studies, we performed a meta-analysis of the index test results using a bivariate mixed effects binomial regression model. Summary estimates for sensitivity, specificity, positive and negative likelihood ratios (LR) as well as diagnostic odds ratio were generated. Positive and negative predictive values were not calculated since they are dependent on prevalence of stroke subtypes which was different across included studies. We assessed heterogeneity graphically using forest plots and statistically using the quantity I2 . Analysis was performed on STATA v11.0 (Stata Corp., TX) using the ‘midas’ command and Review Manager Software version 5.[13]
Results
Study selection
A total of 115 relevant papers were identified in the literature search of which 39 were retrieved for further examination. Three papers were retrieved from additional sources. Of the 42 papers retrieved for detailed examination, 22 were excluded and 20 papers were included in the review. Figure 1 outlines the study selection process.
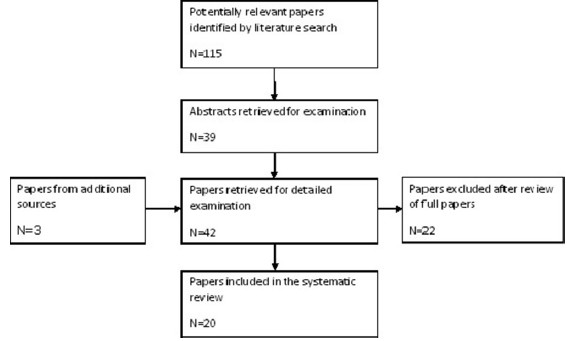
- Flow diagram of study selection
Characteristics of included studies
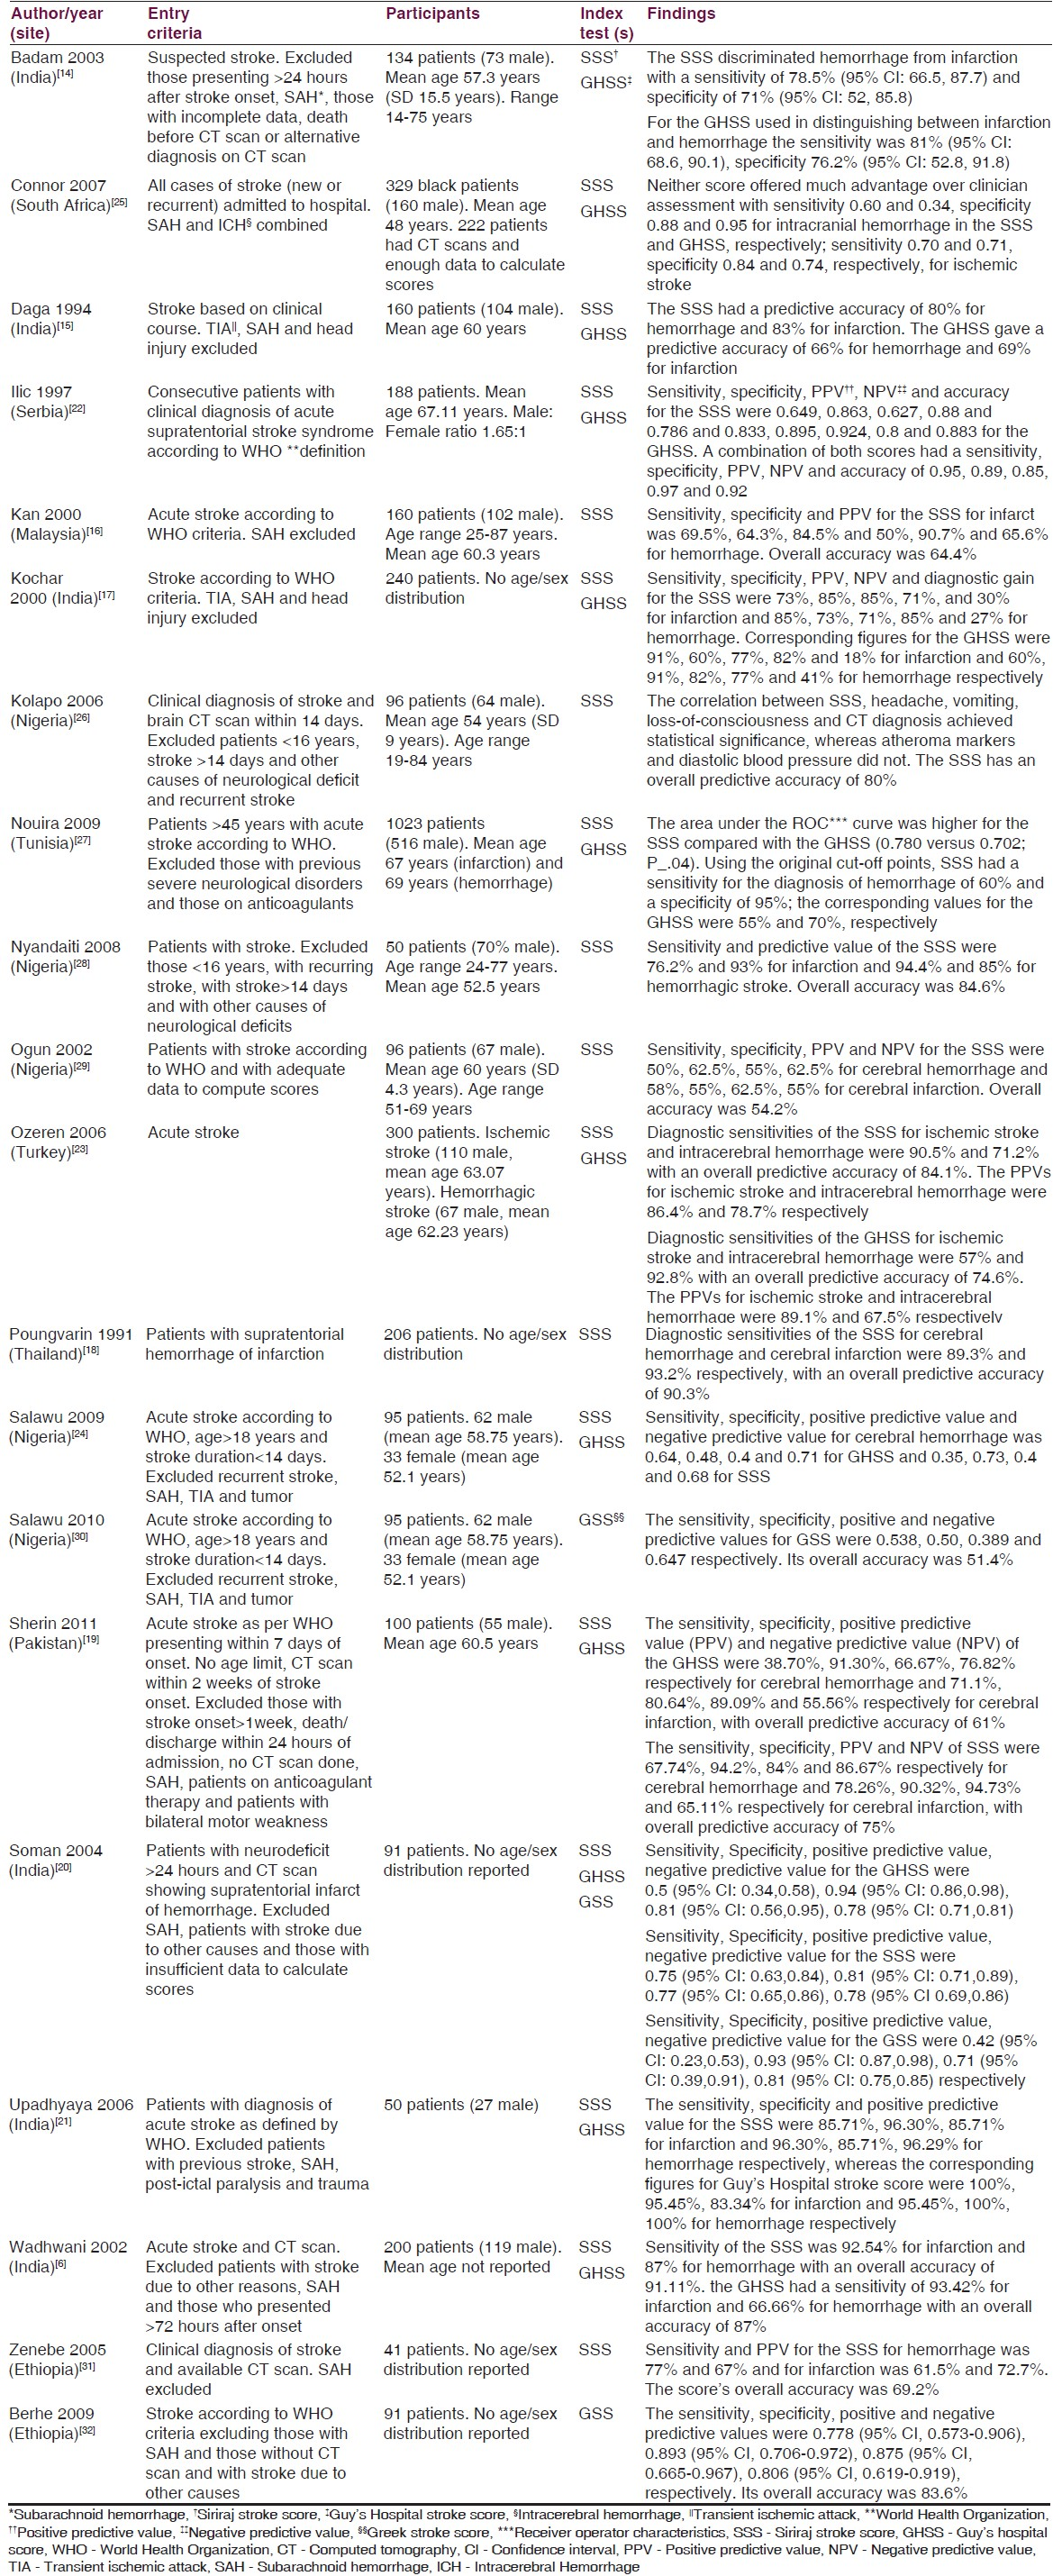
Included studies were hospital-based diagnostic test accuracy studies conducted within a 20 year period (1991-2011) in Asia,[61415161718192021] Eastern Europe[2223] and Africa[242526272829303132] (including north Africa.[27] ) The aim in each study was evaluating the diagnostic performance of the index tests (SSS, GHSS and GSS) in distinguishing stroke sub-types among patients with acute stroke. CT scan was the documented reference standard in most studies. The SSS was evaluated in 18 studies while the GHSS was evaluated in 11 studies. The GSS was evaluated in three studies. No study evaluated the BS.
Two studies[2931] were retrospective in design while the rest were prospective studies. The patient spectrum was mainly adult patients with acute stroke. In a number of studies, patients were only included if they had a CT scan performed. Reasons for lack of CT scan in patients who did not have the investigation were not elaborated in most studies. Further, many studies did not report characteristics of excluded patients for comparison with those included.
Overall, a total of 3638 patients from LAMICs were evaluated. Participants were of age range 14-87 years. Only two studies reported the severity of stroke among included patients.[1425] Prevalence of hemorrhagic stroke (including SAH) ranged from 17.3% to 68.9% (median prevalence 37.85%; IQR 30.25%-48.76%) while prevalence of ischemic stroke ranged from 31% to 82.7% (median prevalence 58.75%; IQR 52.82%-68.5%). In five studies[1417222730] equivocal results were excluded from the estimation of diagnostic performance of the index tests.
The main outcomes reported in the studies were test sensitivity and specificity. However, positive and negative predictive values as well as likelihood ratios were reported in a number of studies. About half of the studies recommended the scores for use in the absence of CT scan for both clinical and epidemiological studies. Overall, the studies recommend larger and better designed studies for validation of the scores in addition to refining them. Table 2 presents a summary of the characteristics of included studies.
Methodological quality of included studies
Overall, studies included in the review were of sound quality despite incomplete reporting in some of them. Spectrum bias, disease progression bias, partial verification bias, differential verification bias and incorporation bias were adequately minimized. Blinding of index test and reference standard results was poorly reported across studies. All studies reported indeterminate results although not all of them included these results in the assessment of test performance.
Meta-analysis results
Accuracy of the Siriraj stroke score
Sensitivity of the test for ischemic stroke ranged from 0.30 to 0.85 while specificity ranged from 0.36 to 0.97. Overall, sensitivity for the test was 0.69 (95% CI 0.62-0.75) and specificity was 0.83 (95% CI 0.75-0.88) for ischemic stroke. There was significant statistical heterogeneity observed (I2 = 90.25 for sensitivity and I2 = 86.30 for specificity). The positive likelihood ratio (+LR) was 4 (95% CI 2.7-5.8) while the negative likelihood ratio (-LR) was 0.38 (95% CI 0.31-0.47).The test's diagnostic odds ratio (DOR) was 10 (95% CI 6-17).
Sensitivity for hemorrhagic stroke ranged from 0.33 to 0.87 while specificity ranged from 0.65 to 0.99. Overall, sensitivity for the test was 0.65 (95% CI 0.56-0.73) and specificity was 0.88 (95% CI 0.83-0.91) for hemorrhagic stroke. There was substantial heterogeneity observed (I2 = 86.35 for sensitivity and I2 = 83.86 for specificity). The +LR was 5.2 (95% CI 3.5-7.7) while the –LR was 0.40 (95% CI 0.31-0.51).The test's DOR was 13 (95% CI 7-23). Figures 2 and 3 show forest plots of sensitivity and specificity for the SSS for both ischemic and hemorrhagic stroke respectively for included studies from LAMICs.
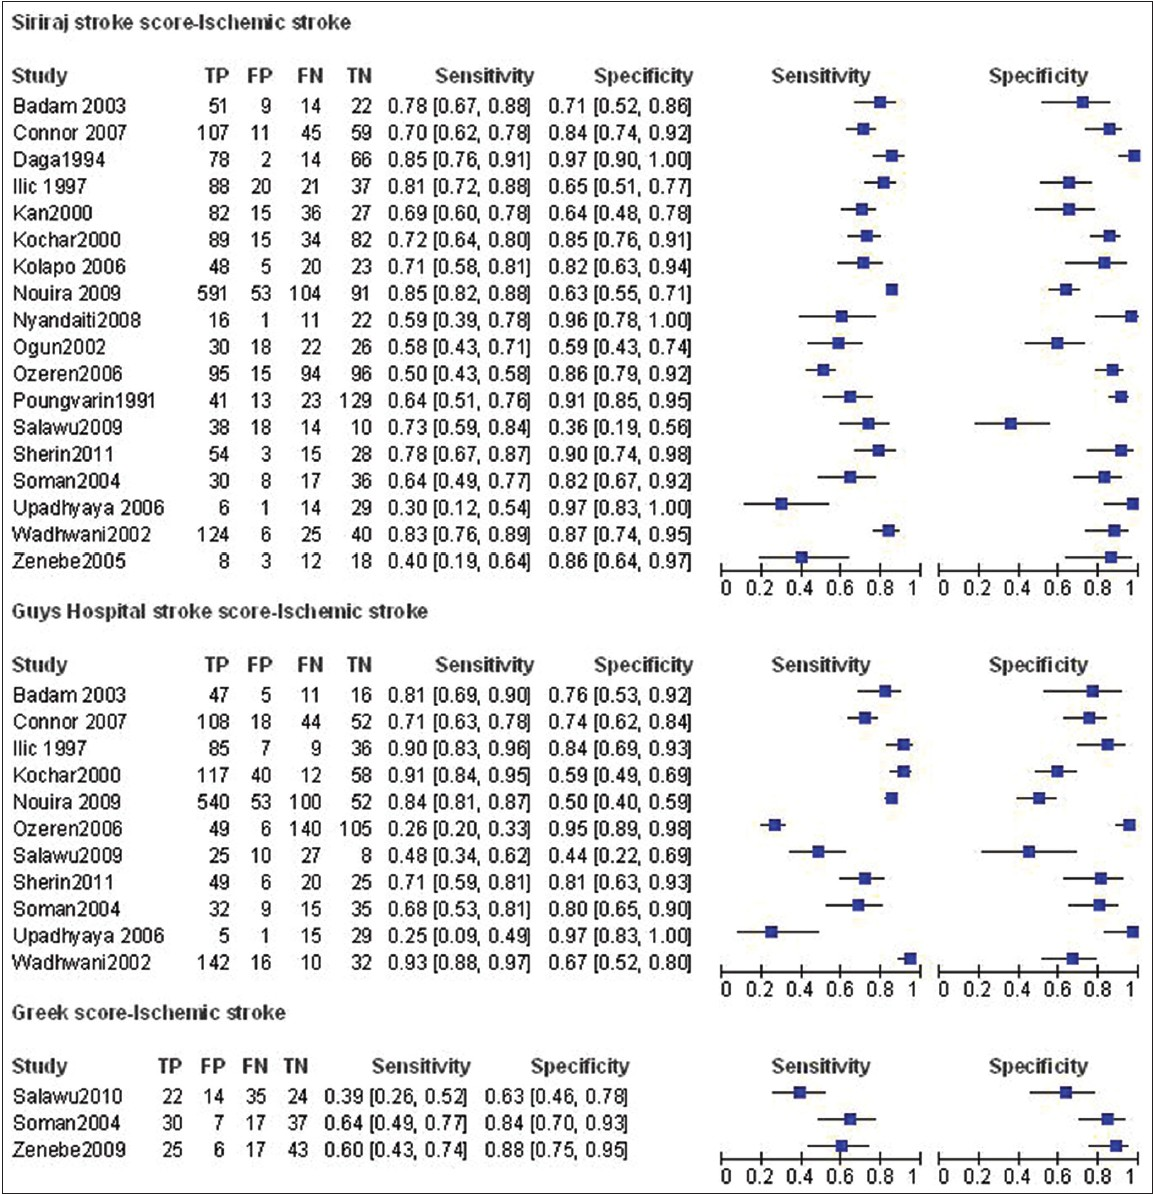
- Coupled forest plots of sensitivity and specificity for stroke scores for studies from LAMICs (Ischemic stroke)

- Coupled forest plots of sensitivity and specificity for stroke scores for studies from LAMICs (Hemorrhagic stroke)
Accuracy of the Guys hospital stroke score
Sensitivity for ischemic stroke ranged from 0.25 to 0.93 while specificity ranged from 0.50 to 0.97. Overall, sensitivity for the test was 0.7 (95% CI 0.53-0.83) and specificity was 0.79 (95% CI 0.68-0.87) for ischemic stroke. There was significant heterogeneity observed (I2 = 97.33 for sensitivity and I2 = 89.23 for specificity). The +LR was 3.4 (95% CI 2.4-4.7) while the -LR was 0.38 (95% CI 0.25-0.58). The DOR was 9 with a 95% CI of 5-15.
Sensitivity for hemorrhagic stroke ranged from 0.20 to 0.84 while specificity ranged from 0.48 to 1.00. Overall, sensitivity for the test was 0.54 (95% CI 0.42-0.66) and specificity was 0.89 specific (95% CI 0.83-0.94) for hemorrhagic stroke. There was significant heterogeneity observed (I2 = 86.69 for sensitivity and I2 = 90.92 for specificity). The + LR was 5.2 (95% CI 3.2-8.4) while the -LR was 0.51 (95% CI 0.40-0.66). The DOR was 10 (95% CI 5-19). Figures 2 and 3 show forest plots of sensitivity and specificity for the GHSS for both ischemic and hemorrhagic stroke for included studies from LAMICs.
Accuracy of the Greek stroke score
Statistical pooling of results was not undertaken due to the small number of studies evaluating this test. Sensitivity for ischemic stroke ranged from 0.39 to 0.64 while specificity ranged from 0.63 to 0.88. Sensitivity for hemorrhagic stroke ranged from 0.11 to 0.44 while specificity ranged from 0.63 to 0.96. There was graphical heterogeneity observed. Figures 2 and 3 show forest plots of sensitivity and specificity for the GSS for both ischemic and hemorrhagic stroke for included studies from LAMICs.
Discussion
Adequate management of acute stroke requires early distinction of ischemic stroke from hemorrhagic stroke. Before starting anticoagulant, antiplatelet or thrombolytic therapy for ischemic stroke, hemorrhagic stroke must be accurately ruled out. CT scan is sensitive for hemorrhagic stroke while MRI has been shown to have high sensitivity for early ischemic stroke.[3334] However, both are expensive and unavailable in resource poor settings.[11]
We identified 18 studies that validated the SSS in LAMICs from Africa, Asia and Eastern Europe. Only about half of these recommended the score for either clinical or epidemiological use. Overall, we found the test to have a sensitivity of 0.63 (95% CI 0.54-0.72) and specificity of 0.88 (95% CI 0.82-0.91) for hemorrhagic stroke. Since the exclusion of hemorrhage in patients with acute stroke is important before starting anticoagulant therapy for those with ischemic stroke, the SSS is not sufficiently sensitive to exclude hemorrhage. Also, the likelihood ratios for the test for hemorrhagic stroke show that it only very minimally changes the post-test probability of having hemorrhage. Further, in order to be sufficiently sure of the presence of ischemic stroke to guide on management, the clinical score needs to be specific enough to rule in ischemia. The SSS has a specificity of 0.82 (95% CI 0.74-0.88) for ischemic stroke and a positive likelihood ratio of 3.9 (95% CI 3.4-7.7). These estimates suggest that the score is not accurate enough for clinical or epidemiological use.
The poor accuracy of the SSS in LAMICs may be attributable to various factors. First, most studies had small sample sizes. Secondly, the SSS was developed in a country with a very high prevalence of hemorrhagic stroke relative to other countries and thus its accuracy may differ from its initial validation result. The inclusion of equivocal test results in our calculations may also explain the poor accuracy. However, this inclusion is necessary so as to give a true picture of the test's accuracy.
The Guy's hospital stroke score was developed on a predominantly young population which is known to have a higher prevalence of hemorrhagic stroke compared to an older population. The authors did not endorse its use for clinical management but suggested it may be used for epidemiological studies. The score has been validated in LAMICs with differing conclusions. In this review, 11 studies evaluated the GHSS. Specificity for ischemic stroke was 0.76 (95% CI 0.64-0.85) with a positive likelihood ratio of 2.9 (95% CI 2.2-3.9). These estimates are not sufficient enough to confirm ischemic stroke and commence anticoagulant therapy. Sensitivity for hemorrhagic stroke was 0.49 (95% CI 0.38-0.61) which shows poor accuracy for ruling out hemorrhage. In addition to its poor diagnostic accuracy, the GHSS is cumbersome and may not be practical in resource poor settings.
Three studies from LAMICs evaluated the Greek score and due to this small number, we did not include them in meta-analysis. The score was developed in Greece and is simple to use. It was found to be very accurate in its initial validation study. Overall, the score showed poor diagnostic performance in this review. It is probable that the higher prevalence of hemorrhagic stroke in resource poor settings affected its accuracy.
We found a high prevalence of hemorrhagic stroke among studies from LAMICs included in this review (median prevalence 37.85%; IQR 30.25%-48.76%). This is in keeping with other reports of higher prevalence of hemorrhagic stroke in patients from poorer countries.[1112] One author attributes this to inadequate control of blood pressure as well as a high occurrence of aneurysms and arteriovenous malformations in poorer countries.[11] Another author suggests that the dramatic presentation of hemorrhagic stroke inclines clinicians to request for CT scan hence the higher prevalence.[12] We propose that both scenarios may contribute.
Our review has various strengths. Firstly, the included studies had an appropriate spectrum of patients. Secondly, in all the included studies, the stroke scores and reference standards were performed on the same patient population and the whole sample received verification with the reference standard. Thus, partial verification bias and differential verification bias were adequately avoided. Thirdly, the time between administration of stroke scores and reference standards was short enough to avoid disease progression bias. In our estimation of diagnostic performance indices, we included equivocal test scores so as to avoid bias in the estimates.
There were a number of weaknesses. First, there was poor reporting of blinding across all studies, thus the bias attributable to this could not be determined. Secondly, included studies may have had selection bias as some studies excluded patients without CT scan results. While reasons for this exclusion were not elaborated in a majority of the reports, it is possible that in LAMICs, cost of CT scan was a hindrance to access as was shown in one of the studies.[26] Thirdly, a majority of studies did not report on the severity of stroke among included patients. This is of particular interest since the scores' performance may vary with stroke severity. Finally, some causes of stroke e.g. sickle cell disease and rheumatic heart disease are of significance in the pediatric age group.[11] However, no study assessed the utility of the scores in this group.
In conclusion, we do not find the SSS, GHSS and GSS to be of sufficient accuracy to warrant routine use (clinical or epidemiological). The GHSS is cumbersome and may not be practical in resource poor settings. While the GSS is simple to use, few studies from around the globe have evaluated it. The SSS has been widely validated but it may need to be modified to suit different populations. We recommend the continued use of CT scan for differentiating stroke subtypes in the absence of a sufficiently accurate clinical stroke score and advice on investment in neuroimaging equipment for use in resource poor settings. Further, larger studies in which the cost of CT scan does not influence patient selection are required for validation of the SSS, GHSS and GSS especially in resource poor countries. Newer scores using patient populations from each region may be warranted.
Acknowledgements
We are grateful to the Joanna Briggs Institute for the support rendered during the conduct of this review. In particular, we thank Dr. Sarahlouise White for her help in shaping the review protocol and also for retrieving some articles. Much gratitude also goes to Dr. Shauna Runchey (University of Washington) for her help in retrieving some missing papers and for commenting on the draft. Charles Newton holds a Wellcome Trust Career post in Clinical Tropical Medicine (No. 083744).
Source of Support: Nil.
Conflict of Interest: None declared.
References
- WHO: The World Health Report 2004.Changing history. The world health report 2004 (Statistical annex) 2004
- [Google Scholar]
- WHO: Stroke. In: Neurological Disorders: Public Health Challenges. Geneva: WHO Press; 2006. p. :151-62.
- [Google Scholar]
- The acute management of intracerebral hemorrhage: A clinical review. Anesth Analg. 2010;110:1419-27.
- [Google Scholar]
- Boon NA, Colledge NR, Walker BR, Hunter JA, eds. Davidson's Principles and Practice of Medicine (20th ed). Philadelphia: Elsevier; 2006. p. :1200.
- Value of computed tomography in patients with stroke: Oxfordshire Community Stroke Project. Br Med J (Clin Res Ed). 1985;290:193-7.
- [Google Scholar]
- Nature of lesion in cerebrovascular stroke patients: Clinical stroke score and computed tomography scan brain correlation. J Assoc Physicians India. 2002;50:777-81.
- [Google Scholar]
- Is it clinically possible to distinguish nonhemorrhagic infarct from hemorrhagic stroke? Stroke. 1995;26:1205-9.
- [Google Scholar]
- A new classification tool for clinical differentiation between haemorrhagic and ischaemic stroke. J Intern Med. 2002;252:121-9.
- [Google Scholar]
- Siriraj stroke score and validation study to distinguish supratentorial intracerebral haemorrhage from infarction. BMJ. 1991;302:1565-7.
- [Google Scholar]
- Acute treatment and long-term management of stroke in developing countries. Lancet Neurol. 2007;6:553-61.
- [Google Scholar]
- Does this patient have a hemorrhagic stroke.: Clinical findings distinguishing hemorrhagic stroke from ischemic stroke? JAMA. 2010;303:2280-6.
- [Google Scholar]
- RevMan 5 download and installation. Available from: http://ims.cochrane.org/revman/download
- Poor accuracy of the Siriraj and Guy's Hospital stroke scores in distinguishing haemorrhagic from ischaemic stroke in a rural, tertiary care hospital. Natl Med J India. 2003;16:8-12.
- [Google Scholar]
- Comparison of Siriraj and Guy's Hospital score to differentiate supratentorial ischaemic and haemorrhagic strokes in the Indian population. J Assoc Physicians India. 1994;42:302-3.
- [Google Scholar]
- Poor diagnostic accuracy and applicability of Siriraj stroke score, Allen score and their combination in differentiating acute haemorrhagic and thrombotic stroke. J Assoc Physicians India. 2000;48:584-8.
- [Google Scholar]
- Siriraj stroke score and validation study to distinguish supratentorial intracerebral haemorrhage from infarction. BMJ. 1991;302:1565-7.
- [Google Scholar]
- Comparability and validity of Siriraj stroke score and Allen stroke score in differentiation of acute ischemic and haemorrhagic stroke. JPMI. 2011;25:206-16.
- [Google Scholar]
- Greek stroke score, Siriraj score and Allen score in clinical diagnosis of intracerebral hemorrhage and infarct: Validation and comparison study. Indian J Med Sci. 2004;58:417-22.
- [Google Scholar]
- Correlation of clinical scores and CT scan in patients of acute stroke. Karnataka, Bangalore: Rajiv Gandhi University of Health Sciences; 2006. p. :38-48.
- Cerebral infarction vs. intracranial hemorrhage-validity of clinical diagnosis. Vojnosanit Pregl. 1997;54:299-309.
- [Google Scholar]
- Accuracy of bedside diagnosis versus Allen and Siriraj stroke scores in Turkish patients. Eur J Neurol. 2006;13:611-5.
- [Google Scholar]
- Comparison of two hospital stroke scores with computerized tomography in ascertaining stroke type among Nigerians. Ann Afr Med. 2009;8:14-8.
- [Google Scholar]
- Accuracy of the Siriraj and Guy's Hospital Stroke Scores in urban South Africans. Stroke. 2007;38:62-8.
- [Google Scholar]
- Validation study of the Siriraj Stroke score in African Nigerians and evaluation of the discriminant values of its parameters: A preliminary prospective CT scan study. Stroke. 2006;37:1997-2000.
- [Google Scholar]
- Accuracy of two scores in the diagnosis of stroke subtype in a multicenter cohort study. Ann Emerg Med. 2009;53:373-8.
- [Google Scholar]
- Validation study of the Siriraj stroke score in North-East Nigeria. Niger J Clin Pract. 2008;11:176-80.
- [Google Scholar]
- Comparison of Siriraj stroke score and the WHO criteria in the clinical classification of stroke subtypes. Afr J Med Med Sci. 2002;31:13-6.
- [Google Scholar]
- Comparison of Greek stroke score with Siriraj and Guy's score in clinical diagnosis of stroke subtypes among Nigerians. J Med Med Sci. 2010;1:535-8.
- [Google Scholar]
- How accurate is Siriraj stroke score among Ethiopians. A brief communication? Ethiop Med J. 2005;43:35-8.
- [Google Scholar]
- Application of Greek stroke score in Ethiopia. A validation study. 2009. Internet Journal of Neurology. 11 Available from http://ispub.com/IJN/11/1/12837
- [Google Scholar]
- Magnetic resonance imaging versus computed tomography for detection of acute vascular lesions in patients presenting with stroke symptoms. Cochrane Database Syst Rev 2009:CD007424.
- [Google Scholar]
- Comparison of MRI and CT for detection of acute intracerebral hemorrhage. JAMA. 2004;292:1823-30.
- [Google Scholar]


