
Translate this page into:
Epileptic Patients are at Risk of Cardiac Arrhythmias: A Novel Approach using QT-nomogram, Tachogram, and Cardiac Restitution Plots
This is an open access article distributed under the terms of the Creative Commons Attribution-NonCommercial-ShareAlike 3.0 License, which allows others to remix, tweak, and build upon the work non-commercially, as long as the author is credited and the new creations are licensed under the identical terms.
This article was originally published by Medknow Publications & Media Pvt Ltd and was migrated to Scientific Scholar after the change of Publisher.
Abstract
Background:
Sudden death is reported in patients who had a history of epilepsy and some authors believed that is due to cardiac arrhythmias.
Objectives:
This study aimed to predict that the epileptic patients are at risk of serious cardiac arrhythmias by QT-nomogram, tachogram (Lorenz), and cardiac restitution plots.
Methods:
A total number of 71 healthy subjects (Group I) and 64 newly diagnosed epileptic patients (Group II) were recruited from Al-Yarmouk and Baghdad Teaching hospitals in Baghdad from March 2015 to July 2015 and included in this study. The diagnosis of epilepsy achieved clinically, electroencephalograph record and radio-images including computerized tomography and magnetic image resonance. At the time of entry into the study, an electrocardiography (ECG) was done, and the determinants of each ECG record were calculated. The QT-nomogram, tachogram, and cardiac restitution plots were used to identify the patients at risk of cardiac arrhythmias.
Results:
Significant prolonged corrected QT corrected (QTc) and JT corrected intervals were observed in female compared with male at age ≥50 years while the TQ interval was significantly prolonged in males of Group II. Eight patients of Group II had a significant pathological prolonged QTc interval compared with undetectable finding in Group I. QT nomogram did not disclose significant findings while the plots of Lorenz and restitution steepness disclose that the patients of Group II were vulnerable to cardiac arrhythmias. Abnormal ECG findings were observed in the age extremities (≤18 years and ≥50 years) in Group II compared with Group I.
Conclusion:
Utilization of QT-nomogram, restitution steepness, and tachogram plots is useful tools for detection subclinical vulnerable epileptic patient with cardiac arrhythmias.
Keywords
Electrocardiogram records
epilepsy
Lorenz plot
QT nomogram
restitution steepness

INTRODUCTION
Sudden death in epilepsy is common and is associated with repeated frequency of the generalized tonic–clonic seizures and refractory epilepsy that is linked with genetic and acquired causes (among these; long QT syndrome).[12] It is attributed to many causes; one of them is cardiac arrhythmias that resulted from a prolonged QT interval. In refractory epilepsy, early ventricular repolarization and prolonged QT interval were observed in higher frequencies compared with healthy subjects.[3] Prolonged QT interval may be related to the site of ictal activity in the brain as Surges et al. observed that patients with mesial temporal lobe epilepsy are at risk of having prolonged QT interval.[4] Antiepileptic drugs as a mono-or-polytherapy are not associated with sudden unexpected death in epilepsy when the frequency of generalized tonic–clonic seizures is taken in consideration.[5] Antiepileptic drugs do not precipitate significant prolongation of the QT interval that progressed to sudden unexpected death in epileptic children.[678] In poststroke seizure patients aged more than 18 years old, the antiepileptic drugs (phenobarbital, levetiracetam) may be the cause of significant prolongation of QT interval during interictal phase compared with control.[9] Expression of the neuronal sodium channel (Nav1.1) is increased in rat heart using the experimental animal model of epilepsy[10] and QT-prolongation were observed in the kindling of the hippocampus region.[11]
Therefore, the rationale of this study is based in the assumption that there is an alteration of sodium channel activity that occurred during epilepsy in the brain may occur in the heart due to epilepsy, that is channelopathy. The aim of this study is to predict the epileptic patients who are at risk of serious cardiac arrhythmias using QT-nomogram, tachogram, and cardiac restitution plots.
METHODS
This case finding study reviewed by the Scientific Committee at College of Medicine and approved the Council of Al-Mustansiriya University in Baghdad, Iraq. The patients were recruited from Al-Yarmouk Teaching and Baghdad Hospitals from 1st February to the end of July 2015. A consent form was obtained from each patient before the enrollment in this study.
New cases of epilepsy (including primary and secondary epilepsy) who did not receive antiepileptic medications at the time of the entry in the study were enrolled in this study. The eligible patients in this study were both gender of whatever age to cover the childhood epilepsy (up to 18 years old), adult epilepsy (19–49 years), and patients with associated risk factors (e.g., stroke) of epilepsy (≥50 years).
Inclusion criteria
Patients with a clinical diagnosis of epilepsy. The diagnosis of epilepsy is achieved by the consultants of neurology. The patients were newly diagnosed and did not use antiepileptic medications. The clinical diagnosis of epilepsy is supported by electrophysiological study, electroencephalogram (EEG), and radio-imaging studies.
Exclusion criteria
Patients with cardiovascular or hepatic or renal diseases, psychotic disorders, clinical and laboratory evidence of electrolyte disturbances, current history of medications (e.g., macrolides; antipsychotics, antidepressants; antihistamines antiarrhythmics), and pregnant or lactated mothers.
Each patient was examined thoroughly by the consultants of neurology and the data that related to the objective of the study was obtained. Then each participant is subjected to the electrocardiograph (ECG) investigation. Specifications of the ECG machine are: 12 standard leads, the sensitivity, is 10 mm/mV, the record speed is 25 mm/s. The ECG records of patients who were in sinus rhythm are obtained. Then the ECG record strips were scanned, and the scanned picture was magnified by PC Windows photo viewer to zoom. From each ECG record strips, the following data were obtained: Heart rate (beats/min); RR interval (s); PR interval (s); QRS wave duration (s); QRS dispersion (s); QT measured (QTm) interval (s); QT corrected (QTc) interval (s); JTm (JT measured) interval (s); JT corrected (JTc) interval (s); TQ interval (s); R wave amplitude V5 (mV); S wave amplitude (mV); and summation of S (v1) and R (v5).
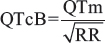
QTc interval (s): It calculated using the Bazett's formulae:[12]
The cutoff point of QTcB value is used according to Goldenberg et al. with a modification of children and adolescent age that instead of <15 years, ≤18 years old is considered.[13]
The JTm (s) was calculated by subtracting QRS complex duration from QT interval and the corrected (JTc) was calculated by subtracting the duration of QRS complex from QTcB.
A QT nomogram plot that developed by Chan et al. used to identify the patients who are vulnerable or at risk of developing cardiac arrhythmias.[14] The QT-nomogram plot represented a plot of heart rate against the QT interval and any point out of the curve indicated that the patient is vulnerable to cardiac arrhythmias. The QTcB/TQ ratio is simply calculated by dividing the QTcB interval by TQ. This ratio represents the cardiac restitution. The term restitution means the ability of the heart to recover from the contraction of the one beat to the relaxation phase of the next beat. This ratio represented the relationship between the duration of action potential (represented by QT duration) and the diastolic interval (represented by the TQ duration). Therefore, a ratio of ≥1.0 is an alarm for cardiac arrhythmias (due to reentry of impulse) and indicates that the patient may at a risk of torsade de pointes.[1516]
Lorenz plot (Poincare plot) is used in this study in which each QTm (n), RR (n) interval is plotted against next QT interval (n + 1) and RR (n + 1) interval, respectively. By this plot, the variability in the duration of the QT period (beat to beat) and in the heart rate (tachogram) can be detected. The abnormality is traced as discrete dots away from the cluster of nomogram points.
A total number of 71 healthy subjects (41 female and 30 male) (Group I) and 64 patients (27 female and 37 male) (Group II) with age ranged from 5 to 80 years old were enrolled in the study.
Statistical analysis
The results were presented as number, percentage, and whenever possible as mean ± standard deviation. The data were analyzed using two-tailed, unpaired difference between two means Student's t-test, one-way analysis of variance post hoc Tukey (Honest significant difference) test, and Pearson's (rho) correlation test. The statistical analysis was carried on by Excel 2007 and SPSS version 17 (SPSS. Inc, Amazon.co. Uk) programs taking a P ≤ 0.05 as the lowest limit of significance.
RESULTS
Table 1 shows the characteristics of the patients. The mean age of Group I patients (subgroup 19–49 years) is significantly higher than the corresponding value of Group II. Most of the subjects and patients were resident in the urban area which amounted 63.4% and 70.3% of Group I and II, respectively. The ethnicity of all subjects and patients was Arabic. Family history of epilepsy was reported in Group II by 9.4% and 7.8% in the first and second relatives, respectively. None of the patients aged ≥50 years had a family history of epilepsy. History of head injury and migraine were reported in 3 and 9 out of 64 patients respectively in Group II. Table 2 shows significant prolongation of TQ interval in males aged ≤18 years and 19–49 years compared with corresponding values in females of Group I. The values of voltage criteria are higher among males aged ≤18 and ≥50 years compared with corresponding values in females of Group I. The other ECG measurements do no not show significant differences between males and females of the Group I. In Group II, the QTcB and JTc are significantly prolonged among females aged ≥50 years while the TQ interval is shortened among females aged 19–49 years compared with corresponding values of males, respectively [Table 3]. Table 4 shows the significant differences between Group I and II in the ECG determinants with respect to the age. Females (aged ≤18 years) among group II has significantly higher values of heart rate, QRS dispersion, and QTcB/TQ ratio and significant lower values of QTm and TQ interval compared with corresponding values of healthy subjects (Group I). At the age of 19–49 years, females of Group II have significantly higher values of heart rate and PR interval compared with corresponding values of Group I. At the age of ≥50, the significant high values of QTcB, QTCF, QTCl, and JTc and significant short TQ interval are observed among epileptic patients (Group II) compared with corresponding values of healthy subjects (Group I). In Group II males, a significant increase of heart rate, QRS dispersion, and QTcB/TQ ratio were observed compared with corresponding values of Group I [Table 4]. The QTm, QTcF, and TQ measurements are significantly decreased among epileptic patients (Group II) compared with corresponding values of Group I. Prolonged PR interval among Group II males is the only significant value of ECG determinants among epileptic patients aged 19–49 years [Table 4]. Males of Group II of age ≥50 years old have a significant increase of heart rate and QTC ratio, and significant low voltage criteria compared with corresponding values of Group I [Table 4]. The case finding of subclinical abnormal values of QTcB interval is presented in Table 5. Borderline QTcB values observed in eight healthy males (Group I), otherwise no abnormal QTcB observed in males and females [Table 5a]. In epileptic patients, the borderline QTcB interval observed in 13 epileptic patients (3 females and 10 males) while pathological-prolonged QTcB interval observed in 8 patients (5 females and 3 males) [Table 5b]. Significant shortening of QTcB interval observed in two epileptic patients (1 female and 1 male) and none of the healthy subjects has significant short QTcB interval.
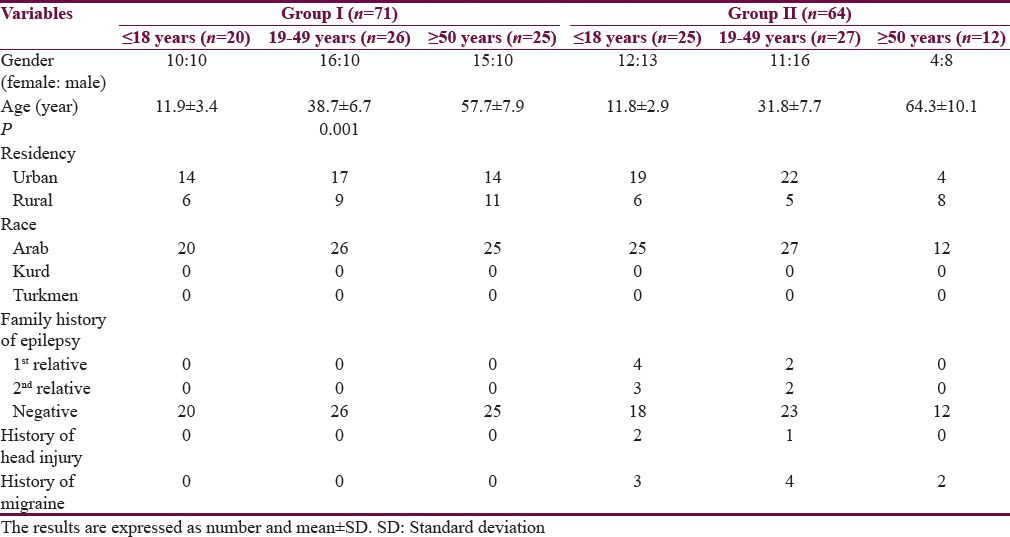
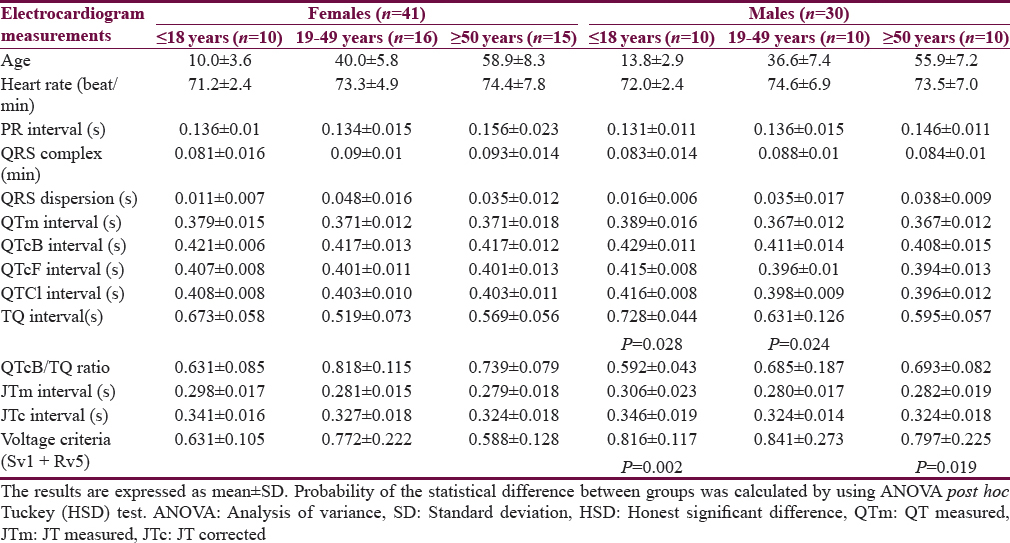
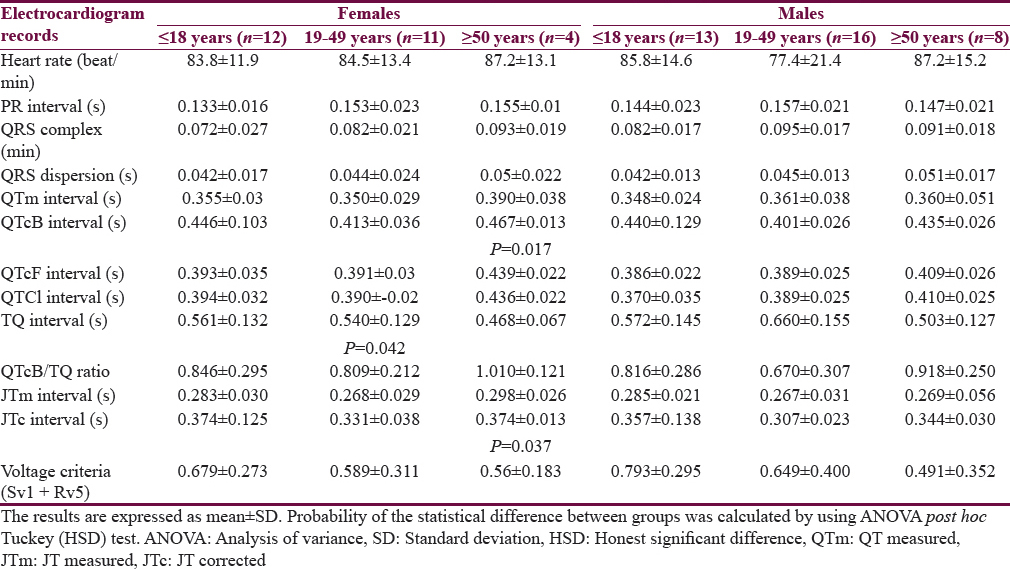
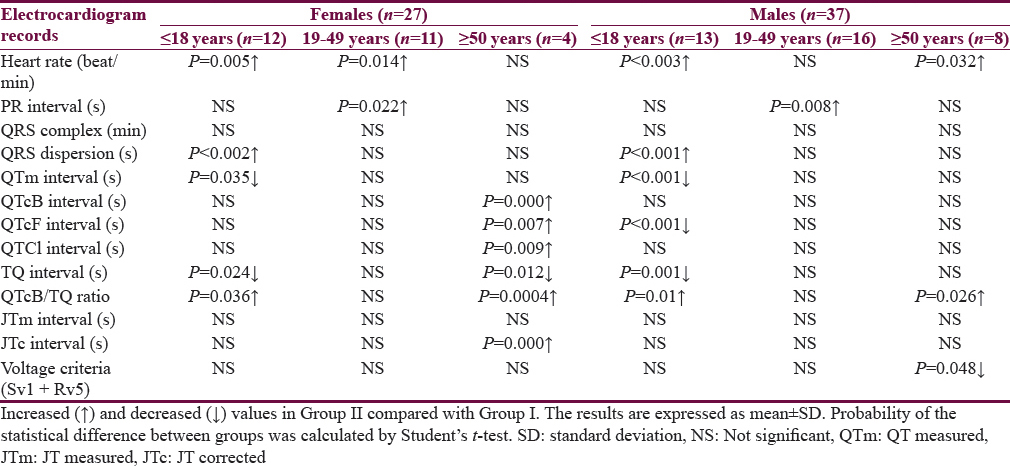
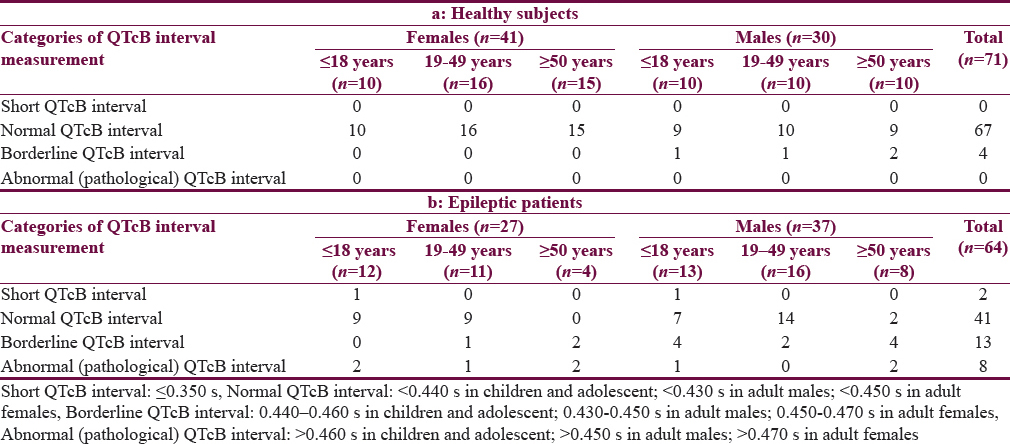
Figure 1 shows the relationship between heart rate and the QTm interval in the QT nomogram of epileptic patients (Group II). All the patient of different age groups is within the normal distribution of the QT nomogram and none of them exceeding the curve line of nomogram. Figure 2a shows the restitution steepness as a function of QT against QTm in which the slope of these dots is positive (0.168 for male and 0.014 for female) and there are two patients (at the beginning of the slope) and three patients (at the end of the slope) are at risk of cardiac arrhythmias. In the Figure 2b, the slope of restitution steepness is directed downward (the slope is negative; −0.94 for male and −0.85 for female) and there are only two patients are at risk (at the beginning of the slope) of arrhythmias. The variability of the QT interval beat to beat is the same for Group I and II in which the slope was 0.864 and 0.863, respectively [Figure 3a]. The variability of the RR interval beat to beat is well observed in epileptic patients [Figure 3b] in which the slope of Group I is 0.630 while the slope of Group II is 0.915.
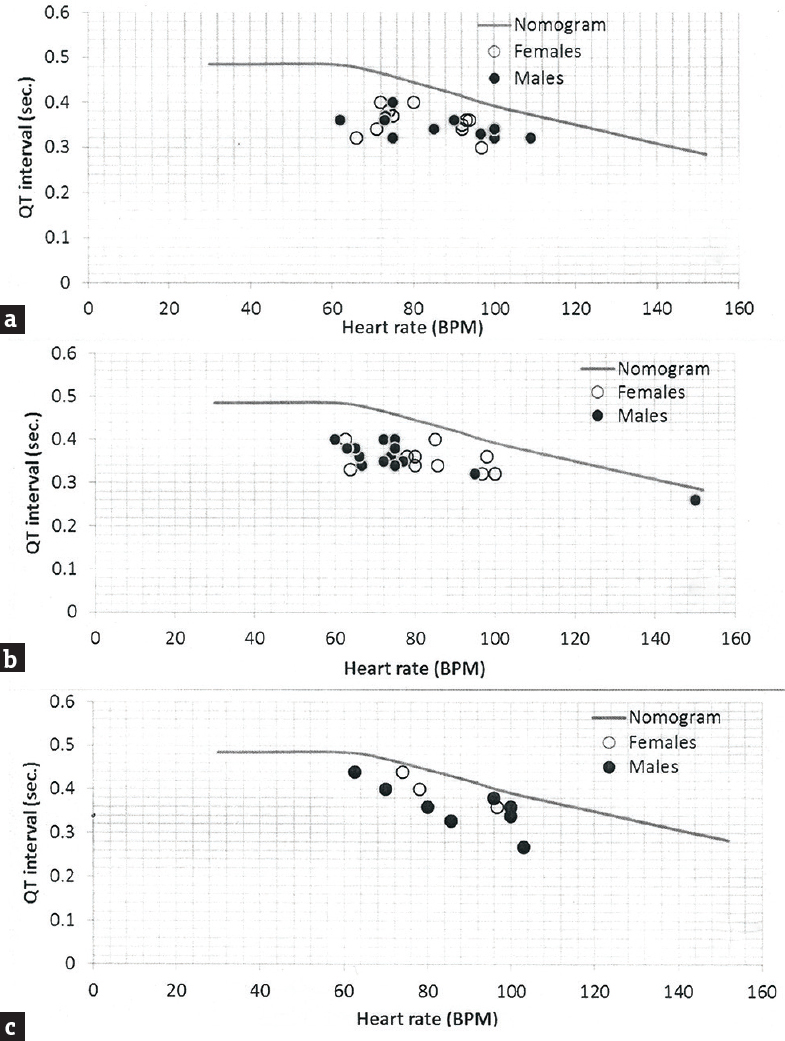
- QT-Nomogram of epileptic patients (Group II) in respect to gender and age. (a) ≤18 years; (b) 19–49 years and (c) ≥50 years. BPM: Beats per minute
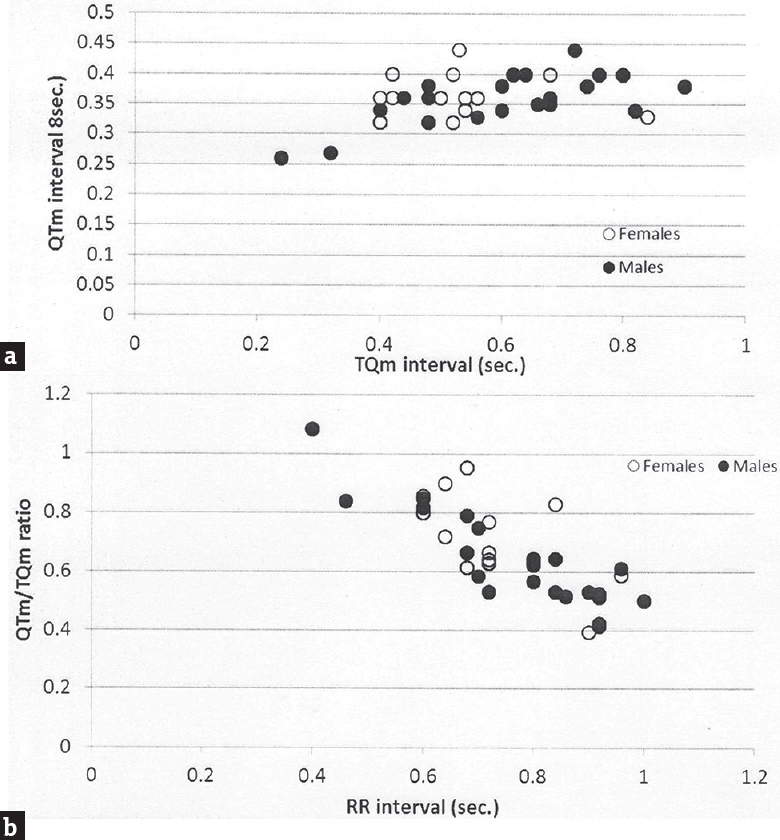
- Restitution steepness as a function of QT measured interval against TQm interval (a) and QT measured/TQm ratio against RR interval (b) in epileptic patients (Group II)
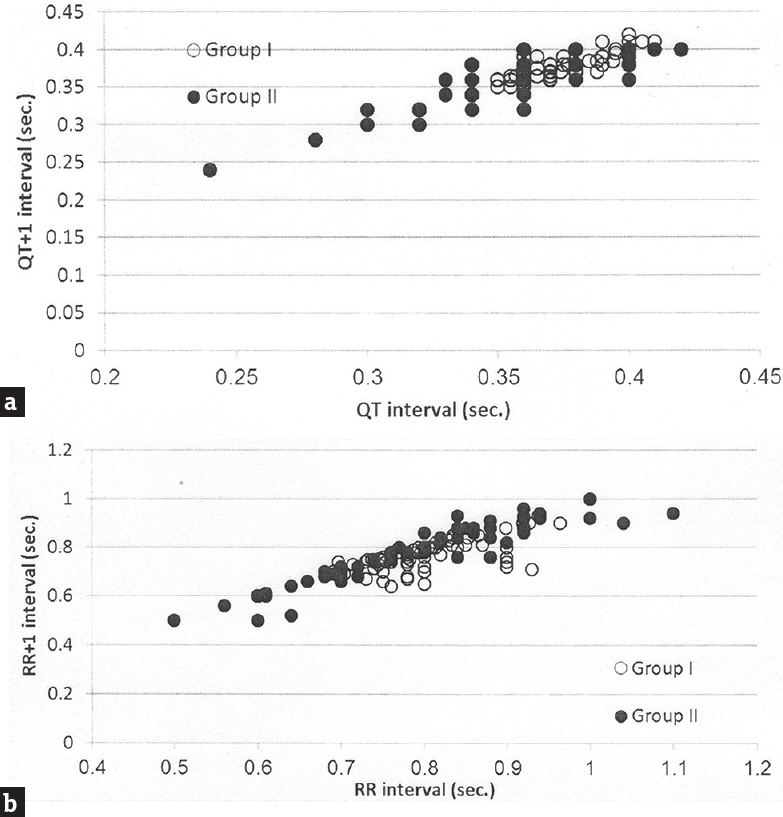
- Variability of QT and RR intervals beat to beat plotted as a function of QT interval of one beat against QT +1 interval of the next beat (a) and as a function of RR interval of one beat against RR +1 interval of the next beat (b) in epileptic patients (Group II)
DISCUSSION
The results of this study highlight that epileptic patients are potentially at risk of cardiac arrhythmias and epilepsy as a disease is one manifestation of a broad spectrum of channelopathy. The characteristics of this study pointed out that epilepsy run in families in a small percent and head injury is not a contributing factor in this study. Combined neurological and psychiatric illnesses with epilepsy are previously reported and in this study migraine, headache was detected in 6 out of 64 (9.4%) patients compared with 3 out of 71 (4.2%) healthy subjects.[17] Gender-based differences in the ECG variables are detected in the healthy subjects (Group I) in term of significant of prolonged QT interval and voltage criteria among males compared with women at age ≤18 years, 19–49 years, and ≤18 years and ≥50 years, respectively. The previous studies reported that females had normally a nonsignificant prolonged QT interval compared with males.[18] In epileptic patients (Group II), females had a significantly higher value of QTcB and JTc intervals and a low value of TQ intervals than males with respect to the age. This observation highlight that the abnormalities in the ECG in epileptic patients are related to the age factor and they did not solely relate to QTc interval. Aydin et al. (2016) reported that the JTc interval among healthy women did not significantly differ from the corresponding values of healthy men.[18] Table 4 shows that the significant differences in the ECG records among epileptics compared with healthy subjects are commonly found among the extremities of age, that is ≤18 years and ≥50 years in both genders. These abnormalities indicate the sodium channel loss their functions in the heart as well as in the brain (channelopathy). Several studies revealed more than one mutant gene that linked with the channelopathy among epileptic patients, and this may explain the abnormalities that observe in the female gender and the age extremities.[19] The abnormalities of ECG records concerning the subclinical prolongation of QTc interval were disclosed in Table 5 which showed that 8 out of 64 epileptic patients (12.5%) are prone to cardiac arrhythmias. Zara et al. reported high percentage of mutations in different genes of benign familial epilepsies in which the genetic factor played a role in epilepsy while in this study the family history of epilepsy was evident in small percent.[20] In this study, different plots are utilized to clarify the vulnerability of epileptic patients with cardiac arrhythmias. The first is QT nomogram. This type of nomogram is suitable to detect the drugs that induced clinical cardiac arrhythmias; therefore, we expected to have a normal QT-nomogram in epileptic patients without detection any point that exceeded the curve line of the nomogram that is our patients did not manifest clinical cardiac arrhythmias. Literature survey did not disclose any study that utilized QT-nomogram in the assessment of epilepsy. The second plot represented the restitution steeping in which the recovery of the ventricle activation did not occur in some patients, and the slope of the negative steepness tended to be more obvious in males. This observation indicates that epileptic patients are vulnerable to cardiac arrhythmias as there is a relationship between the ventricular recovery and the vulnerability of arrhythmias.[21] At the time of the study, only one patient had a ratio of QTm/TQm more than one which indicated that this patient at any time will be suffering from serious cardiac arrhythmias. Figure 3b shows that the tachogram (Lorenz plot) of Group II is differed from Group I and the epileptic patients. The abnormalities that observed in the restitution steeper and Lorenz plots indicated that there are alterations in the effective refractory periods and the influences of the autonomic tone on the beat to beat interval.[22232425] This observation documented the experimental study used rat in which tonic convulsive seizures played a role on the distortion of the cardiac autonomic regulation and thereby induced changes in the duration of cardiac arrhythmia.[26] One of the limitations of the study is the genetic study did not carry to link between the patients who are vulnerable to cardiac arrhythmias with the mutation of certain genes. The other limitation of the study that one ECG record was used rather than a 24 h Holter record.
CONCLUSION
We conclude that epilepsy patients have abnormal ECG record particularly at the extremities of age, and they are more vulnerable to the cardiac arrhythmias. Utilization of QT-nomogram, restitution steepness, and tachogram plots are useful tools for detection subclinical vulnerable epileptic patient with cardiac arrhythmias.
Financial support and sponsorship
College of Dentistry, Al-Mustansiriya University, Baghdad, Iraq.
Conflicts of interest
There are no conflicts of interest.
REFERENCES
- Sudden unexpected death in epilepsy. Potential role of antiepileptic drugs. CNS Drugs. 2013;27:113-9.
- [Google Scholar]
- Mechanisms of sudden unexpected death in epilepsy: The pathway to prevention. Nat Rev Neurol. 2014;10:271-82.
- [Google Scholar]
- Increased prevalence of ECG markers for sudden cardiac arrest in refractory epilepsy. J Neurol Neurosurg Psychiatry. 2015;86:309-13.
- [Google Scholar]
- Ictal modulation of cardiac repolarization, but not of heart rate, is lateralized in mesial temporal lobe epilepsy. PLoS One. 2013;8:e64765.
- [Google Scholar]
- Do antiepileptic drugs or generalized tonic-clonic seizure frequency increase SUDEP risk? A combined analysis. Epilepsia. 2012;53:249-52.
- [Google Scholar]
- The potential for QT prolongation by antiepileptic drugs in children. Pediatr Neurol. 2004;30:99-101.
- [Google Scholar]
- Lamotrigine does not prolong QTc in a thorough QT/QTc study in healthy subjects. Br J Clin Pharmacol. 2008;66:396-404.
- [Google Scholar]
- Cardiac function and antiepileptic drug treatment in the elderly: A comparison between lamotrigine and sustained-release carbamazepine. Epilepsia. 2009;50:1841-9.
- [Google Scholar]
- Effects of phenobarbital and levetiracetam on PR and QTc intervals in patients with post-stroke seizure. Clin Drug Investig. 2014;34:879-86.
- [Google Scholar]
- Prolongation of action potential duration and QT interval during epilepsy linked to increased contribution of neuronal sodium channels to cardiac late Na + current: Potential mechanism for sudden death in epilepsy. Circ Arrhythm Electrophysiol. 2015;8:912-20.
- [Google Scholar]
- Seizures following hippocampal kindling induce QT interval prolongation and increased susceptibility to arrhythmias in rats. Epilepsy Res. 2013;105:216-9.
- [Google Scholar]
- QT interval: How to measure it and what is normal. J Cardiovasc Electrophysiol. 2006;17:333-6.
- [Google Scholar]
- Drug-induced QT prolongation and torsades de pointes: Evaluation of a QT nomogram. QJM. 2007;100:609-15.
- [Google Scholar]
- The impact of varying autonomic states on the dynamic beat-to-beat QT-RR and QT-TQ interval relationships. Br J Pharmacol. 2008;154:1508-15.
- [Google Scholar]
- Assessing QT prolongation and electrocardiography restitution using a beat-to-beat method. Cardiol J. 2010;17:230-43.
- [Google Scholar]
- Management of psychiatric and neurological comorbidities in epilepsy. Nat Rev Neurol. 2016;12:106-16.
- [Google Scholar]
- Effects of gender on electrocardiography in subjects with shortened ventricular depolarization (QRS) Ann Noninvasive Electrocardiol. 2016;21:272-9.
- [Google Scholar]
- Electrophysiological Differences between the same pore region mutation in SCN1A and SCN3A. Mol Neurobiol. 2015;51:1263-70.
- [Google Scholar]
- Genetic testing in benign familial epilepsies of the first year of life: Clinical and diagnostic significance. Epilepsia. 2013;54:425-36.
- [Google Scholar]
- The relationship between cardiac vulnerability and restitution properties of the ventricular activation recovery interval. J Cardiovasc Electrophysiol. 2015;26:768-73.
- [Google Scholar]
- Cardiac mechano-electric feedback and electrical restitution in humans. Prog Biophys Mol Biol. 2008;97:452-60.
- [Google Scholar]
- Cardiac arrhythmias imprint specific signatures on Lorenz plots. Ann Noninvasive Electrocardiol. 2008;13:44-60.
- [Google Scholar]
- Mechanisms of asymmetric Poincare’ plots obtained by means of 24-hour Holter monitoring in athletes. Comput Cardiol. 2008;35:473-6.
- [Google Scholar]
- Automatic quantification of the Poincaré plot asymmetry of NN-interval recordings. Physiol Meas. 2010;31:395-413.
- [Google Scholar]
- Effects of seizure severity and seizure repetition on postictal cardiac arrhythmia following maximal electroshock. Exp Neurol. 2003;181:327-31.
- [Google Scholar]


