
Translate this page into:
Outcome Prediction after Traumatic Brain Injury: Comparison of the Performance of Routinely Used Severity Scores and Multivariable Prognostic Models
This is an open access article distributed under the terms of the Creative Commons Attribution-NonCommercial-ShareAlike 3.0 License, which allows others to remix, tweak, and build upon the work non-commercially, as long as the author is credited and the new creations are licensed under the identical terms.
This article was originally published by Medknow Publications & Media Pvt Ltd and was migrated to Scientific Scholar after the change of Publisher.
Abstract
Objectives:
Prognosis of outcome after traumatic brain injury (TBI) is important in the assessment of quality of care and can help improve treatment and outcome. The aim of this study was to compare the prognostic value of relatively simple injury severity scores between each other and against a gold standard model – the IMPACT-extended (IMP-E) multivariable prognostic model.
Materials and Methods:
For this study, 866 patients with moderate/severe TBI from Austria were analyzed. The prognostic performances of the Glasgow coma scale (GCS), GCS motor (GCSM) score, abbreviated injury scale for the head region, Marshall computed tomographic (CT) classification, and Rotterdam CT score were compared side-by-side and against the IMP-E score. The area under the receiver operating characteristics curve (AUC) and Nagelkerke's R2 were used to assess the prognostic performance. Outcomes at the Intensive Care Unit, at hospital discharge, and at 6 months (mortality and unfavorable outcome) were used as end-points.
Results:
Comparing AUCs and R2s of the same model across four outcomes, only little variation was apparent. A similar pattern is observed when comparing the models between each other: Variation of AUCs <±0.09 and R2s by up to ±0.17 points suggest that all scores perform similarly in predicting outcomes at various points (AUCs: 0.65–0.77; R2s: 0.09–0.27). All scores performed significantly worse than the IMP-E model (with AUC > 0.83 and R2 > 0.42 for all outcomes): AUCs were worse by 0.10–0.22 (P < 0.05) and R2s were worse by 0.22–0.39 points.
Conclusions:
All tested simple scores can provide reasonably valid prognosis. However, it is confirmed that well-developed multivariable prognostic models outperform these scores significantly and should be used for prognosis in patients after TBI wherever possible.
Keywords
Abbreviated injury scale
Glasgow coma scale
outcome
prognosis
traumatic brain injury

INTRODUCTION
Despite efforts in prevention and improvements of care during the past decades, traumatic brain injuries (TBIs) still present a significant medical and public health problem globally. The main drivers of increasing concerns are large increases of TBI incidence caused by traffic accidents in developing countries (related to substantially increasing traffic density) and aging of the population (especially in countries with high economy level) and the related high incidence of TBI caused by falls.[12] A recent systematic review in Europe reported the pooled incidence of hospital-admitted TBI at 262/100,000 person years[3] while another systematic review reported crude incidence rates derived from 22 population-based studies, ranging from 47.3 to 694 per 100,000.[4] Along with the high rates of hospital admissions, TBI is associated with population mortality ranging from 9 to 28.1 per 100,000.[4] Adding to the overall public health burden of TBI is the fact that the life expectancy of persons after TBI is significantly lower when compared to the general population: An analysis of two large cohorts of patients after TBI reported a standardized mortality ratio of 2.4 and 3.9, respectively.[5]
Prognosis of outcome after TBI is an important tool in the assessment of quality of care, policy-making, clinical research, and practice and thus can help improving treatment and outcome.[6] Progress in quality and validity of available TBI prognostic tools was made possible by advancements in statistical modeling techniques that were applied to large datasets of patients with TBI.[678] A variety of multivariable prognostic models have been developed to date. A systematic review in 2006 identified 102 various prognostic models for patients with TBI[9] although many of these were of poor quality.[10] More recent models, such as the IMPACT[8] and the CRASH[7] models, have been developed on large datasets of patients, adhering to strict development criteria, and were externally validated for populations other than those used for their development, which proves their overall validity and generalizability.[261112]
One of the drawbacks of multivariable prognostic models is that they provide prognosis based on a large and strictly defined set of predictors which are not always available in clinical or research settings, thus making predictions impossible.[11] Alternatively to multivariable prognostic models, simpler and more readily available scores are often used to describe the severity and extent of the injury and prognosis after TBI (for simplicity, we refer to them as “simple scores” throughout the paper).
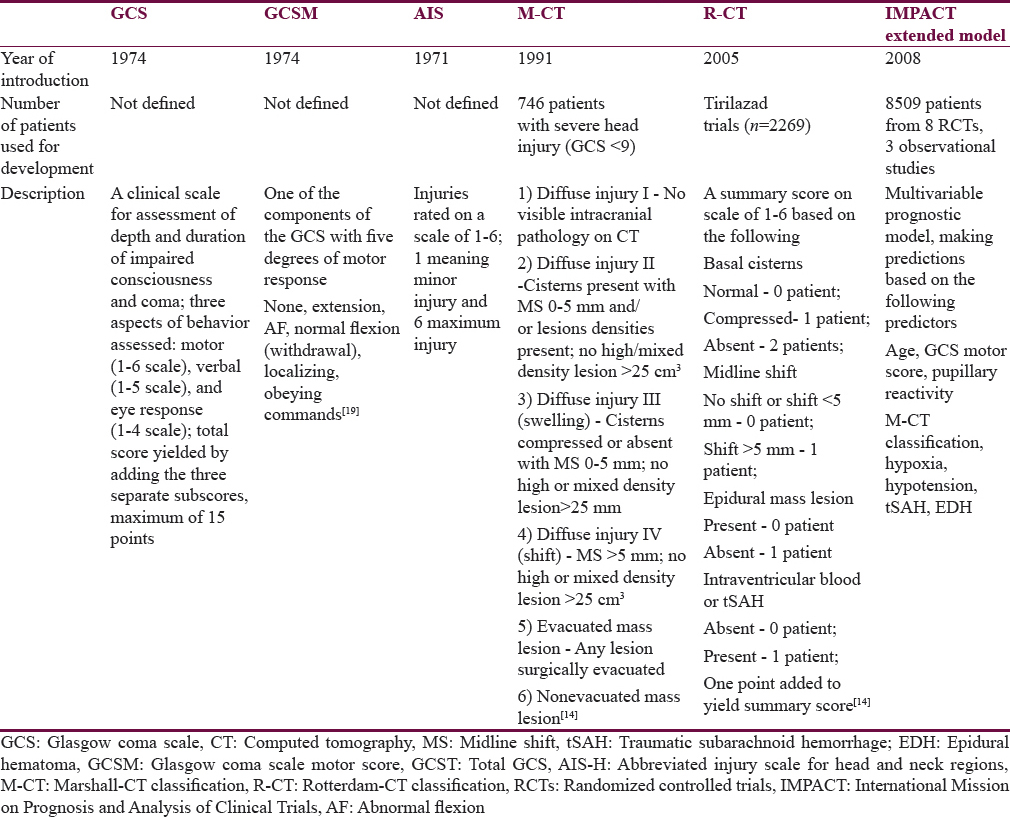
Somewhat simpler when compared to multivariable models are scoring systems that are based on computed tomographic (CT) scans of the head and brain. Two major scoring systems have been developed and established as valid tools in research and clinical practice. The Marshall-CT score (M-CT) was introduced in 1991[13] and it groups patients based on their CT abnormalities into six groups. The Rotterdam CT score[14] (R-CT) provides a score on a 1–6 scale that is based on the type and severity of lesions on the CT scan. Both, the M-CT and the R-CT, have been proven as valid tools for prognosis of patients after TBI.[1516]
The Glasgow coma scale (GCS), GCS motor score (GCSM), and abbreviated injury scale (AIS) provide yet even simpler and widely used measures of injury severity. The GCS, introduced by Teasdale and Jennett in 1974,[17] is used to assess the level of consciousness based on motoric, eye, and verbal responses of the patient. Of the three components of the GCS, the motoric response was identified as containing virtually all the prognostic information carried by the summary score[1819] and had been used in multivariable prognostic models, such as the IMPACT models.[8] The AIS has been developed by the AMA Committee on Medical Aspects of Automotive Safety[20] to provide researchers with a comprehensive rating system to tissue damage in regions of the body – including the region of head and neck (AIS for the head region [AIS-H]). AIS served as a basis for the development of the Injury Severity Score[2122] – a summary measure that describes the severity of the overall injury based on the assessment of the injury in each body part using the AIS.[23] The summary GCS, GCSM, and AIS have all been previously used in prognostic models[910] and have become standard measures of injury severity in patients after TBI. As they are routinely used and relatively easy to obtain, they potentially present an easily available prognostic tool. In this study, we sought to find out whether simple scores (GCS, GCSM, AIS-H, M-CT, or R-CT) could be used for prognosis of outcome in patients after TBI alternatively to more complex multivariable models and how big is the difference between their predictive performances.
The aim of this study was to perform a side-by-side comparison of the prognostic value of a set of simple injury severity measures (GCS, GCSM, AIS-H, M-CT, and R-CT) between each other and against a gold standard presented by the IMPACT-extended (IMP-E) multivariable prognostic models.
MATERIALS AND METHODS
Study design and participants
For this study, data from two observational clinical studies conducted in Austrian hospitals were used. The first study: “Austrian TBI Project”[24] focused on the introduction of evidence-based treatment of TBI in Austria, ran from 2002 to 2005, and collected data on 415 patients in five major Austrian hospitals. All patients with a GCS of 8 or less and admitted to the hospital alive were included. The second study: “Early treatment of patients with severe and moderate TBI in Austria,”[25] focused on evidence-based prehospital care and collected data on 778 patients with moderate or severe TBI (GCS 12 or less) in 14 Austrian centers, in 2009–2012. In both cases, compatible databases were used for data collection which allowed merging the two datasets in one, with a total of 1192 patient records. The study has been approved by the respective ethical committees of all participating centers where the data used in the paper were collected, in full accordance with the Declaration of Helsinki.
The following data were collected for all patients: demographic characteristics (age, sex); data on injury type and severity (including total GCS, its components, AIS for the regions of head/neck, face, thorax, extremities, abdomen, and external); data on CT scan (allowing to categorize patients using the Marshall and R-CT scores); data on prehospital and Intensive Care Unit (ICU) treatment; and data on outcome at ICU discharge, hospital discharge, and 6 months postinjury. Outcomes at ICU discharge and hospital discharge were recorded as survival/death and the outcomes at 6 months were assessed using the Glasgow outcome scale (GOS); for this study, the GOS at 6 months postinjury was categorized (1) as survival/death and (2) as favorable (GOS 4–5)/unfavorable (GOS 1–3).
Test methods and analysis
The main line of analysis in this study is a side-by-side comparison of the prognostic value of the selected simple scores (GCS, GCSM, AIS-H, M-CT, and R-CT) for the outcomes at ICU discharge (mortality), at hospital discharge (mortality), and at 6 months postinjury (mortality and favorable vs. unfavorable outcome). Second, all scores are compared to the IMP-E multivariable prognostic model selected as the “gold standard.” This model was selected as it showed good prognostic performance when externally validated for the prediction of outcomes in patients with TBI in Austria.[11] A comparative description of the analyzed scores is presented in Table 1.
Binary logistic regression models were fit using the binary outcome (either alive/dead or favorable/unfavorable) as response variables, and the respective scores (as single predictors) or the set of variables defined in the IMP-E model were used as predictors. To allow cross-comparisons of the size of the effect of the predicting variables on the outcome in each model, odds ratios with 95% confidence intervals are presented. To evaluate the prognostic value, the area under the receiver operating characteristics (ROC) curve (AUC) and Nagelkerke's R2 were used. The AUC is a value ranging between 0.5 and 1 referring to the discrimination ability of the model (discrimination between the two outcomes defined in the binary response variable): AUC = 1 means perfect discrimination and AUC = 0.5 means discrimination no better than by chance. Nagelkerke's R2 is a measure of the predictive ability (ranging between 0 and 1), indicating better performance when approaching 1. Model overfitting may eventually result in too optimistic expected performance on subjects other than those used for the development of the model.[26] To correct for such optimism in the model predictions, bootstrapping with 500 repetitions was used. Throughout the study, the presented AUC and Nagelkerke's R2 values are after such correction. To allow comparison of the performance of all models to the gold standard, the values of AUC and Nagelkerke's R2 of each model were subtracted from the values calculated for the IMP-E model. ROC curves are presented to allow graphical assessment of the differences in AUCs between the models. For all analyses, the open -source R statistical software[27] was used.
RESULTS
A total of 866 patients were analyzed. Figure 1 presents the flow of participants throughout the study – only patients for whom the outcomes at all three points of assessment were available were included in the analyses. Table 2 presents the description of demographic characteristics of the sample, type and severity of their injury, their treatment, and outcome at different stages post injury. The mean age was 49.9 years and about three-fourth of patients were male. Traffic injury and falls were with virtually equal share, the predominant causes (together 85% of patients). In general, the mean ISS (32.6), mean AIS-H (4.2), low median of the first GCSM score (3) and total GCS score (4), along with relatively high rates of hypotension and hypoxia indicate severe injuries. The most common predominant CT diagnoses were subdural hematoma (34%), diffuse edema (15%), and subarachnoid hemorrhage (14%). All other diagnoses were predominant in 11 or less percent of the sample. These CT findings were summarized using the Marshall CT (M-CT) score (42% of patients fell into categories 5 or 6) and the R-CT score (28% had a score of 4 or higher). About half of the patients were transported by helicopter, most received prehospital fluid (95% of patients; mean amount 864 ml), and almost three-fourth were intubated and underwent neurosurgical procedure. The mortality at ICU discharge was 36% and increased to 41% at 6 months postinjury; about half of the patients had unfavorable outcome at 6 months.
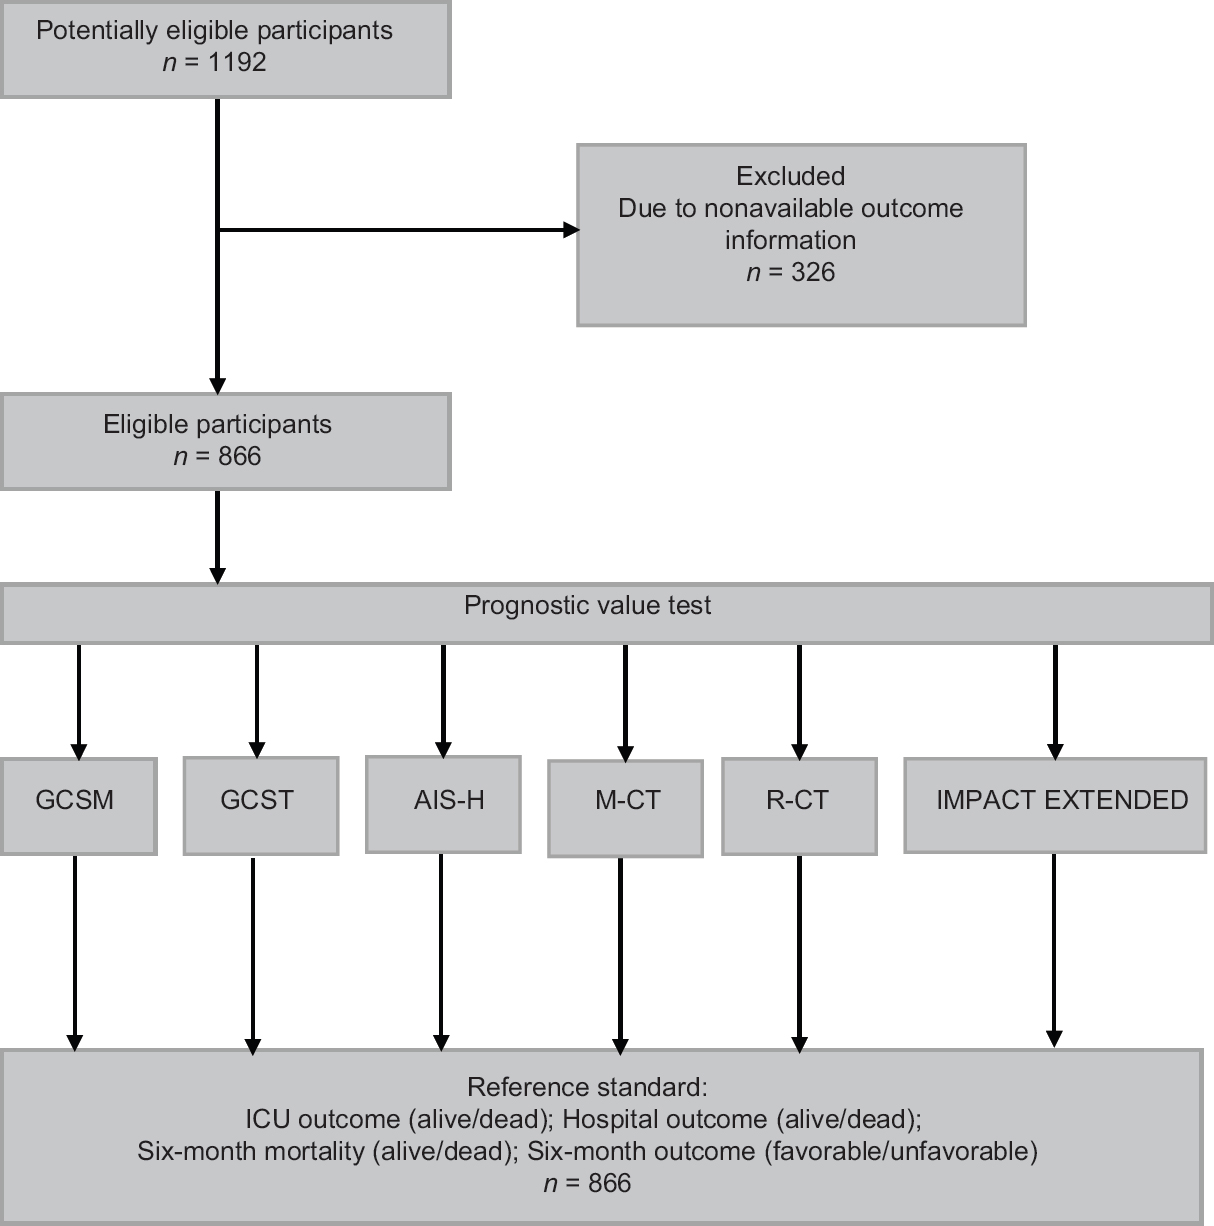
- Flow of participants through the study. GCSM: Glasgow coma scale motor score; GCST: Total GCS; AIS-H: Abbreviated Injury Scale for Head and Neck Regions; M-CT: Marshall CT classification, R-CT: Rotterdam CT score
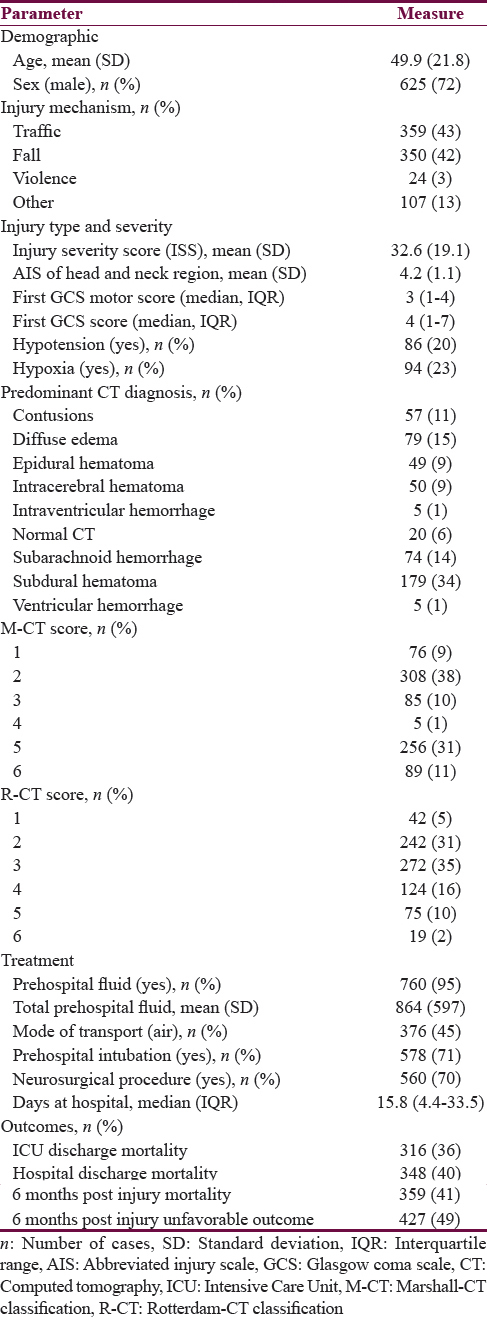
Table 3 gives an overview of the effect size of the predictors (simple scores and the IMP-E model) on the outcomes at different time points postinjury, presented as odds ratios. In general, the sizes of effects for the same predictor were similar throughout the outcomes with little variations. When comparing the GCS, GCSM, and AIS-H with the R-CT and M-CT scores, the two latter had considerably higher effect, suggesting that the relation of the two CT scores to outcomes is higher.
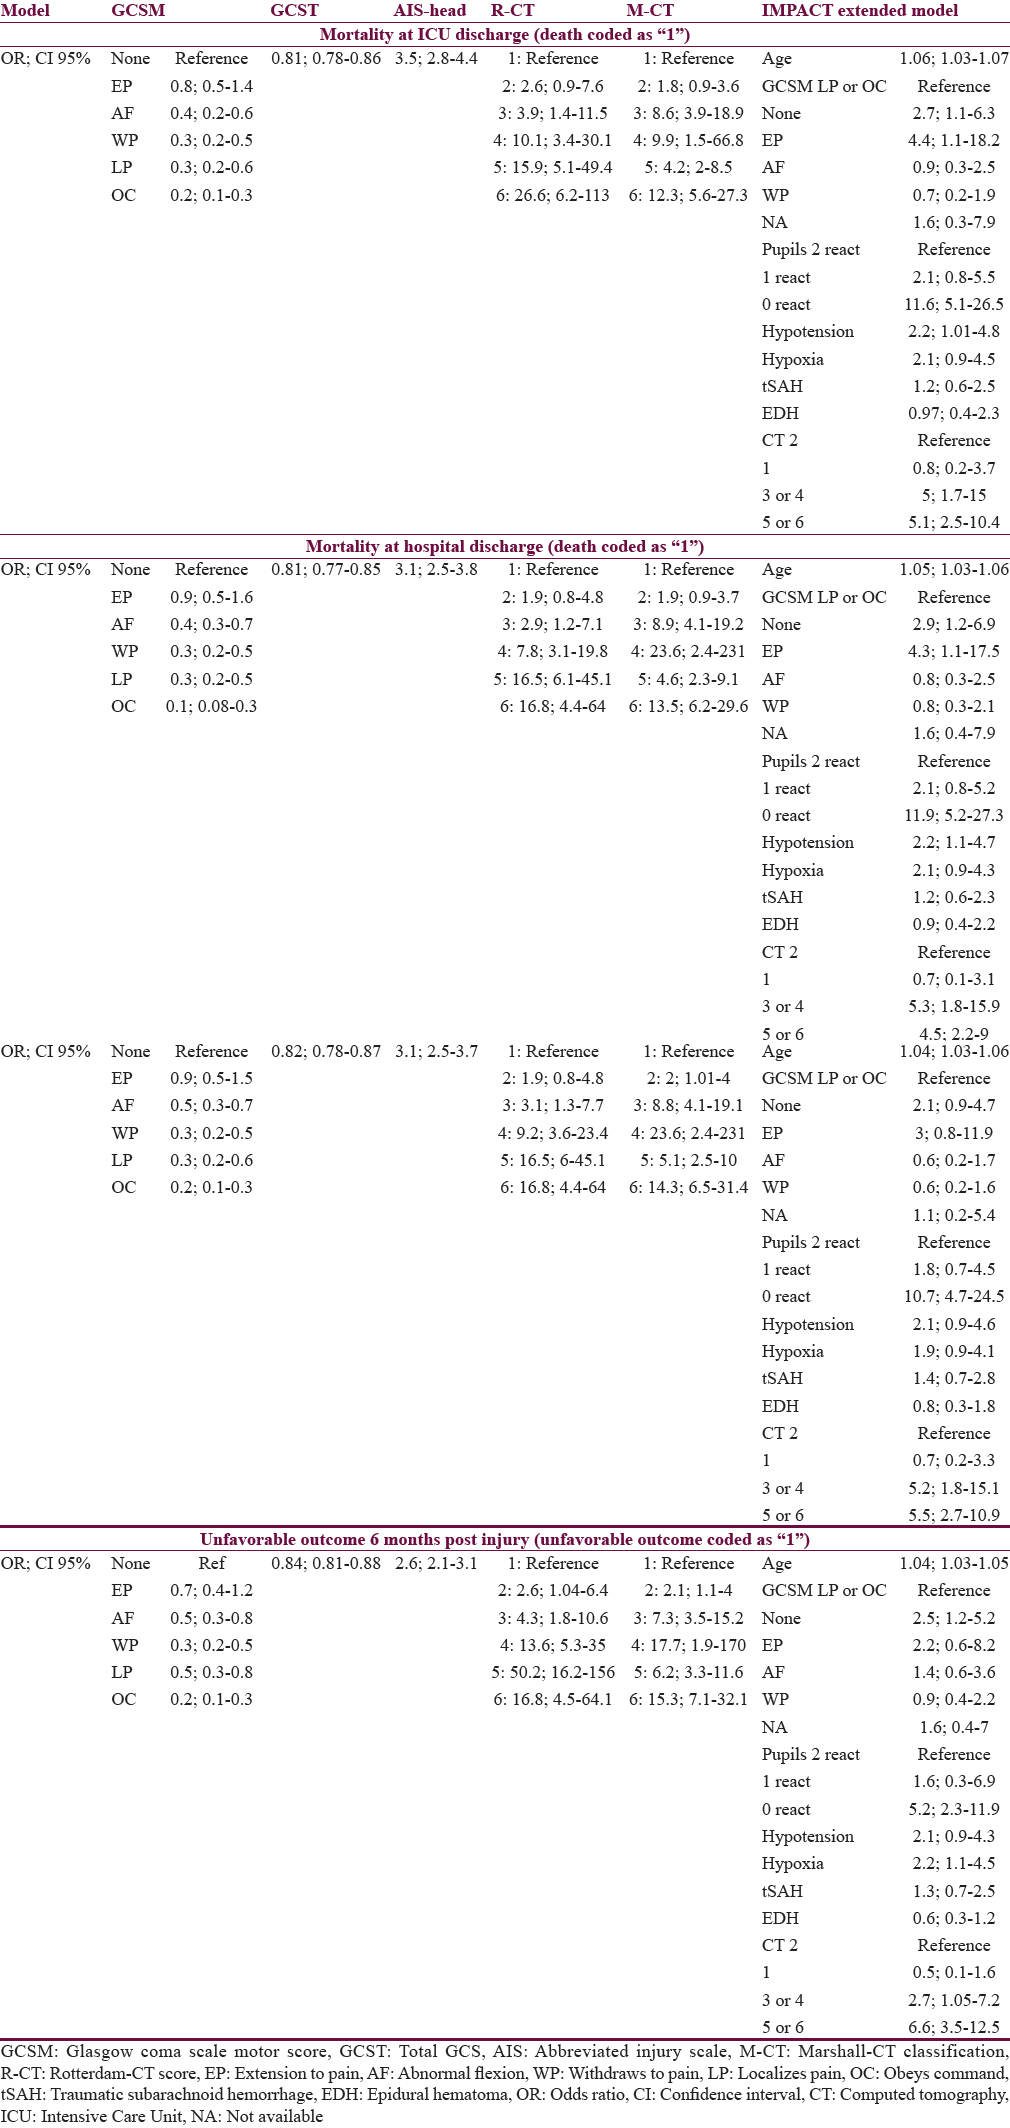
Table 4 presents the comparative analysis of the prognostic performance of the tested scores. When comparing the AUCs and R2s of the same model across the four outcomes, only little variation is observed in all cases which suggest that the performance of each score (and model) is similar for the prediction of outcome at ICU discharge, hospital discharge, and 6 months (both mortality and unfavorable outcome). A similar pattern is observed when comparing the performance of the models between each other (for each outcome point separately): The variation in case of AUCs is not larger than ±0.09 points; the R2s vary somewhat more, by up to 0.17 points. Both these comparisons suggest that all scores perform similarly when used for predicting outcomes at various points of assessment. In all cases, AIS-H performed superior to all other tested scores, suggesting best prognostic value at each outcome point.
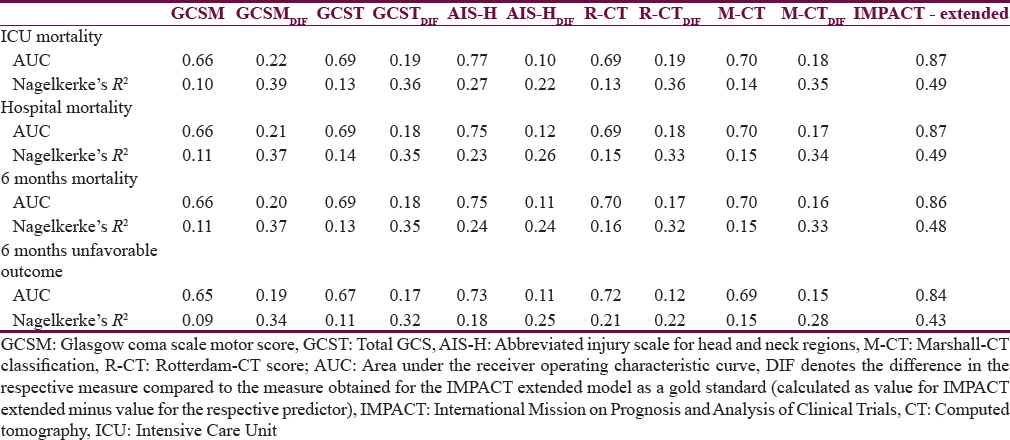
On the other hand, all analyzed scores perform significantly worse when compared to the IMP-E model (gold standard): In case of AUC, the differences vary between 0.10 and 0.22 (P < 0.05 in all comparisons of AUCs between simple scores and gold standard), and in case of R2, the differences are even more significant, ranging between 0.22 and 0.39 points. These findings are confirmed in Figure 2 where the ROC curves of all models are presented in a cross comparison: The ROCs of all tested models are relatively close to each other, and a significantly lower performance is apparent in all cases when compared to the IMP-E model.
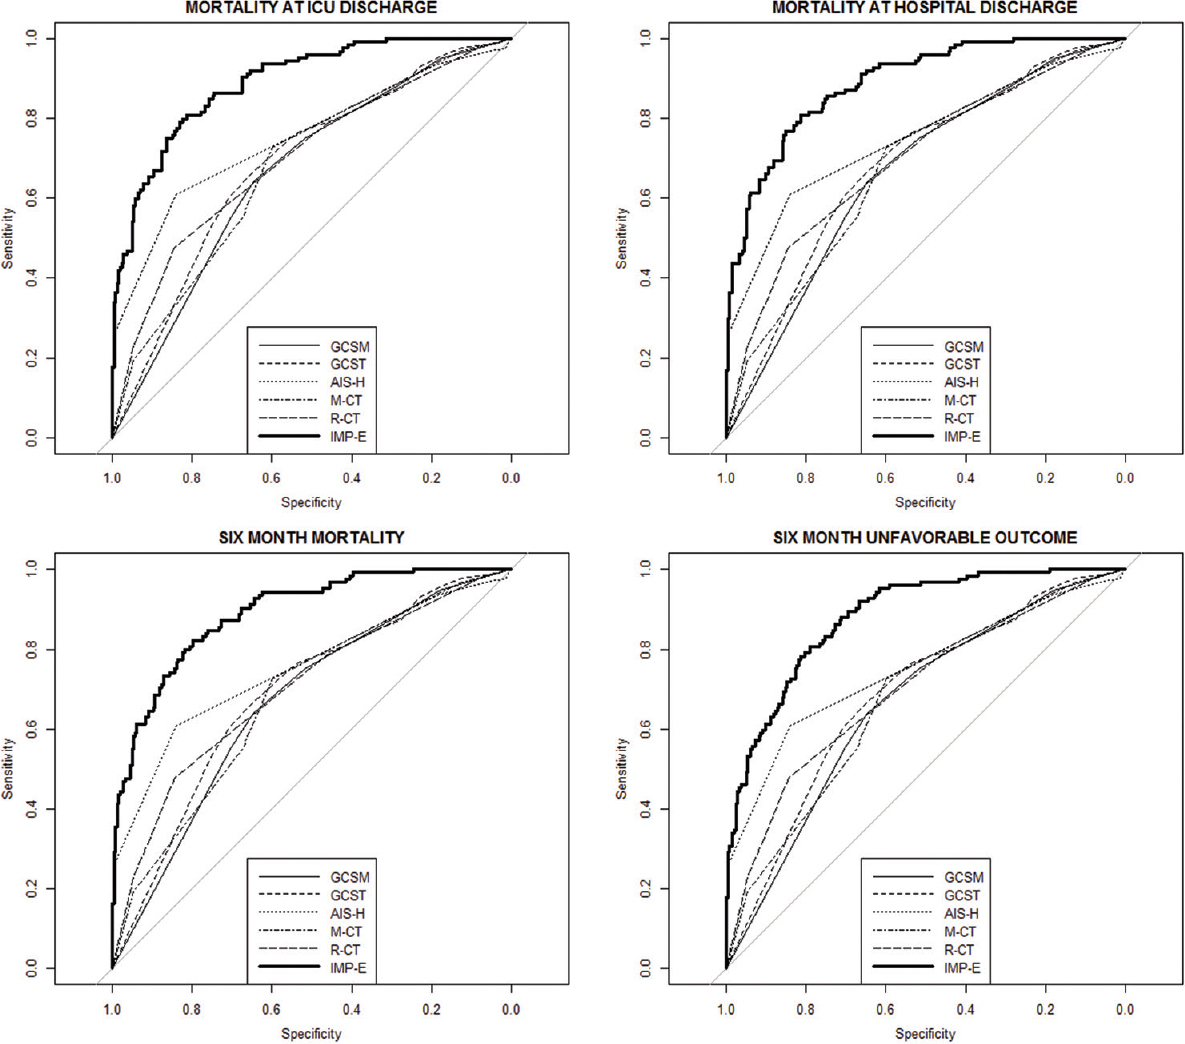
- Comparison of receiver operating characteristics curves of the analyzed prediction models to the gold standard (receiver operating characteristics curve of the IMPACT extended model). GCSM: Glasgow coma scale motor score; GCST: Total GCS; AIS-H: Abbreviated Injury Scale for head and neck; M-CT: Marshall CT classification, R-CT: Rotterdam CT score; IMP-E: IMPACT extended model. The thick curve represents the gold standard (receiver operating characteristics of the IMPACT extended model)
DISCUSSION
We present a study where we have performed a side-by-side comparison of the predictive value of simple injury severity scores between each other and against a gold standard, for which the prognostic performance of the IMP-E multivariable prognostic model was taken. To the best of our knowledge, this is the first study that presents such a comprehensive comparison. Our main findings are as follows: The compared simple scores (GCS, GCSM, M-CT, R-CT) had similar prognostic performance in a side-by-side comparison for the prediction of outcomes at each time point; the performance of AIS-H was slightly superior to all other simple scores; the performance of each single score (GCS, GCSM, AIS-H, M-CT, R-CT, IMP-E) was similar when used for predictions of outcome at various time points postinjury; the prognostic performance of the simple scores (GCS, GCSM, AIS-H, M-CT, R-CT) was significantly worse when compared to the performance of the IMP-E model (gold standard).
Although this is, to our knowledge, the first study presenting cross-comparison of prognostic performances of various injury severity scores, previous studies reported analyses of the performance of such scores separately. Out of the scores reported in this study, the most studied in the context of outcome prediction in TBI patients is the GCS and its components. It must be noted that there are aspects of the GCS relevant to note in the context of this study. First, the GCS in TBI patients is routinely being assessed at various time points after injury (typically in field and at admission) and it has been shown that the predictive value may vary by time of assessment.[11282930] These differences may be due to ability to validly assess the GCS in sedated and intubated patients.[303132] Second, the values of the GCS may differ due to interrater disagreement when it is assessed at various time points by different persons.[31]
However, there is strong evidence that both the total GCS[733] and the GCSM[82934] (which was found to contain virtually all the prognostic value of the total GCS[1835]) are strongly related to outcome in TBI patients. A study analyzing 21,657 patients from the UK reported an AUC = 0.89 and Nagelkerke's R2 = 0.55 for the total GCS assessed in the field; whereas for admission assessment, an AUC = 0.9 and Nagelkerke's R2 = 0.59 were reported.[29] An earlier study of the same predictor found an AUC = 0.92 (GCS defined as “worse in 24 h and estimated if the patient received sedatives”).[36] A meta-analysis (although including only 5 studies) reported a pooled AUC of 0.9 for the prediction of death.[37] Another study using a large dataset of 12,882 patients found AUCs for field and admission assessments to be 0.84.[28] The performance of the GCSM was found to be similar to that of the total GCS (AUC = 0.91 for both field and admission assessment, Nagelkerke's R2 = 59 and 58 for field and admission assessment, respectively).[29]
The prognostic performance indices of the GCS and GCSM found in our study are somewhat lower which may be caused by various factors: (1) As opposed to using field or admission values of GCS, in our analyses we have used the first available GCS (and GCSM) as the predictor (using the field assessment wherever available, and the admission value if the field assessment was not available), as suggested by the IMPACT study;[30] (2) changes in prehospital treatment over time influence the values of GCS and its predictive value as shown in a study comparing patients over a 10-year lag period,[38] and thus, different time of data collection in the compared studies could potentially affect the respective prognostic characteristics and partly explain the differences.
Although the AIS-H as a predictor of outcome has been previously studied, no direct comparisons can be made as previous reports do not provide indices such as AUC or Nagelkerke's R2. A study compared the predictive ability of the head AIS-H, injury severity scores, and GCS by correlating them with the 2 months outcome on the GOS-Extended scale in 270 TBI patients and concluded that AIS-H, injury severity scores, and GCS in combination correlated with the outcome better than any of the three measures alone.[39] AIS-H had been previously proven to be significantly related to outcome of TBI patients in the population from which the patients for this study have been drawn.[40]
The predictive performance of the R-CT and M-CT scores was also previously studied. A side-by-side comparison of their predictive value reported an AUC of 0.85 for both scores,[15] somewhat higher than in our study. Another study comparing the M-CT and R-CT in a side-by-side manner found AUCs of 0.63 and 0.68 for 6 months unfavorable outcome and AUCs of 0.64 and 0.7 for 6 months mortality; the reported Nagelkerke's R2s were 0.09 and 0.16 for the prediction of 6 months unfavorable outcome and 0.09 and 0.15 for the prediction of 6 months mortality.[16] The performance indices reported in this study are similar to our findings and in favor of their comparability speaks the virtually the same line of statistical analysis that was followed in both studies (including optimism correction).
The IMP-E study has been created along with other IMPACT models in 2008.[8] It has been established as a prognostic model of choice by a number of external validation studies[124142] (including a study on a population which was used for this study),[11] which justifies its use as a gold standard in this paper.
Our question in this study was whether simple, readily available, and routinely used injury severity scores can be used for valid prognosis of outcome in TBI patients, when compared between each other and when compared to multivariable prognostic models. Our findings suggest that the performance of multivariable prognostic models is far superior to simpler scores used in a univariable manner. This limits the potential use of these simple scores as primary, standalone prognostic tools in clinical or research settings. However, they still pose good prognostic characteristics and could be used for initial or preliminary prognosis. Their relative simplicity provides a strong leverage over multivariable models, where usually a large set of predictors must be available to estimate the prognosis.
There are limitations of this study that we acknowledge. The data used for the analyses come from two studies that were conducted a few years apart from each other. However, both studies used compatible databases, which ensured that all variables used in this paper were uniformly defined in both studies. Furthermore, rigorous data quality control (paper records were checked in detail against electronic records) was in place to ensure the validity of the data.
CONCLUSIONS
Based on our analyses, all tested simple scores (GCS, GCSM, AIS-H, M-CT, and R-CT) can provide reasonably valid prognosis. However, it is confirmed that well-developed multivariable prognostic models outperform these scores significantly and therefore should be used for prognosis in patients after TBI wherever possible.
Financial support and sponsorship
The project was funded jointly by the Austrian Ministry of Health (Contract Oct. 15, 2008) and by the Austrian Worker's Compensation Board (AUVA; FK 11/2008 and FK 11/2010). Data analysis was supported by a grant from AUVA (FK 09/13). INRO is supported by an annual grant from Mrs. Ala Auersperg-Isham and Mr. Ralph Isham and by small donations from various sources. The work of Marek Majdan on this paper was partly funded by an institutional grant from the Trnava University (2/TU/2015).
Conflicts of interest
There are no conflicts of interest.
Acknowledgments
Professor Walter Mauritz was the principal scientific advisor and investigator of the studies who collected the data used in this study; he participated in the idea-generation for this study and gave his advice on the content of this paper. Professor Mauritz co-founded the International Neurotrauma Research Organization where he served as a lead researcher until May 2015 when he passed away. We would like to dedicate this paper to his memory.
We would like to acknowledge the members of the “Austrian Working Group on Improvement of Early TBI Care” for their work in the design of the study and collection of data used for analyses in this paper.
REFERENCES
- Moderate and severe traumatic brain injury in adults. Lancet Neurol. 2008;7:728-41.
- [Google Scholar]
- Changing patterns in the epidemiology of traumatic brain injury. Nat Rev Neurol. 2013;9:231-6.
- [Google Scholar]
- Epidemiology of traumatic brain injury in Europe. Acta Neurochir (Wien). 2015;157:1683-96.
- [Google Scholar]
- Epidemiology of traumatic brain injury in Europe: A Living Systematic Review. J Neurotrauma 2016 Epub ahead of print
- [Google Scholar]
- Long-term disability and survival in traumatic brain injury: Results from the National Institute on Disability and Rehabilitation Research Model Systems. Arch Phys Med Rehabil. 2013;94:2203-9.
- [Google Scholar]
- Early prognosis in traumatic brain injury: From prophecies to predictions. Lancet Neurol. 2010;9:543-54.
- [Google Scholar]
- Predicting outcome after traumatic brain injury: Practical prognostic models based on large cohort of international patients. BMJ. 2008;336:425-9.
- [Google Scholar]
- Predicting outcome after traumatic brain injury: Development and international validation of prognostic scores based on admission characteristics. PLoS Med. 2008;5:e165.
- [Google Scholar]
- Systematic review of prognostic models in traumatic brain injury. BMC Med Inform Decis Mak. 2006;6:38.
- [Google Scholar]
- A systematic review finds methodological improvements necessary for prognostic models in determining traumatic brain injury outcomes. J Clin Epidemiol. 2008;61:331-43.
- [Google Scholar]
- Performance of IMPACT, CRASH and Nijmegen models in predicting six month outcome of patients with severe or moderate TBI: An external validation study. Scand J Trauma Resusc Emerg Med. 2014;22:68.
- [Google Scholar]
- Prediction of outcome after moderate and severe traumatic brain injury: External validation of the international mission on prognosis and analysis of clinical trials (IMPACT) and corticoid randomisation after significant head injury (CRASH) prognostic models. Crit Care Med. 2012;40:1609-17.
- [Google Scholar]
- A new classification of head injury based on computerized tomography. Spec Suppl. 1991;75(1 Suppl):S14-20.
- [Google Scholar]
- Prediction of outcome in traumatic brain injury with computed tomographic characteristics: A comparison between the computed tomographic classification and combinations of computed tomographic predictors. Neurosurgery. 2005;57:1173-82.
- [Google Scholar]
- Early CT findings to predict early death in patients with traumatic brain injury: Marshall and Rotterdam CT scoring systems compared in the major academic tertiary care hospital in Northeastern Japan. Acad Radiol. 2014;21:605-11.
- [Google Scholar]
- Predicting outcome in traumatic brain injury: Development of a novel computerized tomography classification system (Helsinki computerized tomography score) Neurosurgery. 2014;75:632-46.
- [Google Scholar]
- Assessment of coma and impaired consciousness. A practical scale. Lancet. 1974;2:81-4.
- [Google Scholar]
- Improving the Glasgow Coma Scale score: Motor score alone is a better predictor. J Trauma. 2003;54:671-8.
- [Google Scholar]
- The Glasgow Coma Scale at 40 years: Standing the test of time. Lancet Neurol. 2014;13:844-54.
- [Google Scholar]
- Rating the severity of tissue damage. I. The abbreviated scale. JAMA. 1971;215:277-80.
- [Google Scholar]
- The injury severity score: A method for describing patients with multiple injuries and evaluating emergency care. J Trauma. 1974;14:187-96.
- [Google Scholar]
- The Abbreviated Injury Scale (1976 Revision). Chicago, IL, USA: American Association for Automotive Medicine; 1976.
- Australian Severe TBI Study Investigators. Severe traumatic brain injury in Austria I: Introduction to the study. Wien Klin Wochenschr. 2007;119:23-8.
- [Google Scholar]
- Austrian Working Group on Improvement of Early TBI Care. Factors that may improve outcomes of early traumatic brain injury care: Prospective multicenter study in Austria. Scand J Trauma Resusc Emerg Med. 2015;23:53.
- [Google Scholar]
- Clinical Prediction Models – A Practical Approach to Development, Validation, and Updating. New York: Springer; 2009.
- 2014. R-Core-Team. R: A Language and Environment for Statistical Computing. Vienna, Austria: R Foundation for Statistical Computing; Available from: http://www.R-project.org/
- The predictive value of field versus arrival Glasgow Coma Scale score and TRISS calculations in moderate-to-severe traumatic brain injury. J Trauma. 2006;60:985-90.
- [Google Scholar]
- Comparing model performance for survival prediction using total Glasgow Coma Scale and its components in traumatic brain injury. J Neurotrauma. 2013;30:17-22.
- [Google Scholar]
- Prognostic value of the Glasgow Coma Scale and pupil reactivity in traumatic brain injury assessed pre-hospital and on enrollment: An IMPACT analysis. J Neurotrauma. 2007;24:270-80.
- [Google Scholar]
- Inaccurate early assessment of neurological severity in head injury. J Neurotrauma. 2004;21:1131-40.
- [Google Scholar]
- Part 2: Early indicators of prognosis in severe traumatic brain injury. J Neurotrauma 2000. 2000;17:555.
- [Google Scholar]
- Glasgow coma scale motor score and pupillary reaction to predict six-month mortality in patients with traumatic brain injury: Comparison of field and admission assessment. J Neurotrauma. 2015;32:101-8.
- [Google Scholar]
- A review of the predictive ability of Glasgow Coma Scale scores in head-injured patients. J Neurosci Nurs. 2007;39:68-75.
- [Google Scholar]
- Mortality prediction in head trauma patients: Performance of Glasgow Coma Score and general severity systems. Crit Care Med. 1998;26:142-8.
- [Google Scholar]
- Meta-analysis of Glasgow coma scale and simplified motor score in predicting traumatic brain injury outcomes. Brain Inj. 2013;27:293-300.
- [Google Scholar]
- Predictive value of Glasgow Coma Scale after brain trauma: Change in trend over the past ten years. J Neurol Neurosurg Psychiatry. 2004;75:161-2.
- [Google Scholar]
- Usefulness of the abbreviated injury score and the injury severity score in comparison to the Glasgow Coma Scale in predicting outcome after traumatic brain injury. J Trauma. 2007;62:946-50.
- [Google Scholar]
- Outcome of brain trauma patients who have a Glasgow Coma Scale score of 3 and bilateral fixed and dilated pupils in the field. Eur J Emerg Med. 2009;16:153-8.
- [Google Scholar]
- External validation of the CRASH and IMPACT prognostic models in severe traumatic brain injury. J Neurotrauma. 2014;31:1146-52.
- [Google Scholar]
- Prognosis in moderate and severe traumatic brain injury: External validation of the IMPACT models and the role of extracranial injuries. J Trauma Acute Care Surg. 2013;74:639-46.
- [Google Scholar]


