
Translate this page into:
Perihematomal edema as predictor of outcome in spontaneous intracerebral hemorrhage
This is an open-access article distributed under the terms of the Creative Commons Attribution-Noncommercial-Share Alike 3.0 Unported, which permits unrestricted use, distribution, and reproduction in any medium, provided the original work is properly cited.
This article was originally published by Medknow Publications & Media Pvt Ltd and was migrated to Scientific Scholar after the change of Publisher.
Abstract
Background:
Spontaneous intracerebral hemorrhage (SICH) is a form of cerebrovascular accident with a very high rate of morbidity and mortality. The determinants of prognosis include the demographic, clinical, laboratory, and radiologic factors. It is long known that the hematoma size has a negative impact on the outcome in SICH. The influence of perihematomal edema (PHE) is not established to the extent same as that of hematoma volume. Hence, we planned this study to determine as to what role does PHE plays in the outcome in SICH.
Aim of the Study:
To evaluate the prognostic influence of absolute and relative edema (ratio of absolute edema to hematoma volume) in the patients of SICH.
Materials and Methods:
This is a prospective case-controlled study. A total of 44 patients were enrolled after excluding the confounding factors. The patients were evaluated and their disability was assessed using modified Rankin scale (MRS). The imaging was done in the interval between 24 and 72 h and the hematoma volume, absolute edema volume, and the relative edema were calculated. The outcome was reassessed at 12 weeks and defined as favorable if MRS < 3.
Results:
A total of 69 patients were found to be having SICH on imaging; however, 25 patients were excluded as they had one of the criterion for exclusion. Hence, only 44 patients were included in the study. On univariate analysis, none of the demographic characteristics of the patients, vascular risk factors, presenting complaints, blood pressure, Glasgow coma scale, and MRS at admission, laboratory parameters were not significantly different in the two outcome groups. The hematoma volume was significantly higher in the poor outcome group (P < 0.0001) and the relative edema was associated with a favorable outcome at 12 weeks (P < 0.0001). On multivariate logistic regression, the hematoma volume and relative edema were found to have effect on the outcome similar to that seen on univariate analysis.
Conclusion:
In SICH, a larger hematoma volume is a predictor of poor outcome and a relative edema is associated with a better functional status.
Keywords
Hematoma volume
modified rankin scale score
perihematomal absolute edema
relative edema
spontaoneous intracerebral hemorrhage

Introduction
Spontaneous intracerebral hemorrhage (SICH) (not related to trauma, thrombolysis, or anticoagulation) is a devastating form of cerebrovascular accident without any definite intervention to reduce the associated morbidity and mortality. There is a plethora of studies which have evaluated the predictors of outcome in SICH. Scoring systems utilizing the clinical and radiological parameters are in place to determine the prognosis. The acute mortality and morbidity in SICH have been linked to early hematoma expansion, cytotoxic and vasogenic perihematomal edema (PHE) formation, reduction in cerebral perfusion pressure, and raised intracranial pressure (ICP).[12] It is widely accepted that hematoma-induced neuronal damage is irreversible while that from PHE is reversible which makes the latter a potential therapeutic target. Hematoma volume is known to be a powerful predictor of outcome and also an independent predictor of absolute PHE volume.[3] PHE is visualized even when the imaging is performed within 3 h of onset. The major proportion of PHE is formed in initial 24 h and, after 72 h its growth occurs quite slowly for next 1 - 2 week. The pathogenesis of PHE is related primarily to three processes: Hematoma expansion and increased blood barrier permeability, clot retraction and activation of coagulation pathway and, finally, cytotoxic edema caused by erythrocyte lysis and hemoglobin breakdown products.[45] Factors which promote generation of PHE include hyperglycemia, hypertension, and ferritin level during the immediate postattack period.[67] The agents inhibiting N-methyl-D-aspartate receptor and desferroxamine which reduces the ferritin have been tried.[89] These studies underscore the increasingly recognized influence of PHE on the morbidity and mortality in patients of SICH. Studies determining contribution of absolute PHE volume and relative PHE (ratio of absolute PHE to hematoma volume) to morbidity and mortality are limited.[10] We undertook this study in our institution to determine the effect of PHE on the functional outcome in patients suffering from SICH.
Aim of the study
To determine relationship of absolute perihematomal and relative edema estimated on baseline imaging with disability status at 12 weeks from the onset of SICH.
Materials and Methods
This study was a prospective cohort study conducted from October 2010 to August 2012 in the Department of Neurology, King George's Medical University, Lucknow, Uttar Pradesh, India. Approval for the study was obtained from the Institutional Ethics Committee of the institution. Prior to enrollment an informed consent from the patients’ or their guardian was taken. Patients presenting with the clinical history suggestive of a cerebrovascular accident were subjected to screening with noncontrast computed tomography. The cases of SICH were evaluated.
Inclusion criteria
The newly diagnosed cases of SICH imaged within 24-72 h from the onset of the cerebrovascular accident.
Exclusion criteria
Intraventricular extension, infratentorial location, history of anticoagulation, bleeding disorders, hemorrhage related to intracranial neoplasm, presence of arterio-venous (AV) malformations, critically ill at admission, presence of end organ damage (congestive cardiac failure (CCF), respiratory failure, and others), and, need for cerebrospinal fluid shunting procedure or cranionotomy or surgical evacuation of intracerebral hematoma.
Study procedure
Calculation of hematoma volume, absolute PHE volume, and relative PHE volume was performed as follows:
-
First non-contrast computed tomography (NCCT) scans of the patients were collected on the day of imaging and then this data was stored in the Digital Imaging and Communications in Medicine (DICOM) format in a personal laptop
-
Generation of a three-dimensional (3-D) model and volume calculation: Volume of the desired sphere was calculated with help of Able 3D Doctors software, a 3-D rendering software, available on the internet as a free trial version. This software enabled free hand outlining of the perimeter of hematoma or PHE. The perimeter was outlined in each axial cut showing the hematoma/PHE. The marking of the outline was done manually using a digital pen. The 3D software stacked the data from each section, allowing 3-D volumetric construction of the hematoma and the sphere of PHE surrounding the hematoma [Figures 1 and 2]
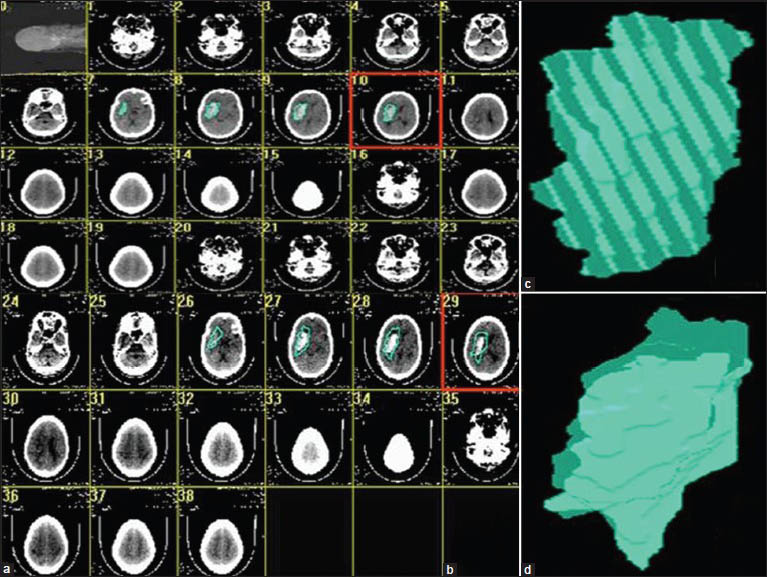 Figure 1
- (a) The axial cuts showing hematoma have been outlined, (b) The hematoma and the surrounding edema are outlined, (c) 3-Dimensional construction of the hematoma, (d) 3 dimensional construction of the sphere containing the edema and the hematoma
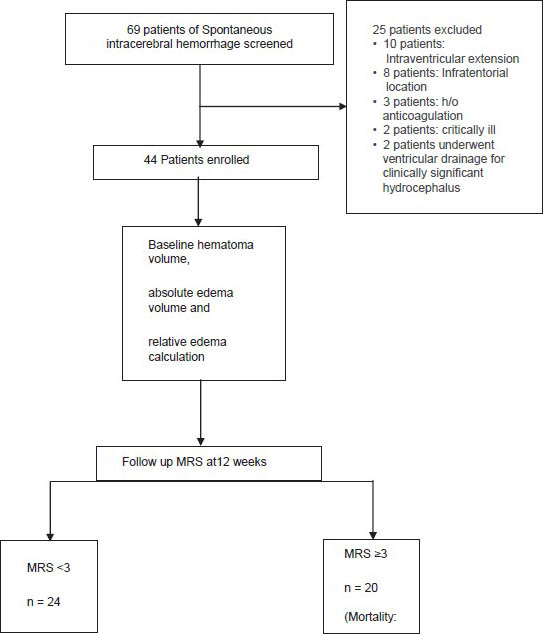 Figure 2
- Study flow chart
-
The absolute PHE volume was calculated by subtracting the volume of hematoma from the volume of the sphere of the PHE surrounding the hematoma
-
The relative PHE was derived from the ratio of absolute PHE volume to the hematoma volume [Figure 1].
Treatment
The management of patients was done as per the most recent guidelines laid by American Heart Association, 2010.[11]
-
-
The blood pressure was aggressively lowered when the systolic blood pressure (SBP) was >200 mm Hg or mean arterial blood pressure (MAP) was >150 mm Hg with frequent monitoring
-
When SBP > 180 and MAP > 130, the blood pressure was regularly monitored if the signs of raised ICP were evident. In the absence of signs of raised ICP blood pressure was reduced to SBP 160/90 mm Hg and MAP 110 mm Hg with close monitoring
-
-
Normoglycemia was maintained in diabetic and nondiabetic patients
-
Clinically evident seizures should be treated with antiepileptics. In select cases of depressed sensorium out of proportion to the severity of injury to brain received antiepileptics when epileptic discharges were evident on electroenecephalography
-
Ventricular drainage as treatment for hydrocephalus was considered in patients with progressively deteriorating level of consciousness and/or signs of brainstem compression
-
For patients presenting with lobar clots >30 mL and within 1 cm of the surface, evacuation of supratentorial intracerebral hemorrhage by standard craniotomy was considered.
Outcome assessment
The disability assessment was done at admission and again at 3 months using modified Rankin Scale score (MRS) (Appendix 1). Patients were classified according to the MRS as follows:
-
Favorable outcome: MRS < 3
-
Poor outcome: MRS ≥ 3.
Statistical analysis
Continuous data were summarized as mean ± standard deviation while discrete (categorical) in number and %. The continuous groups were compared by independent Student's t test, while categorical groups were compared by Chi-square (χ2) test. The Mann-Whitney U test was used to compare independent groups in case of nonnormal or heterogeneous data. Multivariate binary logistic regression analysis was used to assess significant predictors of favorable outcome. A two-tailed P < 0.05 was considered statistically significant. All the analysis was carried by using SPSS 16.0 version.
Results
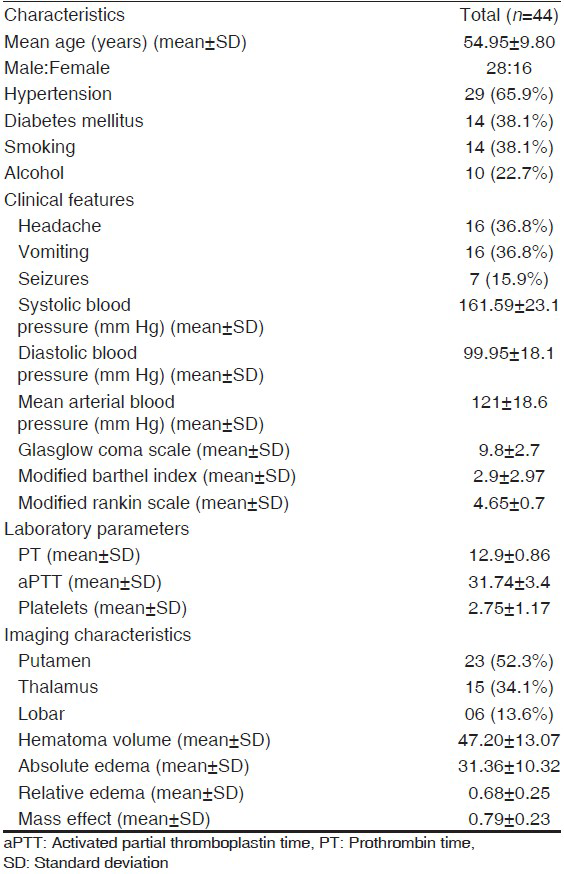
A total of 69 patients of SICH screened 25 patients had ≥1 features meeting the exclusion criteria. A total of 44 patients were enrolled in the study [Figure 2]. The baseline demographic, risk factors, and laboratory data of the patients are shown in Table 1. Mean hematoma volume for the primary patient population was 47.2 ± 13.07 mL; 86.4% of the hematomas were in deep anatomic locations. A mass effect (ventricular effacement/midline shift with line respect to pineal gland) was observed in 75% of the cases. The mean absolute PHE was 31.36 ± 10.32 mL, the minimum edema observed was 10.70 mL and the maximum was 58.0 mL. The mean relative edema in our study was 0.68 ± 024 ranging from 0.21 to 1.19.
Predictors of outcome
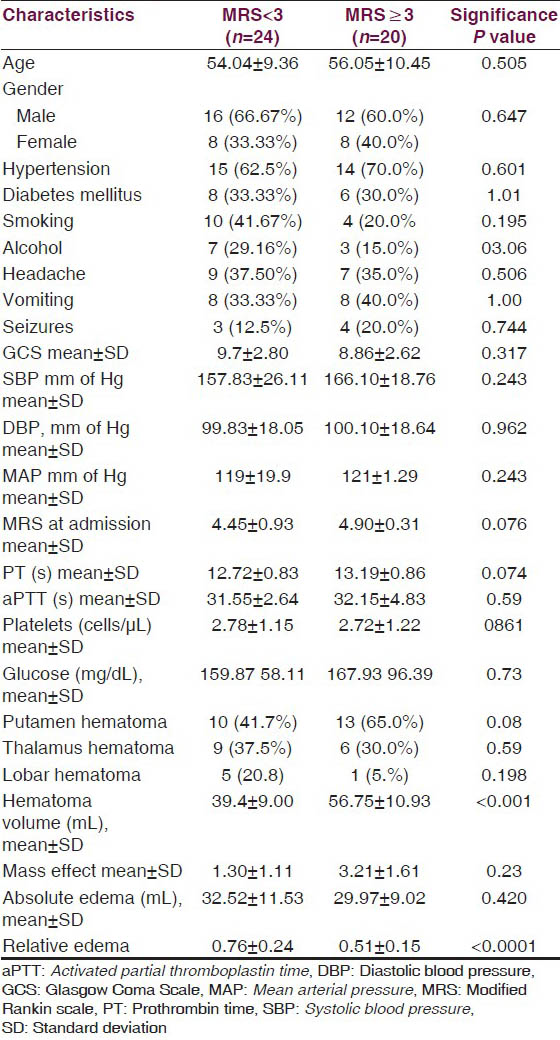
On univariate analysis, none of the demographic characteristics of the patients, vascular risk factors, presenting complaints, blood pressure, Glasgow Coma Scale (GCS), and modified MRS score at admission, laboratory parameters were not significantly different in the two outcome groups. The location of hematoma (deep vs. superficial) also did not have influence on the outcome. The hematoma volume was significantly higher in the group with 12 week MRS ≥ 3 (P < 0.0001). The absolute PHE value did not seem to influence the outcome as it was insignificantly different in two groups. The relative edema was associated with a favorable outcome (MRS < 3) at 12 weeks (P < 0.0001) [Table 2].
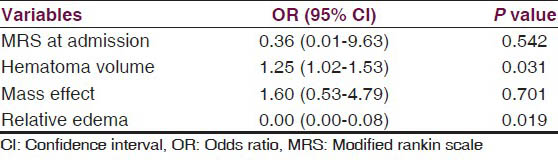
Analyzing the all significant predictors together, the multivariate logistic regression revealed hematoma volume and the relative edema were found to affect the outcome significantly. The volume of hematoma correlated with a poor outcome [odds ratio (OR) =1.25, 95% confidence interval (CI) =1.02 - 1.53, P = 0.031] and relative edema correlated with a favorable outcome at 12 weeks (OR = 0.00, 95% CI = 0.00 - 0.08, P = 0.019) [Table 3]. We tested the effect of relative edema on survival by comparing the survival duration in the two groups with respect to the median relative edema volume (0.68 mL), the P value (0.126) was not significant [Figure 3].
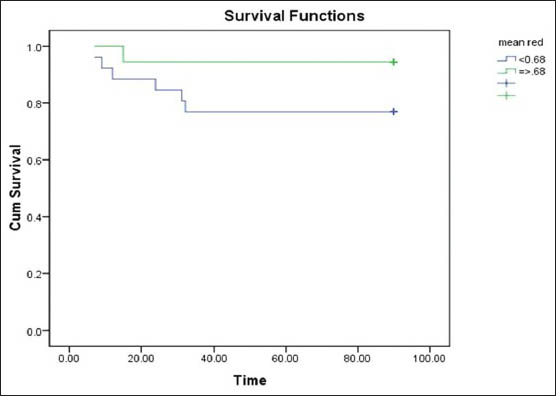
- Kaplan Meier Survival curve comparing survival in the two outcome groups with respect to mean relative edema
Discussion
SICH is a devastating form of cerebrovascular accident associated with severe morbidity and mortality. The impact of SICH has been correlated with the patient's characteristics including, demographic profile, vascular risk factors, baseline sensorium, blood pressure and glycemic control, coagulation parameters and imaging findings, particularly the hematoma volume and the PHE. The infratentorial SICH is different from the supratentorial by virtue of being enclosed in a smaller space and a high likelihood of damaging the vasomotor and respiratory centers which can lead to immediate mortality. Similarly, the intraventicular extension of the hematoma also has poor prognostic implications for SICH. The infratentorial location and intraventricular extension have been found to be independent predictors of poor prognosis.[12] Moreover, the intraventricular extension can lead to extravasation of cerebrospinal fluid into PHE and leading to overestimation of the latter. In the supratentorial SICH without intraventricular extension hematoma volume has been established outcome across multiple studies as the strongest independent marker for a poorer prognosis. However, there have been conflicting observations regarding the importance of the patient's demographic characteristics, the baseline clinical and laboratory parameters. Recently, interest has been generated regarding the effect of the PHE on prognosis as the measures modifying it may serve to improve the patient's functional status. Since the maximum PHE formation occurs in the initial 24 h and grows slowly after 72 h, we chose to correlate the PHE in the window period of 24-72 h with the outcome. We had excluded infratentorial SICH and those with intraventricular extension. The absolute PHE has not been found to be an independent predictor for 30 day mortality as it has been correlated with hematoma expansion which in turn independently predicts 30 day mortality. The effect of relative edema is variable depending on the time from the onset of symptoms at which it is determined.
In our study, none of the demographic characteristics the age, gender, and the vascular risk factors including diabetes mellitus, hypertension, tobacco, and alcohol consumption was correlated with 12-week functional status. The presenting complaints and the baseline parameters such as the blood pressure (systolic, diastolic, and mean arterial), GCS, glycemic status, coagulation, and bleeding parameters were also of no significant difference among the two outcome groups. Castellanos et al.,[13] in a study evaluating the predictors of outcome in SICH had found that male gender and preexisting arterial hypertension predicted a poor prognosis. Claude et al.,[14] had established a scoring system for prognosis in SICH which comprised of age, GCS at presentation, location of hemorrhage, presence/absence of intraventricular hemorrhage, and the volume of hematoma. In their study GCS < 5 predicted a 97.1% mortality and age >80 years was correlated with a higher 30 day mortality rate compared with the younger patients. However, another recent study by Gebel et al., did not draw similar conclusions. In their study the patients’ characteristics, baseline clinical and laboratory parameters were no different in patients with favorable and unfavorable outcome.[13] It is hypothesized that high arterial blood pressure at the time of admission would promote initial hematoma expansion.[15] An elevated blood pressure at admission (MAP ≥ 145) had been correlated with worse morbidity and mortality by Dandapani BK et al.[15] The subsequent studies have not showed similar effect of blood pressure on outcome.[1617]. Melamed[18] was the first to demonstrate that reactive hyperglycemia is associated with poor outcome. A meta-analysis included the studies which have evaluated the glycemic status within 24 h of onset in relation to short term prognosis (up to one month).[19] It concluded that acute hyperglycemia predicts a poor short-term outcome; however, a prospective randomized control trial was deemed necessary in this regard.
Among the radiological characteristics the frequency of location of hematoma (deep vs. lobar) was no different in two groups of outcome. Claude et al., had demonstrated that deep location hematoma were significantly more in the patients with poor prognosis. However, once again Gebel et al., did not find such correlation in their study. A larger hematoma volume was found to be significantly and independently associated with a poor outcome in our subjects. In various studies, hematoma volume has been found to be an independent risk factor for 30 day mortality. Castellano et al., found a higher median hematoma volume 78.2 mL in patients with poor outcome compared with 58.2 mL in patients with favorable outcome. Claude et al., had defined hematoma volume greater than 30 mL in supratentorial SICH as a marker of high 30 day mortality. Gebel et al., found in their study a poor functional outcome at 12 weeks when the hematoma volume was high. The volume of absolute PHE was not different in the two outcome groups in our study. The PHE is primarily related to the hematoma volume and is not an independent predictor of outcome. The majority of the edema formation occurs during initial 24 h and its pathogenesis is considered to be secondary to hematoma expansion which disrupts the blood brain barrier leading to transudation of plasma into interstitium along the oncotic gradient. Hence, this is probably why the absolute edema does not hold significance in prediction of prognosis. Relative PHE was significantly different in the two groups in our study. A larger ratio of edema to hematoma volume was noticed in the group with favorable outcome (MRS < 3) at 12 weeks. This was contrary to the hypothesis that a higher edema would be associated with unfavorable functional outcome.[20] Our observation is in agreement with Gebel et al., they too had found that a higher relative edema was associated with a better function status at 12 weeks. The one plausible explanation to this phenomenon could be that the hematoma edema in initial hours may obliterate the shell of edema surrounding it. Since hematoma volume is directly related to morbidity and mortality, edema higher in relation to hematoma would probably signify lesser hematoma expansion and indirectly a better functional status.[15] The relative edema did not seem to affect the survival function in our patient as assessed by Kaplan-Meier survival curve.
Conclusion
In our study, the demographic features, vascular risk factors, disability and GCS at admission, and laboratory parameters did not exert any influence on the functional outcome. The hematoma volume predicted a poor outcome, while a relative edema was associated with a good functional status at 12 weeks.
Source of Support: Nil.
Conflict of Interest: None declared.
References
- Does early medical intervention have a role in the management of intracerebral haemorrhage? Int J Clin Pract. 2008;62:633-41.
- [Google Scholar]
- Mechanisms of brain injury after intracerebral haemorrhage. Lancet Neurol. 2006;5:53-63.
- [Google Scholar]
- Lack of association between early edema and outcome in spontaneous intracerebral hemorrhage. Stroke. 1999;30:249.
- [Google Scholar]
- Chronological changes of perihematomal edema of human intracerebral hematoma. Acta Neurochir Suppl. 2003;86:445-8.
- [Google Scholar]
- Temporal profile of matrix metalloproteinases and their inhibitors after spontaneous intracerebral hemorrhage: Relationship to clinical and radiological outcome. Stroke. 2004;35:1316-22.
- [Google Scholar]
- Association between serum ferritin level and perihematoma edema volume in patients with spontaneous intracerebral hemorrhage. Stroke. 2008;39:1165-70.
- [Google Scholar]
- Iron-related brain damage in patients with intracerebral hemorrhage. Stroke. 2010;41:810-3.
- [Google Scholar]
- Addition of intravenous N-methyl-D aspartate receptor antagonists to local fibrinolytic therapy for the optimal treatment of experimental intracerebral hemorrhages. J Neurosurg. 2007;106:314-20.
- [Google Scholar]
- Deferoxamine mesylate: A new hope for intracerebral hemorrhage: From bench to clinical trials. Stroke. 2009;40:S90-1.
- [Google Scholar]
- Relative edema volume is a predictor of outcome in patients with hyperacute spontaneous intracerebral hemorrhage. Stroke. 2002;33:2636-41.
- [Google Scholar]
- American Heart Association Stroke Council and Council on Cardiovascular Nursing. Guidelines for the management of spontaneous intracerebral hemorrhage: A guideline for healthcare professionals from the American Heart Association/American Stroke Association. Stroke. 2010;41:2108-29.
- [Google Scholar]
- Relation between blood pressure and outcome in intracerebral hemorrhage. Stroke. 1995;26:21-4.
- [Google Scholar]
- Predictors of good outcome in medium to large spontaneous supratentorial intracerebral haemorrhages. J Neurol Neurosurg Psychiatry. 2005;76:691-5.
- [Google Scholar]
- The ICH score: A simple, reliable grading scale for intracerebral hemorrhage. Stroke. 2001;32:891-7.
- [Google Scholar]
- Relation between blood pressure and outcome in intracerebral hemorrhage. Stroke. 1995;26:21-4.
- [Google Scholar]
- Intensive blood pressure reduction in acute cerebral haemorrhage trial (INTERACT): A randomised pilot trial. Lancet Neurol. 2008;7:391-9.
- [Google Scholar]
- Prognostic value and determinants of first-day mean arterial pressure in spontaneous supratentorial intracerebral hemorrhage. Stroke. 1997;28:1396-400.
- [Google Scholar]
- Reactive hyperglycaemia in patients with acute stroke. J Neurol Sci. 1976;29:267-75.
- [Google Scholar]
- The effects of acute hyperglycemia on short-term prognosis in patients with primary intracerebral hemorrhage: A meta-analysis. Int J Cerebrovasc Dis. 2010;18:411-6.
- [Google Scholar]
- Significance of perihematomal edema in acute intracerebral hemorrhage: The INTERACT trial. Neurology. 2009;73:1963-8. We agree with the coorrection
- [Google Scholar]
Appendix 1
Modified Rankin Scale score – Score description
No symptoms at all. No significant disability despite symptoms; able to carry out all usual duties and activities. Slight disability; unable to carry out all previous activities, but able to look after own affairs without assistance. Moderate disability; requiring some help, but able to walk without assistance. Moderately severe disability; unable to walk without assistance and unable to attend to own bodily needs without assistance. Severe disability; bedridden, incontinent, and requiring constant nursing care and attention. Dead.
Total (0-6): _______


