
Translate this page into:
Clinical profile of children with developmental delay and microcephaly
This is an open-access article distributed under the terms of the Creative Commons Attribution-Noncommercial-Share Alike 3.0 Unported, which permits unrestricted use, distribution, and reproduction in any medium, provided the original work is properly cited.
This article was originally published by Medknow Publications & Media Pvt Ltd and was migrated to Scientific Scholar after the change of Publisher.
Abstract
Aim:
To study the profile of children with developmental delay and microcephaly.
Materials and Methods:
Children attending child development clinic with developmental delay were evaluated as per protocol. Z scores of head circumference were calculated using WHO charts. Clinical, radiological and etiological profile of those with microcephaly and those without was compared.
Results:
Of the 414 children with developmental delay 231 had microcephaly (z score ≤ -3). Mean age of children with microcephaly was 35.1 ± 27.9 months (range 4-184), males (72.7%). Comorbidities were epilepsy (42.9%), visual abnormality (26.4%), hearing abnormality (16.9%). Mean DQ was 29.75 + 17.8 in those with microcephaly was significantly lower compared to the rest (P = 0.002). Secondary microcephaly was associated with cerebral palsy in 69.7%. Other causes were congenital infections (4), inborn error of metabolism (3), post-meningoencephalitis (5), malformations (12), and syndromic (13). Neuroimaging was done in 118 (51.1%) cases of which 104 (88.1%) were abnormal. On comparison children with microcephaly had more epilepsy, lower developmental quotient, vision abnormalities findings as compared to normocephalic children with developmental delay (P > 0.05).
Conclusion:
Microcephaly was associated with lower, DQ, higher comorbidities in children with developmental delay. Spastic CP is commonly associated with microcephaly.
Keywords
Cerebral palsy
developmental delay
etiology
microcephaly

Introduction
Microcephaly was defined as head circumference less than 3 SD or Z score <-3.[1] Microcephaly is observed only among 0.1% of general asymptomatic population but its prevalence is 15-20% in children with developmental delay as seen in studies from the west.[23] The risk factors, causes, comorbidities and developmental outcome in children with microcephaly have not been reported from Northern India. Neuroimaging abnormalities in children with microcephaly has been reported in few studies, mostly from outside India.[4567] Hence we planned out to study clinicoradiological profile of children with microcephaly and developmental delay attending our child development clinic.
Materials and Methods
The study was conducted over 3 years (April 2007-April 2009) among 414 children attending child development clinic at a tertiary care hospital in North India for developmental delay. Approval was taken from the hospital ethical committee. A written informed consent was taken from the parents. The head circumference was measured by placing a non-stretchable tape around the cranial vault to include the widest part of the forehead and the most prominent part of the occipital area to arrive at the largest possible measurement.[8] Microcephaly was defined as head circumference less than 3 SD or Z score <-3.[1] Z scores were calculated using WHO charts. Detailed history (antenatal, birth, and developmental), clinical, and neurological examination was carried out as per standard protocol. Relevant investigation were planned as per the protocol. Development Quotient (DQ) in children less than 5 years was determined by Denver II and in children greater than 5 years IQ was determined using Malin's intelligence test. DQ/IQ of <70 or developmental delay in two or more fields below 2 S.D. was classified as developmental delay/mental retardation.
Birth asphyxia was defined as on history of delayed cry associated with seizures, feeding difficulty or cyanosis or hospitalization in home deliveries or Apgar scores <7 in hospital deliveries. Birth documents were verified wherever possible. Attempts were made to determine the etiology of microcephaly using the clinical profile including measurements of head sizes in the immediate family, and investigations that were individualized for each child. Visual abnormalities like squint, nystagmus, refraction errors, optic atrophy, retinopathies, vision loss, etc., were noted and fundus examination were done in most of the cases. Visual-evoked potentials (VEP) studies were done whenever required. Hearing abnormalities include hearing loss detected on BERA or audiometry, structural anomalies and malformations.
Causes were divided initially into five groups, defined as follows: (1) idiopathic, that is, no cause could be recognized from the history, examination, or investigations, and there were no other abnormal findings; (2) familial, that is, a parent and/or sibling had a head circumference at or below the second percentile; (3) syndromic, that is associated with known syndrome (4) Malformations (5) symptomatic, that is, following a pathogenic event; or (6) mixed, that is, ≥2 of the aforementioned-cerebral palsy was associated with this group. MRI (3 Tesla) was advised in all cases. Metabolic (thyroid profile, TORCH, urinary screening for aminoaciduria, arterial blood gases, Lactate, Serum ammonia, blood sugar) and chromosomal investigations carried out whenever possible and indicated.
Data were analyzed by using SPSS 17.0 (SPSS). Various factors and outcomes in children with microcephaly i.e., z score<-3 were compared with the rest using Chi-square test. P < 0.05 was taken as significant.
Results
Of the 414 children who attended child development clinic, 231 (55.8%) had microcephaly (z-score ≤ 3SD), head circumference between −2 S.D and −3 S.D was seen in 94 (22.7%). Among the children with microcephaly there was male preponderance (72.7%), mean age of 35.1 ± 27.9 months (range 4-184 months). Most of the children i.e., 88.7% were less than 5 years, 9% between 5 and 10 years and 2.1% were more than 10 years. Mean age (SD) of detection of developmental delay by parents was 8 ± 14.06 months. Risks factors were birth asphyxia (50.2%), neonatal jaundice (19.9%) and preterm gestation (18.6%). Other high-risk maternal and obstetric factors (PIH, APH, infections, chorioamnionitis, high maternal age, gestational diabetes, maternal anticonvulsants, severe anemia, maternal hypothyroidism, oligohydroamnios, and conception with infertility treatment, maternal jaundice, and bad obstetric history) were present in 6% of children. Comorbidities included epilepsy in 42.9% mostly generalized type (92.9%). Half of children (26.4%) had visual abnormalities and one fifth (16.9%) hearing abnormalities.
For comparison we compared children with microcephaly i.e., Z score <−3 SD with rest. Table 1 shows comparison of demographic, clinical profile of children with Z-score <−3, those between −2 and −3 and those >−2. Significantly lower Developmental Quotient and more generalized epilepsy was seen in children with microcephaly when compared with the rest P = 0.01 and 0.04, respectively.Rest of the factors were similar in the two groups (P > 0.05).
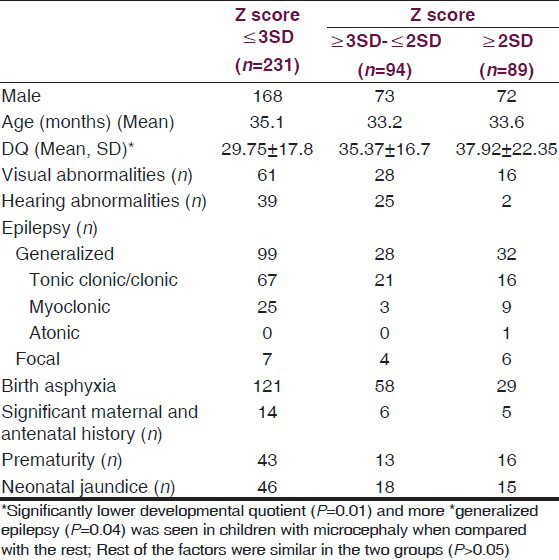
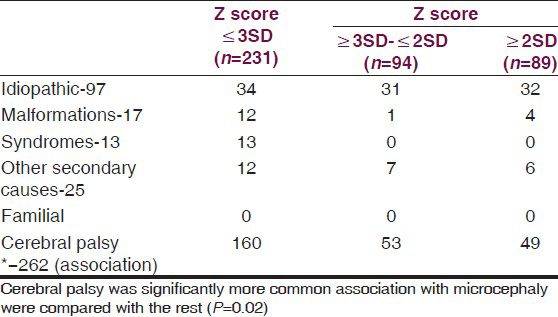
Table 2 shows the diagnosis in the groups. Cerebral palsy was significantly more commonly associated in the microcephalic group (P = 0.02). Secondary microcephaly was due to cerebral palsy associated with perinatal hypoxia and periventricular leucomalacia was seen in 69.3% of children. Spastic cerebral palsy was most common (Spastic-95.7%, hypotonic-3.1%, dystonic 1.2%). Among the spastic cerebral palsy quadriplegia was seen in 83.5%, diplegic-11.4%, hemiplegic-4.4%, monoplegia-0.6%). Other causes of secondary microcephaly were intrauterine TORCH infections (4), inborn error of metabolism (3), post-meningoencephalitis (5), and cerebral non-syndromic malformations (12). Syndromic primary microcephaly was seen in 13 (Down syndrome-11, rubystien taybi-1, Sjorgen-Larsson syndrome-1). No child was diagnosed as familial microcephaly. In 14.7%, no etiology was found.
Metabolic screening was done in 30 patients, biotidinase deficiency was diagnosed in two, glutaric-aciduria type 1 in one and arginase deficiency in one. Rest did not have any conclusive result on metabolic screening and tandem mass spectroscopy.
MRI abnormalities were seen in 104 of the 118 children with microcephaly who underwent imaging. Main findings were evidence of hypoxic ischemic encephalopathy as periventricular leucomalacia, encephalomacia and white matter damage in 42.7%. Cerebral malformations were seen in 9 (lissencephaly-2, focal cortical dysplasia-2, cerebellar cysts-1, corpus callosal agenesis-2, polymicrogyria-1, Davidoff mason syndrome-1). Rest of the findings were non-specific changes of cerebral atrophy, gliosis and infarct (28.1%), obstructive hydrocephalus with and without meningitis (6.7%), basal ganglion lesions (4.8%) and others (metachromatic leukodystrophy-1, adreno leukodystrophy-1, cerebellar degeneration-3, CV junction anomaly-1, Hemorrhage-2). In the normocephalic children malformations included (colpocephaly-1, porencephaly-1, Lissencephaly-2, focal cortical dysplasia-1, Arachnoid cyst-1, corpus callosal agenesis-2).
We have shown number of children with Z-score between −2 and −3 separately as some articles have defined microcephaly as head circumference less than −2. Now a definition of <3 SD is recommended. In our study there was no difference if children with less than −2SD were compared with the rest.
Discussion
Only few studies are available till date in children with microcephaly, their etiology, developmental outcome, comorbidities, and neuroimaging abnormalities.[8] Study from India in 1995 by Prasad et al.,[9] on etiologies of 82 microcephalic children with developmental delay concluded definite etiology in 56%, genetic causes being most common. Prenatal etiology was more frequent than birth and neonatal causes. Western Study by Wattenberg et al.,[2] where 393 children with developmental disabilities were studied had shown similar results. One-sixth (15.4%) of the children had microcephaly. In our study microcephaly was detected in large percentage (55.8%) which may be due to referral policies and etiological profile, cerebral palsy being more common in our population. Microcephalic children were more likely to be associated with spasticity, growth retardation, cerebral palsy, epilepsy, strabismus, and neuroimaging abnormalities (P ≤ 0.001) in the study by Wattenberg et al.,[2] Similar findings were seen in our study.
Etiological profile of microcephaly reveals genetic etiologies (15.5-53.3%), metabolic disorders (1%) and cerebral palsy (20%).[8] In our study and other Indian reports burden of cerebral palsy is higher (2-5/1000 children).[10] Indian children with cerebral palsy were studied by Prasad R et al,[11] in 2010. Of the 102 children reported observations were prematurity (18%), spastic quadriplegia (34%), severe birth asphyxia (62%), developmental delay (82%), epilepsy (52%), visual abnormalities (29%), and MRI abnormalities (89%). MRI findings were suggestive of hypoxic ischemic changes in majority (76.1%), malformations (3%) and focal lesions (6%). However, comparisons with our results is not directly possible because they did not analyse the children according to presence or absence of microcephaly. Our study had comparable results. Profile of cerebral palsy by Venkateswaran et al.,[12] had similar results with visual impairment (80%), hearing deficit (40%), epilepsy (47%), birth asphyxia (P = 0.005), and microcephaly (58.7%).
Eighty percent of children with microcephaly (SD < 3) had neuroimaging abnormalities as compared to 43% in those with z-scores between 2-3SD in study by Custer et al.[7] It also concluded neuroimaging abnormalities in children with head circumference <2SD had lower DQ scores as compared to those without neuroimaging abnormalities thus implicating abnormal neuroimaging results correlate better with developmental performance than degree of microcephaly. In our children with cerebral palsy, microcephaly was a risk factor for mental retardation, epilepsy, neuroimaging abnormalities, and vision abnormalities. Developmentally delayed children with microcephaly had significantly higher epilepsy, neuroimaging abnormalities and lower developmental quotient. No comparison could be made in microcephalic children with and without developmental delay due to insignificant number of children with normal DQ.
According to American Academy of Neurology[8] recommendation neuroimaging should be carried out in all children with microcephaly, it helps in identifying structural anomalies (evidence level C). Our study provides further evidence for this recommendation. Our results are an evidence for association of cerebral palsy and mental retardation with microcephaly.
Thus, we conclude that North Indian children with developmental delay and microcephaly are commonly associated with cerebral palsy. Risk of comorbidities like vision, hearing, developmental delay, and epilepsy increases significantly with presence of microcephaly. This data will help in planning preventive, curative, and rehabilitative services in this area.
Source of Support: Nil.
Conflict of Interest: None declared.
References
- Significance of microcephaly among children with developmental disabilities. J Child Neurol. 2002;17:117-22.
- [Google Scholar]
- Mental retardation and head growth abnormalities. J Pediatr Psychol. 1982;7:149-56.
- [Google Scholar]
- Contribution of MRI in the evaluation of microcephaly. Neuropediatrics. 1991;22:184-9.
- [Google Scholar]
- Neurodevelopmental and neuroimaging correlates in non syndromic microcephalic children. J Dev Behav Pediatr. 2000;21:12-8.
- [Google Scholar]
- Practice Parameter: Evaluation of the child with microcephaly (An Evidence-based Review): Report of the quality standards subcommittee of the American academy of neurology and the practice committee of the Child Neurology Society. Neurology. 2009;73:887-97.
- [Google Scholar]
- The etiologic patterns in microcephaly with mental retardation. Indian J Psychiatry. 1995;37:70-80.
- [Google Scholar]
- Clinical spectrum of cerebral palsy in North India: An Analysis of 1000 cases. J Trop Pediatr. 2002;48:162-6.
- [Google Scholar]
- Magnetic resonance imaging, risk factors and comorbidities in children with cerebral palsy. J Neurol. 2011;258:471-8.
- [Google Scholar]
- Comorbidities and clinical determinants of outcome in children with spastic quadriplegic cerebral palsy. Develop Med Child Neurol. 2008;50:216-22.
- [Google Scholar]


