
Translate this page into:
Investigation of in vitro cytotoxicity of the redox state of ionic iron in neuroblastoma cells
This is an open-access article distributed under the terms of the Creative Commons Attribution-Noncommercial-Share Alike 3.0 Unported, which permits unrestricted use, distribution, and reproduction in any medium, provided the original work is properly cited.
This article was originally published by Medknow Publications & Media Pvt Ltd and was migrated to Scientific Scholar after the change of Publisher.
Abstract
Background:
there is an intimate relation between transition metals and cell homeostasis due to the physiological necessity of metals in vivo. Particularly, iron (ferrous and ferric state) is utilized in many physiological processes of the cell but in excess has been linked with negative role contributing in many neurodegenerative processes.
Objective:
the aim of this study was to investigate which oxidation state of ionic iron (Ferrous (II) versus Ferric (III)) is more toxic to neuronal cells (SHSY5Y).
Materials and Methods:
The neuroblastoma (SHSY5Y) cells were exposed to varying concentration of ferric and ferrous iron. Morphological studies using immunofluorescence staining and microscopic analysis as confirmed by intracellular glutathione (GSH) test demonstrated oxidative stress to cells in iron microenvironment. In addition, MTT assay was performed to evaluate the viability and metabolic state of the cells.
Results:
the results showed that ferrous form has significantly higher toxicity compared to the ferric ionic state of higher concentration. In addition, microscopic analysis shows cell fenestration at higher concentrations and swelling at intermediate ferric dosages as demonstrated by atomic force microscopy (AFM). Interestingly, the addition of a differentiation inducing factor, trans-retinoic rcid (RA) retains significant viability and morphological features of the cells irrespective of the ionic state of the iron. AFM images revealed clustered aggregates arising from iron chelation with RA.
Conclusions:
the results indicate that Fe (II) has more toxic effects on cells. In addition, it could be an interesting finding with respect to the antioxidant properties of RA as a chelating agent for the neurodegenerative therapeutics.
Keywords
AFM
glutathione
immunostaining
metallomics
MRI

Introduction
Nature utilizes transition metals for its cellular functions on the account of versatility in coordination chemistry involved in catalytic functions of the cells.[1] Iron is a prominent among the series of indispensable metals that play vital role in cellular physiology, based upon its ability to switch between the two most common redox states: ferrous (Fe (II), reduced) and ferric (Fe (III), oxidized). Ferric is the most stable and prevalent oxidation state of iron that is used by most of the cells.[23] At physiological pH, ferric iron (unbound to chelators and sequestering agents) exists as insoluble ferric hydroxide involving a complex chemistry or may be reduced to its ferrous form in the presence of strong reducing agents, such as ascorbate (vitamin C).[4] Under normal cellular circumstances, ferric is preferred and nontoxic form of iron whereas ferrous is chemically more reactive species of the two redox states of iron. The ferrous state participates in the Haber–Weiss–Fenton chemistry that gives most of the hydroxy free radicals and reactive oxygen species (ROS) responsible for cellular destruction.[56] In a cellular system, nonheme iron pool: Fe (II)/Fe (III) is kept under surveillance via mutual interconversion of binding transit iron pool (Fe (II)) with ferritin or by conversion of ferrous to ferric via ferroxidase as
Fe (II)* → Fe (III), *Ferroxidases (Ceruloplasmin) and transported as diferric-transferrin (Fe2-Tf)
Fe (III)* → Fe (II), * Ferrireductase and stored by binding with ferritin.[7]
Among cellular functions mediated via the two redox state of iron, transport (oxygen, Hb-Fe (II)), electron transfer (Fe (II) and Fe (III) in photosynthesis), neurotransmitter, and biomolecular synthesis (DNA, Hb, proteins; Fe (II) and Fe (III)) are the landmark physiological processes where two transition states of iron play vital role. However, in excess or unregulated episodes of iron in the biological system may turn harmful to cells. In recent years, many neurological disorders have been characterized with iron overload and subsequent reactive oxygen species (OH, NO, O2-·) causing damage to neuronal biomolecular architecture (DNA, proteins, membrane lipids) and function (plasticity and anatomy).[8] Therefore, studies related to iron species mediated cellular damage via wandering free radical in cellular system is the immense need of current metallobiology research.[5] Particularly, there is a lack of experimental studies providing comparative cytotoxic assessment of ferrous and ferric ionic state in cellular system with emphasis to neuronal cells concerning the role of metallomics in current neurological disorders.[5] Up until now, magnetic resonance imaging (MRI) and other radiological techniques have been estimated as gold standard to characterize the degree of plaque formation and quantification of the extent of neurodegeneration via ferrous and ferric state.[910] Recently, we have reviewed in detail about anomalous venous blood flow and related iron depositions mediated by chronic cerebrospinal venous insufficiency (CCSVI) and plaque formation in multiple sclerosis (MS) that has elucidated qualitative picture of cerebrospinal plaques via the radiological approach.[11] In another study, Meguro et al. had shown cellular and subcellular localization of nonheme ferrous and ferric iron in rat brain using perfusion-Perls and Turnbull method.[12] However, no report elucidated the damage by quantifying redox state of iron in vitro albeit some recent reports give an overview of subcellular localization of ferrous and ferric state.[13] Considering the impact of redox states of iron on cellular metabolism as a micronutrient, there is immense need to evaluate the silver line as nutrient or poison between the ferrous and ferric ionic forms in the dose dependent manner.[14] In recent years, the field of metallomics evolved, proliferated and debated strongly the need of dose screening of transition metals popularly participating in neurological dysfunctions.[15]
Here, we report a facile in vitro model to evaluate the effect of two nonheme redox state of iron to quantify cell metabolic state; viability and morphological analysis. In this study, we treated the SHSY5Y cells with subphysiological-optimal concentration of ionic iron (II) as ferrous and iron (III) as ferric. We report in detail, SHSY5Y viability, metabolic state (via MTT assay), oxidative stress (glutathione assay), and morphological features using microscopic analysis (confocal, phase contrast, AFM) due to ionic iron treatment. In addition, we investigated the role and mechanism of RA mediated cellular toxicity inhibition using AFM.
Materials and Methods
Cell culture, iron treatment, and control experiments
The human neuroblastoma cell line, SHSY5Ycell line, was obtained from ATCC (CRL 2266) and was cultured in Ascorbate free DMEM with 10% fetal bovine serum, 0.25 mg/mL Amphotericin B, 100 U/mL penicillin, and 100 mg/mL streptomycin in 5% (v/v), CO2 balanced moist air at 37°C. Subconfluent cells on the tissue culture flask were dissociated using trypsin/EDTA (0.5% trypsin, 5.3 mM EDTA) and plated (70,000 cells/cm2) on the culture dish. Trans-retinoic acid (RA, St. Louis, MO) at 10 μM were added in the culture to differentiate SHSY5Y cells(15). For the assessment of cytotoxicity of Fe (II) (FeSO4.7H2O) and Fe (III) (FeCl3), salts (SIGMA, St. Louis, MO) were dissolved in sterilized in the concentration range between 1–100 μM. We performed some control experiments as reference with SHSY5Y cells without any iron treatment for MTT and glutathione assay.
Toxicity evaluation (viability and intracellular glutathione (GSH) test)
Viability of SHSY5Y cells was measured by the MTT (Sigma, USA) assay. SHSY5Ycells were cultured in 24 well culture plates. At the end of the experiments, the MTT solution was added to fresh culture medium without phenol red and serum at 10% of the total culture volume according to the manufacturer's instructions. After an additional 2 h incubation at 37°C in CO2 incubator, 10% SDS/0.01 N HCl was added to each well and the absorbance at 590 nm of solubilized MTT formazan products was measured on the next day using a dual beam spectrophotometer (JASCO V-570). For GSH content, after treatments of differentiated SHSY5Y cells with iron, the cells were washed with 0.9% NaCl (0.5 mL) solution. After freezing overnight, cells were collected by scraping and homogenized by sonication for 5 s (10% maximum power, Sonopuls HD 2200, Bandelin electronic, Germany). GSH content in cell homogenates was determined using the GSH assay kit as per product usage instructions (GSH assay kit, Wako, Tokyo).
SHSY5Y, Fe (II and III) and RA interaction imaging with AFM
The cell culture progress was monitored routinely and images were taken with a DS-5M Nikon camera mounted on a Nikon Eclipse TE200 phase-contrast inverted microscope using ×10 objective. SHSY5Y cells cultured on glass coverslips were fixed using glutaraldehyde (2% in PBS) at room temperature during 20 min. Cells were washed twice with PBS for 5 min, quickly rinsed with deionized water to remove salt and subsequently dried under a nitrogen stream. AFM using a Nanoscope Multimode IV (Veeco Instruments) in tapping mode with a silicon nitride tip was utilized for the imaging. The system includes an integrated optical microscope allowing repositioning of the AFM tip over the cells. Section analyses were made using the home built Lab View software. For the iron and RA interaction, we dissolved and incubated the ionic iron with a RA solution in deionized water and deposited over nanostructured (NS) TiOx-coated glass coverslips, taking advantage of NS-TiOx affinity for the protein adsorption that can be correlated with the change in the nanostructure surface morphology upon protein clustering.[1617]
Confocal microscopy and immunohistochemical analysis
Immunofluorescence experiments were performed after 3 days of cell plating. Samples were fixed and immunostained for F-actin (a membrane-cytoskeletal protein). For cell staining we used the following antibodies: phalloidin (Alexa fluor 488 phalloidin, Molecular Probes). Briefly, cells were rinsed twice with PBS and fixed with 4% paraformaldehyde (SIGMA) in PBS for 15 min; after washing, cells were permeabilized with 0.1% Triton X-100 (SIGMA) for 10 min, blocked with 2% BSA (Albumin Bovine Fraction, Biochemical) at room temperature, stained with Alexa fluor 488 phalloidin. Samples were rinsed with PBS and mounted with Mowiol 4–88 (Calbiochem). Cell morphology was routinely assessed and images of different fields were acquired with a fluorescence microscope (Leica TCS SP2) with AOBS 20×X dry magnification objective. The images were acquired and elaborated with Adobe Photoshop 7.0 program (Adobe System Incorporated).
Neurite quantifications and statistical analysis
Acquired images were visualized using ImageJ (Bethesda, MD) and image analysis for the neuritogenesis was done with ImageJ NIH image processing software and Microsoft Excel. We analyzed 10 images from each samples type (control and experimental) from three independent experiments performed in triplicates (n = 3). The data shown in the figures represent mean values ± SD unless otherwise stated; means were calculated from triplicate repeat experiments. Statistical analysis was performed using one-way ANOVA (SigmaStat software package, Jandel Corp., San Rafael, CA). Statistical significance has been set at P £ 0. 05 and indicated in text as * (P £ 0. 01 indicated as **), expressing statistical differences between SHSY5Y viability treated with Fe (II) and Fe (III) samples, in the presence or absence of RA.
Results
MTT assay and glutathione (GSH) content determination
The MTT proliferation assay was performed to assess the viability of the cells to determine cytotoxicity. The iron treatment of SHSY5Y cells shows dose-dependent decrease in cell proliferation as it is evident from category plot in Figure 1a. Cell number and viability show decrease with increased concentration of Fe (II) and Fe (III) treatments to SHSY5Y cells. The decrease observed is statistically significant comparing lowest (1 μM) and highest (100 μM) treatment doses. However, Fe (III) shows similar cell viability at intermediate and lower concentration, while there is difference with respect to Fe (II) against Fe (III) treatment indicating that the reduced state of iron has a more vulnerable effect on neuronal cells than the oxidized state.
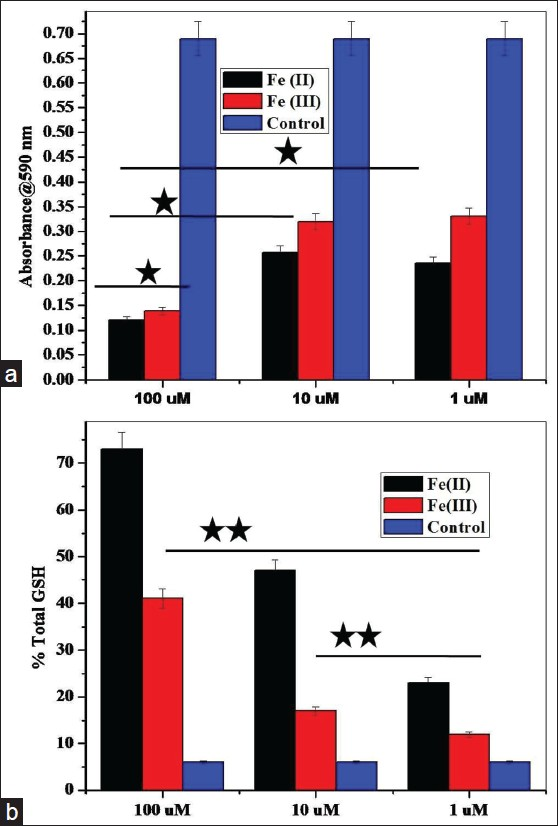
- MTT and Glutathione assay to measure oxidative stress in treated SHSY5Y cells. (a) MTT assay based comparative cytotoxicity category plot of Fe (II) vs. Fe (III) in SHSY5Y cells at different doses of cell treatment (*P ≤ 0.05) in presence of control. (b) Intracellular glutathione assay to test the level of oxidative stress in SHSY5Y cells at different concentrations of ionic iron (*P ≤ 0.05; **P ≤ 0.01). Mean values and standard deviations were calculated on the basis of three independent experiments, each performed in triplicate (n = 3). Error bars represent standard deviations of mean values
Moreover, Fe (II) toxicity observed is statistically higher compared to Fe (III) even at intermediate doses as shown in Figure 1a. At higher concentration, both redox states have shown statistically higher toxicity with respect to moderate and lower treatment doses. The results indicate that reduced divalent state of iron is more toxic to SHSY5Y cells compared to the trivalent oxidized state as is statistically evident from metabolic and viability indices (P £ 0.05). Figure 1b shows the result of the glutathione test and from category plot it is evident that SHSY5Y cells treated with Fe (II) ionic iron at higher and intermediate doses perceive significantly higher oxidative stress showing maximum GSH content expressed in percentage (P £ 0.01; **). At lower treatment doses Fe (II) states shows higher oxidative stress but are statistically insignificant.
As evident from MTT and glutathione assay that Fe (II) shows more toxicity and oxidative stress to SHSY5Y cells, a similar trend has been observed in the routine morphological analysis of cells. Fe (II)-treated cells showed more cell debris accumulation compared to cells treated with the same doses of Fe (III). At intermediated doses of Fe (II) and Fe (III), there were less cell debris and less morphological differences with Fe (III)-treated SHSY5Y cells (data not shown). Moreover, cells exhibit poor adhesion, cell shrinkage, and lose membrane integrity at higher and intermediate doses that made bright field microscopic imaging difficult.
At lower doses, cell morphology was apparently swollen and morphologically distinct in Fe (II) incubated SHSY5Y. In the past, it has been reported that cultured neuronal cells exhibits cell swelling with the presence of toxic transition metal.[18] In our experiment, we also observed the same as confirmed by AFM imaging of cultured SHSY5Y cells on vertical z-resolution and x-z cross-sectional analysis.[19]
SHSY5Y morphology in Fe + RA and Fe-RA cultures
In reference culture (without iron), RA treatment shows less number of cells, contrary to cultures grown in the absence of RA. Furthermore, SHSY5Y cells in control exhibit more stable cellular morphology with differentiated, polygonal cells exhibiting astral distribution of neurites [Figures 2a and b]. RA halts cell division in neuroblastoma cells by arresting cell division, thus, cell proliferation that might be the reason for less SHSY5Y cells in the presence of RA.[20] Cells were clustered, round and more in number in control cultures in the absence of RA [Figure 2a]. RA in iron-treated SHSY5Y cultures significantly inhibits the cell toxicity, yet cellular degeneration is more in Fe (II) treated cells compared to Fe (III) at higher and moderate (100, 10 μM) treatment as observed in microscopic images [Figures 2c–h]. Comparing di- and trivalent ionic iron (ferrous versus ferric) treatment in the presence/absence of RA, the cellular viability is significantly higher, showing clear evidence of prevention in cellular toxicity upon adding the RA as shown in category plot in Figure 3a. However, comparing cellular morphology, RA confers more flat, spread, polygonal cells with astral neurite distribution in Fe (II)-treated cells confirming that even in the presence of iron, RA supports stable neuronal differentiation (compare left versus right panels in Figures 2c–h).
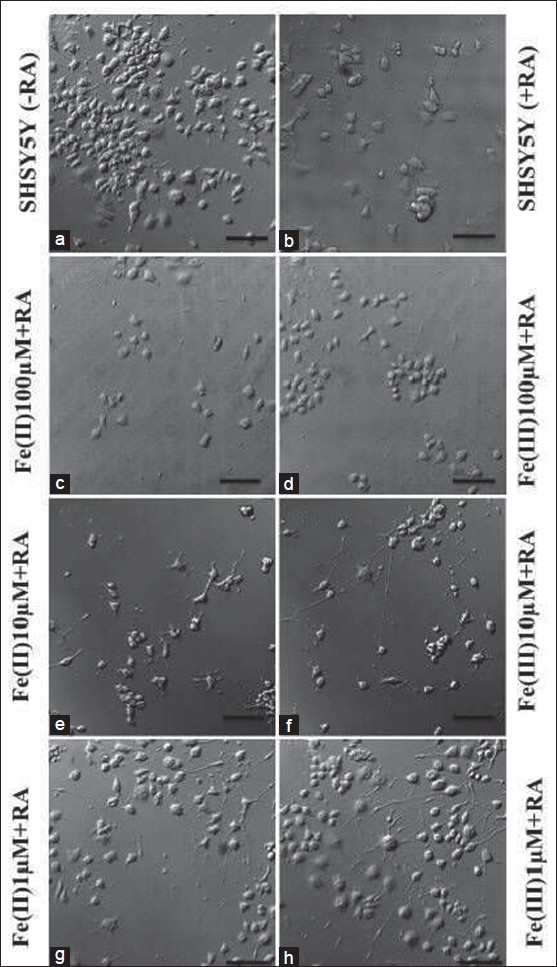
- Confocal microscopic investigation of Retinoic acid treatment to SHSY5Y cell morphology. (a, b) Confocal images showing SHSY5Y cell phenotype in presence (+) and absence (-) of RA in controls without iron treatment. (c–h) display SHSY5Y cell morphology in iron treated cells at different concentration supplemented with RA (scale bar: 50 μm)
One interesting observation we noticed in differentiated SHSY5Y at lower iron dose treatment (1 μM) is that Fe (II)-treated cells give more neurites/cells compared to Fe (III)-treated cells that demonstrate bipolar characters [Figures 2g and h]. This observation was further supported by quantification of number of neurites emerging/cells in control and iron-treated cells in the presence of RA. The category plot in Figure 3b demonstrates that average number of neurites emerging from iron-treated cells in the presence of RA at 1–10 μM concentrations is equivalent to reference control samples with RA. However, at 100 μM concentration [Figure 3b], neurites/cell decreases albeit RA supports cell survival as shown in the previous section.
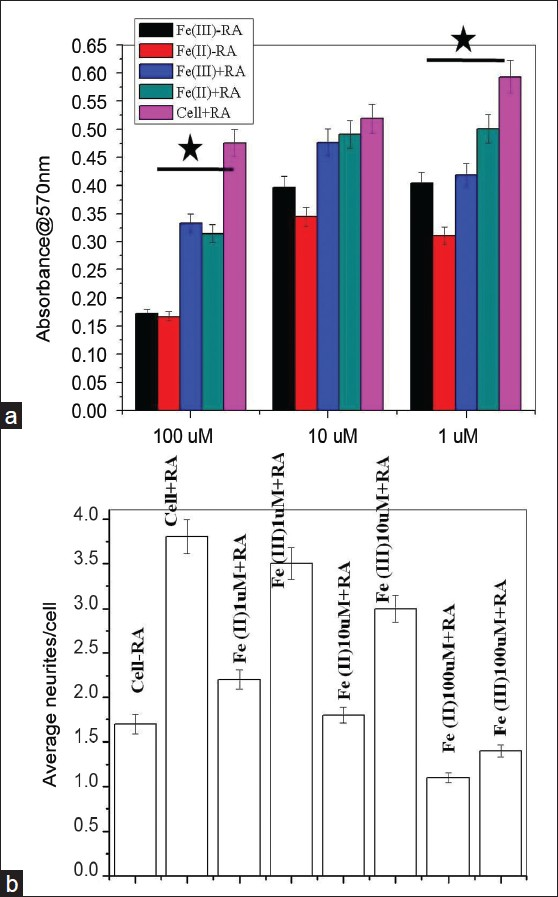
- RA protection to SHSY5Y via iron chelation and neurite quantification. (a) Category plot displays MTT assay showing the role of retinoic acid as an inducer to differentiation and apparent reversal to cellular toxicity in ionic iron microenvironment (*P ≤ 0. 05). Error bars represent standard deviations of mean values. (b) Neurite length quantifications using imageJ
RA protection to SHSY5Y cells via iron chelation
The differentiation capability of SHSY5Y cells in the presence of inducer (RA, NGF) is well known.[15] We tested the SHSY5Y in the presence of differentiation inducer trans-retinoic acid whether redox states of iron influence the neuron's functionality or no. Interestingly, cell viability and differentiation increases compared to iron treatment in the absence of RA even at higher doses of ferrous and ferric. Therefore, in spite of its differentiation inducing role, RA prevents the toxic effects of iron as evident from the category plot in Figure 3b. At moderate doses of iron, there is higher cell viability and differentiation in the presence of RA compared to cells seeded in the absence of RA albeit statistically insignificant. At lower doses of Fe (II), RA supports significantly higher SHSY5Y cell viability and differentiation compared to cells grown in the absence of RA. In case of Fe (III), we observed similar trends but statistically insignificant.
Effect of iron treatment on SHSY5Y cytoskeleton morphology
For the accuracy of the cytoskeleton analysis of iron-treated SHSY5Y cells, we selected two controls for immunostaining of F-actin component of the cytoskeleton: SHSY5Y cells in the presence and absence of RA. Cells grown in the absence of the RA, show more proliferation and exhibit either tightly clustered into “clumps” or loosely dispersed as a monolayer. Smooth, relatively unbranched processes were dominant features as observed in immunostained micrograph shown in 4a and b. Contrary to this, iron-treated cells in the absence of RA show round morphology and less differentiated cytoskeleton [compare Figures 4a, b: RA ± iron II and III]. Therefore, cytoskeleton staining gives a clear picture of influence of RA in the differentiation of SHSY5Y in the presence of toxic ionic iron states. However, in the presence of trans-retinoic acid that is intended to induce differentiation, cells show expanded volume, branched neurites and less visible cell aggregates [Figure 4b].
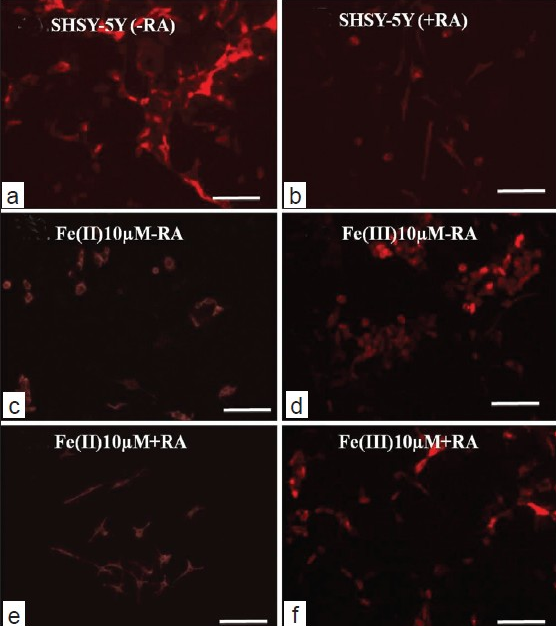
- Immunostaning and cytoskeleton studies of SHSY5Y cell in the presence and absence of RA (scale bar: 50 μm).
For the fluorescence immunostaining of SHSY5Y cells in iron co-culture in the presence of RA, we picked intermediate concentration (10 μM) as membrane disintegration was dominant at higher concentration (100 μM). For that reason, it was difficult to observe the membrane cytoskeleton features at 100 μM treatment. Data for Immunofluorescence analysis of lower concentration (1 μM) is not shown herewith albeit exhibited similar features to that of reference culture as mentioned in the previous section. At intermediate concentration, iron and SHSY5Y co-cultures grown in the absence of RA show cultures stained F-actin positive features in the aggregated cells both in ionic Fe (II)- and Fe (III)-treated cultures. No specific distribution of cytoskeleton pattern has been observed although cells in Fe (II)-treated cells show more polygonal F-actin components with respect to Fe (III) treated cells that retain more circular and clumped cytoskeleton elements [Figures 4c and 4d]. In the presence of RA, co-culture of iron and SHSY5Y cells revealed immunostained F-actin components of differentiated cells with long dendrites and multiple emerging neurites. SHSY5Y cells demonstrate large cytoplasm in Fe (II)-treated cultures compared to Fe (III) where less monodispersed cells were observed [Figures 4e and f]. The results support the microscopic image analysis as described before in the results section. Difference in the Alexa 488 stained intensities in Figures 4c, e compared to d–f, may arise due to the differences in selecting parameters for imaging channels of these samples via the confocal laser scanning microscope.
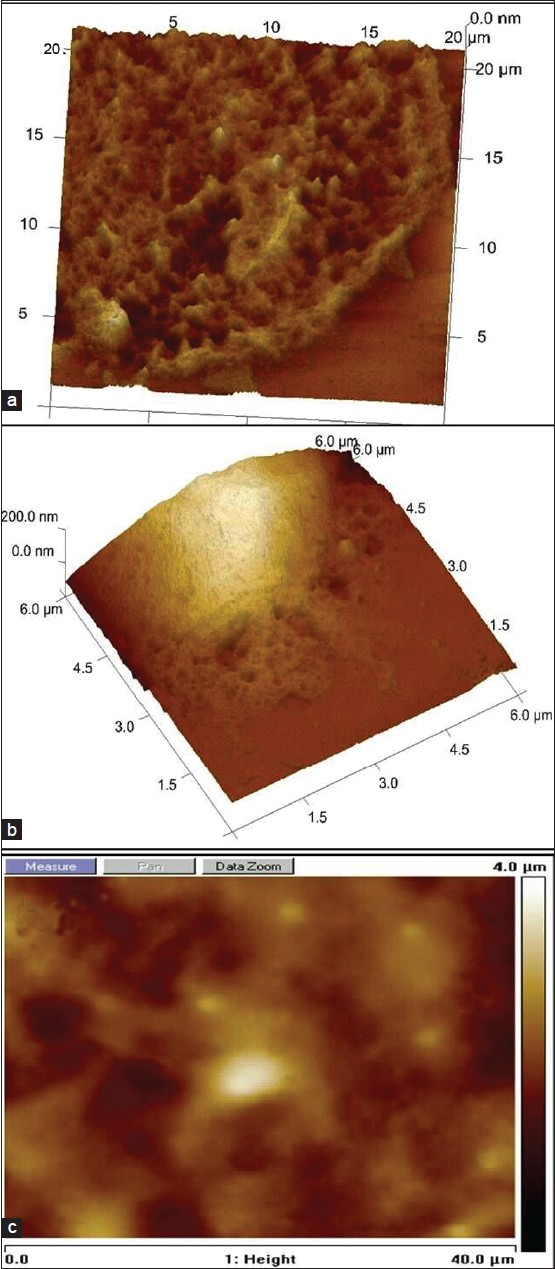
RA-induced clustering: antioxidant properties of RA in a new role
AFM images show polycrystalline, granular, rough film of ns-TiOx produced by supersonic cluster beam deposition (SCBD) equipped with a pulsed microplasma cluster source.[161721] The same test sample was imaged after RA + iron drop coating and incubation, exhibit big cluster that apparently arises due to RA-induced chelation and nucleation effect on iron [compare Figures 5a and b]. Inset, in Figure 5b shows large clusters formed by iron-RA complex at higher concentration (100 μM) due to the availability of more ionic species for nucleation and seeded growth. Figures 5c, d represents 3d surface plots of ns-TiOx (C) and same sample incubated with RA + iron complex (d), exhibiting big clusters of iron + RA on ns-TiOx on 3D z-scale of AFM. Figures 5e, f demonstrates control experiment to elucidate the clusters observed in 5.b is due to chelation between RA and ionic iron moieties and it is not induced by ns-TiOx surface. Figure 5e exhibits ferric iron (100 μM) species incubated over ns-TiOx surface and 5.f shows RA over ns-TiOx. Comparing AFM images e-f with 5.b, it is evident that aggregation occurs in the presence of RA + ionic iron.
- AFM imaging to assess the chelation effect of RA on redox state of iron. (a) AFM image of a cluster-assembled, 50 nm thick ns-TiO2 films. (b) Nanoscale aggregation formed after chelation of ionic iron with RA. (c, d) 3D surface plot of ns-TiOx in (RA-Fe) and (RA + Fe) respectively. (e, f) Control showing interactions of Ferric ion (e) and RA (f) (scan: 500 × 500 nm2)
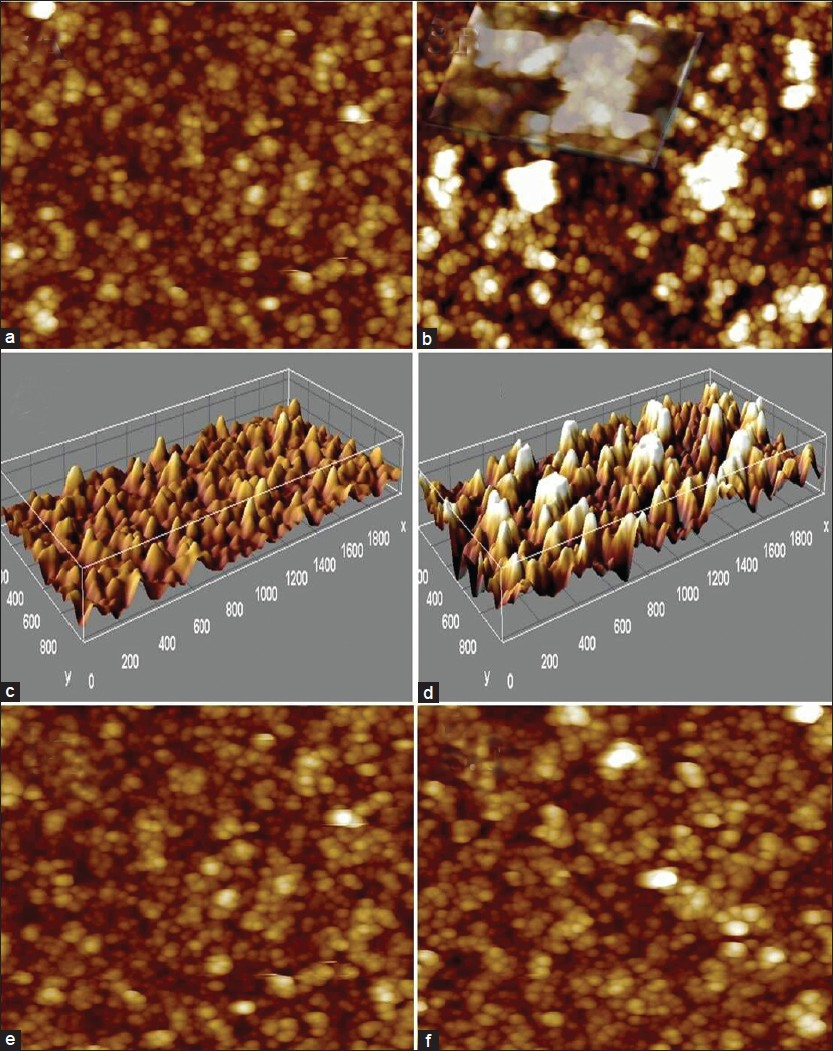
Fe (II) induces SHSY5Y fenestration at higher concentrations and swelling at moderate concentration
During 3-day culture of SHSY5Y cells, we observed more disintegrated neuronal cells. We investigated the fine details of cell membrane using AFM imaging and observed fenestration in the cell membrane of Fe (II) treated SHSY5Y cells at higher concentration as shown in Figure 6a. This was apparently absent or less prominent in Fe (III) treated cells at the same concentration as shown in Figure 6b. Ferric iron-treated SHSY5Y cells show cell membrane damage more at cell margins compared with ferrous treated cells shown in 6.a. For the brevity, data for Fe (II and III) treated cells at other concentration are not shown. Figure 6c demonstrates a control where iron treated SHSY5Y cells cultured in the presence of RA. From the AFM images it is evident that the majority of cells are present in a differentiated state with a fine network of neurite processes. Thus, showing rescue effect of RA in the presence of iron treatment to SHSY5Y cells.
- Three-dimensional and top-view of AFM images to assess cell fenestration and swelling induced by redox ionic iron. (a) AFM image showing SHSY5Y cell fenestration at higher level of Fe (II) treatment. (b) SHSY5Y cell treated with Fe (III). (c) AFM imaging of SHSY5Y cells treated with ionic iron + RA.
Another notable observation we made with microscopic analysis during SHSY5Y culture with iron treatment was the expanded cell volume in cultures containing intermediate concentrations of Fe (II). In AFM images and cross section profile with extended z-scale resolution, we found that SHSY5Y dimension is more on x-z-scale at 10 μM doses of Fe (II) as shown in Figures 7a, b. This may arise due to cell swelling in cultures with Fe (II) treatment and explores a unique feature of ferrous toxicity compared to ferric ionic state influence on neuronal cell morphology in the iron microenvironment [Figure 7b]. The inset in images A–B displays the cross-sectional profile of cells showing vertical dimensions on the x–z scale.
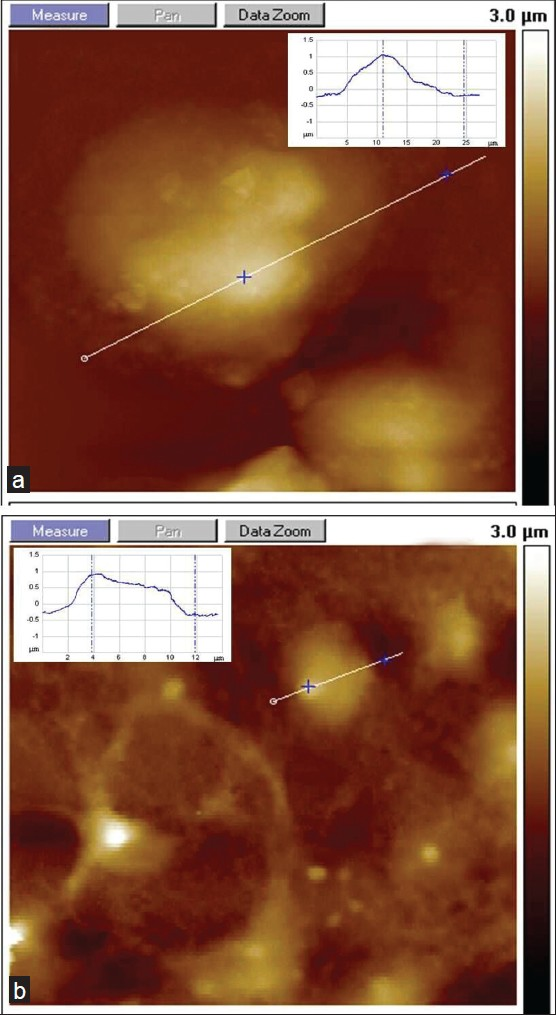
- AFM investigation of SHSY5Y cell swelling with the presence of ionic iron. (a) Fe (II)-treated SHSY5Y shows swelling and increased cell volume. (b) Reference substrate without iron (inset represents a cross section of the AFM image of SHSY5Y cells; x–z coordinates: 8–25 μm)
Discussions
The metalobiology of iron has been the center of attention in recent years due to its vital role in the pathophysiology of neurodegenerative disorders under the conditions of iron overload and dysregulated cellular homeostasis.[1022] Various techniques have revealed the quantification of redox iron and degeneration caused due to unwanted accumulation of iron in vivo.[1223] However, there is lack of reports showing the quantitative role of ionic states of iron in neuronal toxicity and morphological changes, utilizing suitable in vitro models. This study demonstrates systematic toxicity evaluation of the ferrous and ferric ionic state of iron using SHSY5Y cell line. This cell line has been extensively studied in recent years for the evaluation of neurotoxicity due to its ability to maintain in proliferation state and/or undergo differentiation in inducing media.[15] For toxicity evaluation, we have specifically chosen a concentration range from 1–100 μM due to the fact that beyond these concentrations there is almost complete arrests of cell proliferation in in vitro system as stated in few of previous reports.[24] MTT assay is an established colorimetric assay to evaluate cell toxicity and, therefore, metabolic dysfunction due to the presence of toxic moiety in cell culture medium, thus, indicating cell viability and proliferation in vitro.[25] Cell quantifications using the assay demonstrated highest toxicity for Fe (II). We found the maximum amount of free Fe (II) in cell culture media that might be responsible for higher toxicity to SHSY5Y cells (quantitative data not shown). Moreover, in all treated doses, glutathione assay shows that reduced glutathione levels were significantly higher in Fe (II) compared to Fe (III)-treated SHSY5Y cells and control experiments. This clearly reflects and explains that reduced cell viability in the ferrous ionic state (particularly at higher and intermediate Fe (II) doses) arises due to oxidative stress and subsequent cell death.
This might be due to the involvement of Fe (II) state of ionic iron as strong catalytic initiator of Fenton's reaction generating ROS as suggested in classic the Haber-Weiss study.[5626] Moreover, cells growing in ferrous ionic media appeared more senile and disintegrated morphology forming cellular debris. This probably results due to the increased cell membrane (lipid–protein) peroxidation via Fe (II)-induced Fenton's reaction.[8] In addition, the most striking observation we made is the SHSY5Y cell membrane fenestration using AFM in the media feed with Fe (II). It is another outcome of strong membrane peroxidation with ROS in condition of iron overload, as the lethal factor to cellular morphology at higher ionic iron.
Another severe side effect of heavy metal mediated ROS generation is the cell edema that produces cell swelling in vitro.[19] AFM imaging had revealed that z-scale vertical dimension of the cells was relatively higher (2–3 μm) than those of ferric treated and reference samples in our test (data not shown for other samples; z-scale 0.5–1 μm). Prima facie, it demonstrates that there is apparent cell swelling due to induced oxidative stress in culture microenvironment; however, it needs further cell volume measurement and evidence of the mechanism involved.[27]
The differentiation potential of SHSY5Y cells in the presence of RA is very well studied.[1528] We investigated whether there is any effect of redox iron treatment on neuroblastoma differentiation. Surprisingly RA substantially prevents the iron-induced toxicity as number of cells demonstrated spreading and outgrowth in cellular processes in microscopic observations. In previous studies, RA-Iron complexes reveal that Fe (III) exhibits higher sensitivity towards RA chelation and this might be due to the higher oxidation state that facilitates more complication compare to lower redox state in ferrous ion.[29] Moreover, cells show neurite formation in iron-treated culture in the presence of RA with cell characteristic typical of RA-induced SHSY5Y cell differentiation as confirmed by neurite quantification using imageJ analysis.[15] We further investigated the cause of this supportive role of RA in preventing the iron-induced cell toxicity. AFM imaging demonstrated that RA + iron incubated samples when imaged over ns-TiO2 substrate exhibits cluster formation that arises due to RA-mediated chelation of iron. Putatively, RA and iron may undergo complex formation as mentioned in few previous reports with similar bio-organic molecules.[30] The RA with iron complex formation certainly reduces the molar ionic iron available for catastrophic initiation of Fenton's reaction that damages the cell membrane and carries peroxidation of DNA, lipid, protein moieties via ROS generation. The presence of big clusters of higher concentration of Fe (II) as shown in the inset on Figure 5b, indicate that initial iron-RA complex invites further free ionic species present in medium to complex and undergo surface growth forming big clusters.
This in vitro module can be represented as mechanistic elucidation how retinoic acids prevent hepatic iron overload in few classical in vivo studies.[31] Moreover, in relation with anti-oxidant properties of RA as a neuroprotective agent in the previous reports as scavenger of free radicals has been attributed as a mechanism of protection. This RA + Fe (II-III) complexation as shown in 3D surface plot of AFM images in Figures 5c, d may open new avenues for RA as a novel iron chelator.[32]
Conclusion
We demonstrated a simple and facile in vitro model to examine divalent against trivalent ionic iron toxicity. Cell viability and metabolic status of SHSY5Y cells as evaluated by MTT assay shown that the ferrous form of ionic iron is more toxic and leads to cellular disintegration, cell membrane fenestration and cell swelling. GSH assay revealed the apparently more oxidative stress to SHSY5Y cells treated with Fe (II) doses. Retinoic acid that has long been used as inducer to SHSY5Y differentiation has shown the capability to inhibit the toxic effects of ionic iron via complex formation. This study certainly helps in correlating in vivo localization of stored nonheme ionic iron and its toxicity based on their redox state on clinical findings of various neurodegenerative disorders. Furthermore, findings of the study bring new insight into the antioxidant properties of RA, not only as a scavenger to ROS but also as an ionic iron chelating agent.
Source of Support: Pubmed, medline, google scholar, scopus
Conflict of Interest: None declared
References
- Physiological functions of mineral micronutrients (Cu, Zn, Mn, Fe, Ni, Mo, B, Cl) Curr Opin Plant Biol. 2009;12:259-66.
- [Google Scholar]
- Role of micronutrients in the periconceptional period. Hum Reprod Update. 2010;16:80-95.
- [Google Scholar]
- Cell interaction with nanopatterned surface of implants. Nanomedicine (Lond). 2010;5:937-47.
- [Google Scholar]
- Oral repletion of iron induces free radical mediated alterations in the gastrointestinal tract of rat. Mol Cell Biochem. 2001;219:91-8.
- [Google Scholar]
- Oxidative stress and neurodegenerative diseases: A review of upstream and downstream antioxidant therapeutic options. Curr Neuropharmacol. 2009;7:65-74.
- [Google Scholar]
- Chronic cerebrospinal venous insufficiency in patients with multiple sclerosis. J Neurol Neurosurg Psychiatry. 2009;80:392-9.
- [Google Scholar]
- The big idea: Iron-dependent inflammation in venous disease and proposed parallels in multiple sclerosis. J R Soc Med. 2006;99:589-93.
- [Google Scholar]
- Anomalous venous blood flow and iron deposition in multiple sclerosis. J Cereb Blood Flow Metab. 2009;29:1867-78.
- [Google Scholar]
- Cellular and subcellular localizations of nonheme ferric and ferrous iron in the rat brain: A light and electron microscopic study by the perfusion-Perls and -Turnbull methods. Arch Histol Cytol. 2008;71:205-22.
- [Google Scholar]
- Effects of all-trans-retinoic acid on human SH-SY5Y neuroblastoma as in vitro model in neurotoxicity research. Neurotoxicology. 2009;30:127-35.
- [Google Scholar]
- Adsorption and stability of streptavidin on cluster-assembled nanostructured TiOx films. Langmuir. 2008;24:11637-44.
- [Google Scholar]
- The effect of surface nanometre-scale morphology on protein adsorption. PLoS One. 2010;5:e11862.
- [Google Scholar]
- Hypoosmotic swelling affects zinc homeostasis in cultured rat astrocytes. Glia. 2009;57:79-92.
- [Google Scholar]
- Manganese induces cell swelling in cultured astrocytes. Neurotoxicology. 2007;28:807-12.
- [Google Scholar]
- All-trans retinoic acid arrests neuroblastoma cells in a dormant state. Subsequent nerve growth factor/brain-derived neurotrophic factor treatment adds modest benefit. J Pediatr Surg. 2008;43:1284-94.
- [Google Scholar]
- Cluster beam deposition: A tool for nanoscale science and technology. J Phys D Appl Phys. 2006;39:R439-59.
- [Google Scholar]
- Brain iron metabolism and neurodegenerative disorders. Dev Neurosci. 2002;24:188-96.
- [Google Scholar]
- Imaging iron stores in the brain using magnetic resonance imaging. Magn Reson Imaging. 2005;23:1-25.
- [Google Scholar]
- Changes in antioxidative activities induced by Fe (II) and Fe (III) in cultured vero cells. Arch Environ Contam Toxicol. 1996;30:431-6.
- [Google Scholar]
- Rapid colorimetric assay for cellular growth and survival: Application to proliferation and cytotoxicity assays. J Immunol Methods. 1983;65:55-63.
- [Google Scholar]
- The Haber-Weiss cycle -- 70 years later: An alternative view. Redox Rep. 2002;7:55-7.
- [Google Scholar]
- A method using 3-O-methyl-D-glucose and phloretin for the determination of intracellular water space of cells in monolayer culture. Anal Biochem. 1975;68:537-44.
- [Google Scholar]
- Retinoic acid-induced differentiation of cultured human neuroblastoma cells: A comparison with phorbolester-induced differentiation. Cell Differ. 1984;14:135-44.
- [Google Scholar]
- Rapid removal of excessive iron with daily, high-dose intravenous chelation therapy. J Pediatr. 1989;115:151-5.
- [Google Scholar]
- Iron-chelation properties of phenolic acids bearing catechol and galloyl groups. Food Chem. 2006;98:23-31.
- [Google Scholar]
- All-trans retinoic acid as a novel therapeutic strategy for Alzheimer's disease. Expert Rev Neurother. 2009;9:1615-21.
- [Google Scholar]


